Download to read offline
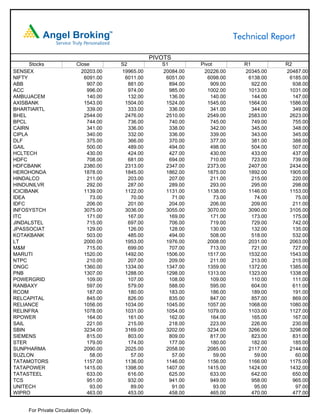

The document provides a market summary for October 13, 2010. It reports that indices like Nifty and Sensex opened flat and closed in negative territory, down 0.73% and 0.67% respectively. Top gainers were M&M, RCOM, and TCS, while top losers were KOTAKBANK, DLF, and JPASSOCIAT. Most sectors closed in the negative territory as well. Key support and resistance levels are identified for indices and stocks. Potential positive and negative stocks over the next 2-3 days are also highlighted.


