Data Visualization with R.ggplot2 and its extensions examples.
•Download as DOCX, PDF•
1 like•572 views

ggplot2 and its extensions examples. lattice-latticeExtra-gridextra packages ref:http://r-statistics.co

Recommended
Recommended
More Related Content
What's hot
What's hot (20)
Viewers also liked
Viewers also liked (18)
Similar to Data Visualization with R.ggplot2 and its extensions examples.
Similar to Data Visualization with R.ggplot2 and its extensions examples. (20)
More from Dr. Volkan OBAN
More from Dr. Volkan OBAN (20)
Recently uploaded
Recently uploaded (20)
Data Visualization with R.ggplot2 and its extensions examples.
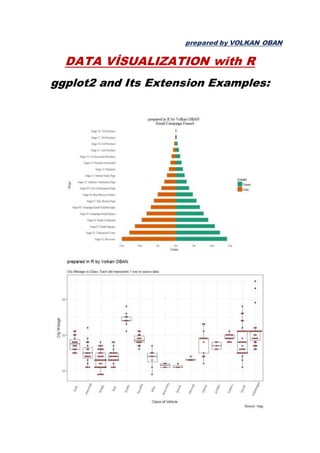
- 1. prepared by VOLKAN OBAN DATA VİSUALIZATION with R ggplot2 and Its Extension Examples:
- 8. theme(panel.background = element_rect(fill = 'paleturquoise'), panel.grid.major = e lement_line(colour = "purple2", size=3), panel.grid.minor = element_line(colour = " red4", size=1))
- 12. corr <- round(cor(mtcars), 2) df <- reshape2::melt(corr) gg <- ggplot(df, aes(x=Var1, y=Var2, fill=value, label=value)) + geom_tile() + theme_bw() + geom_text(aes(label=value, size=value), color="white") + labs(title="mtcars - Correlation plot") + theme(text=element_text(size=20), legend.position="none") library(RColorBrewer) p2 <- gg + scale_fill_distiller(palette="Reds") p3 <- gg + scale_fill_gradient2() gridExtra::grid.arrange(gg, p2, p3, ncol=3)
- 13. lattice example:
- 14. Code: library(semPlot) library(lavaan) library(clusterGeneration) #this is to generate a positive definite covariance matrix #simulate some data set.seed(1222) sig<-genPositiveDefMat("onion",dim=5,eta=4)$Sigma #the covariance matrix mus<-c(10,5,120,35,6) #the vector of the means data<-as.data.frame(mvrnorm(100,mu=mus,Sigma=sig)) #the dataset names(data)<-c("CO2","Temp","Nitro","Biom","Rich") #giving it some names #building an SEM with a latent variable m<-'Abiot =~ CO2 + Temp + Nitro Biom ~ Abiot Rich ~ Abiot + Biom' m.fit<-sem(m,data) #the plot #basic version, the what arguments specify what should be plotted, here we choose to look at the standardized path coefficients semPaths(m.fit,what="std",layout="circle")