![Prepared by Volkan OBAN
k-means Clustering in Python.
scikit-learn
Machine Learning in Python
from sklearn.cluster import KMeans
ref: http://scikit-learn.org/stable/auto_examples/cluster/plot_cluster_iris.html
Code:
print(__doc__)
# Code source: Gaël Varoquaux
# Modified for documentation by Jaques Grobler
# License: BSD 3 clause
import numpy as np
import matplotlib.pyplot as plt
from mpl_toolkits.mplot3d import Axes3D
from sklearn.cluster import KMeans
from sklearn import datasets
np.random.seed(5)
centers = [[1, 1], [-1, -1], [1, -1]]](https://image.slidesharecdn.com/kmeansinpython-170413180354/85/k-means-Clustering-in-Python-1-320.jpg)
![Prepared by Volkan OBAN
k-means Clustering in Python.
scikit-learn
Machine Learning in Python
from sklearn.cluster import KMeans
ref: http://scikit-learn.org/stable/auto_examples/cluster/plot_cluster_iris.html
Code:
print(__doc__)
# Code source: Gaël Varoquaux
# Modified for documentation by Jaques Grobler
# License: BSD 3 clause
import numpy as np
import matplotlib.pyplot as plt
from mpl_toolkits.mplot3d import Axes3D
from sklearn.cluster import KMeans
from sklearn import datasets
np.random.seed(5)
centers = [[1, 1], [-1, -1], [1, -1]]](https://image.slidesharecdn.com/kmeansinpython-170413180354/75/k-means-Clustering-in-Python-1-2048.jpg)
![iris = datasets.load_iris()
X = iris.data
y = iris.target
estimators = {'k_means_iris_3': KMeans(n_clusters=3),
'k_means_iris_8': KMeans(n_clusters=8),
'k_means_iris_bad_init': KMeans(n_clusters=3, n_init=1,
init='random')}
fignum = 1
for name, est in estimators.items():
fig = plt.figure(fignum, figsize=(4, 3))
plt.clf()
ax = Axes3D(fig, rect=[0, 0, .95, 1], elev=48, azim=134)
plt.cla()
est.fit(X)
labels = est.labels_
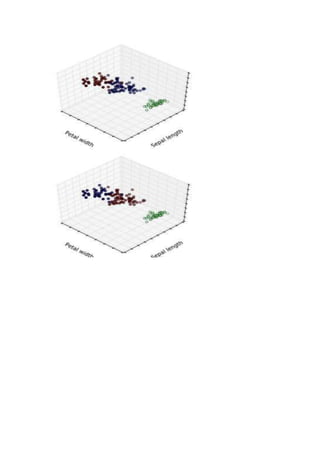
ax.scatter(X[:, 3], X[:, 0], X[:, 2], c=labels.astype(np.float))
ax.w_xaxis.set_ticklabels([])
ax.w_yaxis.set_ticklabels([])
ax.w_zaxis.set_ticklabels([])
ax.set_xlabel('Petal width')
ax.set_ylabel('Sepal length')
ax.set_zlabel('Petal length')
fignum = fignum + 1
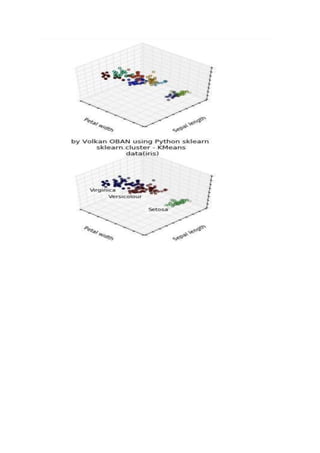
# Plot the ground truth
fig = plt.figure(fignum, figsize=(4, 3))
plt.clf()
ax = Axes3D(fig, rect=[0, 0, .95, 1], elev=48, azim=134)](https://image.slidesharecdn.com/kmeansinpython-170413180354/85/k-means-Clustering-in-Python-2-320.jpg)
![plt.cla()
for name, label in [('Setosa', 0),
('Versicolour', 1),
('Virginica', 2)]:
ax.text3D(X[y == label, 3].mean(),
X[y == label, 0].mean() + 1.5,
X[y == label, 2].mean(), name,
horizontalalignment='center',
bbox=dict(alpha=.5, edgecolor='w', facecolor='w'))
# Reorder the labels to have colors matching the cluster results
y = np.choose(y, [1, 2, 0]).astype(np.float)
ax.scatter(X[:, 3], X[:, 0], X[:, 2], c=y)
ax.w_xaxis.set_ticklabels([])
ax.w_yaxis.set_ticklabels([])
ax.w_zaxis.set_ticklabels([])
ax.set_xlabel('Petal width')
ax.set_ylabel('Sepal length')
ax.set_zlabel('Petal length')
plt.show()](https://image.slidesharecdn.com/kmeansinpython-170413180354/85/k-means-Clustering-in-Python-3-320.jpg)

The document describes a Python implementation of k-means clustering using the scikit-learn library, applied to the Iris dataset. It includes code examples for creating k-means estimators with varying clusters and visualizes the results in 3D plots. The document also demonstrates how to compare clustering outputs with the actual labels of the Iris dataset.