Download to read offline
![Prepared by Volkan OBAN
CLUSTERGRAM
SOURCE:
https://gist.github.com/hadley/439761 (hadley/clustergram-had.r)
http://www.r-statistics.com/tag/large-data/
CODES:
> clustergram.kmeans <- function(Data, k, ...)
+ {
+ # this is the type of function that the clustergram
+ # function takes for the clustering.
+ # using similar structure will allow implementation of differe
nt clustering algorithms
+
+ # It returns a list with two elements:
+ # cluster = a vector of length of n (the number of subjects/items)
+ # indicating to which cluster each item belong
s.
+ # centers = a k dimensional vector. Each element is 1 number that re
present that cluster
+ # In our case, we are using the weighted mean
of the cluster dimensions by
+ # Using the first component (loading) of the P
CA of the Data.
+
+ cl <- kmeans(Data, k,...)
+
+ cluster <- cl$cluster
+ centers <- cl$centers %*% princomp(Data)$loadings[,1] # 1 number per
center
+ # here we are using the weighted mean for each
+
+ return(list(
+ cluster = cluster,
+ centers = centers
+ ))
+ }
>
> clustergram.plot.matlines <- function(X,Y, k.range,
+ x.range, y.range , COL,
+ add.center.points , centers.points)
+ {
+ plot(0,0, col = "white", xlim = x.range, ylim = y.range,
+ axes = F,
+ xlab = "Number of clusters (k)", ylab = "PCA weighted Mean of th
e clusters", main = c("Clustergram of the PCA-weighted Mean of" ,"the clust
ers k-mean clusters vs number of clusters (k)"))
+ axis(side =1, at = k.range)
+ axis(side =2)](https://image.slidesharecdn.com/cluster-160629193731/85/CLUSTERGRAM-1-320.jpg)
![Prepared by Volkan OBAN
CLUSTERGRAM
SOURCE:
https://gist.github.com/hadley/439761 (hadley/clustergram-had.r)
http://www.r-statistics.com/tag/large-data/
CODES:
> clustergram.kmeans <- function(Data, k, ...)
+ {
+ # this is the type of function that the clustergram
+ # function takes for the clustering.
+ # using similar structure will allow implementation of differe
nt clustering algorithms
+
+ # It returns a list with two elements:
+ # cluster = a vector of length of n (the number of subjects/items)
+ # indicating to which cluster each item belong
s.
+ # centers = a k dimensional vector. Each element is 1 number that re
present that cluster
+ # In our case, we are using the weighted mean
of the cluster dimensions by
+ # Using the first component (loading) of the P
CA of the Data.
+
+ cl <- kmeans(Data, k,...)
+
+ cluster <- cl$cluster
+ centers <- cl$centers %*% princomp(Data)$loadings[,1] # 1 number per
center
+ # here we are using the weighted mean for each
+
+ return(list(
+ cluster = cluster,
+ centers = centers
+ ))
+ }
>
> clustergram.plot.matlines <- function(X,Y, k.range,
+ x.range, y.range , COL,
+ add.center.points , centers.points)
+ {
+ plot(0,0, col = "white", xlim = x.range, ylim = y.range,
+ axes = F,
+ xlab = "Number of clusters (k)", ylab = "PCA weighted Mean of th
e clusters", main = c("Clustergram of the PCA-weighted Mean of" ,"the clust
ers k-mean clusters vs number of clusters (k)"))
+ axis(side =1, at = k.range)
+ axis(side =2)](https://image.slidesharecdn.com/cluster-160629193731/75/CLUSTERGRAM-1-2048.jpg)
![+ abline(v = k.range, col = "grey")
+
+ matlines(t(X), t(Y), pch = 19, col = COL, lty = 1, lwd = 1.5)
+
+ if(add.center.points)
+ {
+ require(plyr)
+
+ xx <- ldply(centers.points, rbind)
+ points(xx$y~xx$x, pch = 19, col = "red", cex = 1.3)
+
+ # add points
+ # temp <- l_ply(centers.points, function(xx) {
+ # with(xx,points(y~x, pch = 19, col = "red", cex = 1.3))
+ # points(xx$y~xx$x, pch = 19, col = "red", cex = 1.3)
+ # return(1)
+ # })
+ # We assign the lapply to a variable (temp) only to suppress the
lapply "NULL" output
+ }
+ }
>
>
>
> clustergram <- function(Data, k.range = 2:10 ,
+ clustering.function = clustergram.kmeans,
+ clustergram.plot = clustergram.plot.matlines,
+ line.width = .004, add.center.points = T)
+ {
+ # Data - should be a scales matrix. Where each column belongs to a d
ifferent dimension of the observations
+ # k.range - is a vector with the number of clusters to plot the clust
ergram for
+ # clustering.function - this is not really used, but offers a bases t
o later extend the function to other algorithms
+ # Although that would more work on the code
+ # line.width - is the amount to lift each line in the plot so they wo
n't superimpose eachother
+ # add.center.points - just assures that we want to plot points of the
cluster means
+
+ n <- dim(Data)[1]
+
+ PCA.1 <- Data %*% princomp(Data)$loadings[,1] # first principal comp
onent of our data
+
+ if(require(colorspace)) {
+ COL <- heat_hcl(n)[order(PCA.1)] # line colors
+ } else {
+ COL <- rainbow(n)[order(PCA.1)] # line colors
+ warning('Please consider installing the package "colorspace" for
prittier colors')
+ }
+
+ line.width <- rep(line.width, n)
+
+ Y <- NULL # Y matrix
+ X <- NULL # X matrix
+
+ centers.points <- list()
+
+ for(k in k.range)](https://image.slidesharecdn.com/cluster-160629193731/85/CLUSTERGRAM-2-320.jpg)
![+ {
+ k.clusters <- clustering.function(Data, k)
+
+ clusters.vec <- k.clusters$cluster
+ # the.centers <- apply(cl$centers,1, mean)
+ the.centers <- k.clusters$centers
+
+ noise <- unlist(tapply(line.width, clusters.vec, cumsum))[order(s
eq_along(clusters.vec)[order(clusters.vec)])]
+ # noise <- noise - mean(range(noise))
+ y <- the.centers[clusters.vec] + noise
+ Y <- cbind(Y, y)
+ x <- rep(k, length(y))
+ X <- cbind(X, x)
+
+ centers.points[[k]] <- data.frame(y = the.centers , x = rep(k , k
))
+ # points(the.centers ~ rep(k , k), pch = 19, col = "red", cex
= 1.5)
+ }
+
+
+ x.range <- range(k.range)
+ y.range <- range(PCA.1)
+
+ clustergram.plot(X,Y, k.range,
+ x.range, y.range , COL,
+ add.center.points , centers.points)
+
+
+ }
>
>
>
>
> if(F) {
+
+ #Examples:
+
+ png("d:clustergram_plots_%03d.png",650,650, pointsize = 15)
+
+ data(iris)
+ set.seed(250)
+ par(cex.lab = 1.5, cex.main = 1.2)
+ Data <- scale(iris[,-5]) # notice I am scaling the vectors)
+ clustergram(Data, k.range = 2:8, line.width = 0.004) # notice how I a
m using line.width. Play with it on your problem, according to the scale o
f Y.
+
+ set.seed(500)
+ Data <- scale(iris[,-5]) # notice I am scaling the vectors)
+ par(cex.lab = 1.2, cex.main = .7)
+ par(mfrow = c(3,2))
+ for(i in 1:6) clustergram(Data, k.range = 2:8 , line.width = .004, ad
d.center.points = T)
+ par(mfrow = c(1,1))
+
+ set.seed(250)
+ Data <- rbind(
+ cbind(rnorm(100,0, sd = 0.3),rnorm(100,0, sd = 0.3),rnorm(100,0,
sd = 0.3)),](https://image.slidesharecdn.com/cluster-160629193731/85/CLUSTERGRAM-3-320.jpg)
![+ cbind(rnorm(100,1, sd = 0.3),rnorm(100,1, sd = 0.3),rnorm(100,1,
sd = 0.3)),
+ cbind(rnorm(100,2, sd = 0.3),rnorm(100,2, sd = 0.3),rnorm(100,2,
sd = 0.3))
+ )
+ clustergram(Data, k.range = 2:5 , line.width = .004, add.center.point
s = T)
+
+ set.seed(250)
+ Data <- rbind(
+ cbind(rnorm(100,1, sd = 0.3),rnorm(100,0, sd = 0.3),rnorm(100,0,
sd = 0.3),rnorm(100,0, sd = 0.3)),
+ cbind(rnorm(100,0, sd = 0.3),rnorm(100,1, sd = 0.3),rnorm(100,0,
sd = 0.3),rnorm(100,0, sd = 0.3)),
+ cbind(rnorm(100,0, sd = 0.3),rnorm(100,1, sd = 0.3),rnorm(100,1,
sd = 0.3),rnorm(100,0, sd = 0.3)),
+ cbind(rnorm(100,0, sd = 0.3),rnorm(100,0, sd = 0.3),rnorm(100,0,
sd = 0.3),rnorm(100,1, sd = 0.3))
+ )
+ clustergram(Data, k.range = 2:8 , line.width = .004, add.center.point
s = T)
+
+ dev.off()
+ }
>source("http://www.r-statistics.com/wp-content/uploads/2012/01/source_http
s.r.txt") # Making sure we can source code from github
>source_https("https://raw.github.com/talgalili/R-code-snippets/master/clus
tergram.r")
> data(iris)
> set.seed(250)
> par(cex.lab = 1.5, cex.main = 1.2)
> Data <- scale(iris[,-5]) # notice I am scaling the vectors)
> clustergram(Data, k.range = 2:8, line.width = 0.004)](https://image.slidesharecdn.com/cluster-160629193731/85/CLUSTERGRAM-4-320.jpg)
![source("http://www.r-statistics.com/wp-
content/uploads/2012/01/source_https.r.txt") #
Making sure we can source code from github
source_https("https://raw.github.com/talgalili/
R-code-snippets/master/clustergram.r")
set.seed(500)
Data <- scale(iris[,-5]) # notice I am scaling
the vectors)
par(cex.lab = 1.2, cex.main = .7)
par(mfrow = c(3,2))
for(i in 1:6) clustergram(Data, k.range = 2:8 ,
line.width = .004, add.center.points = T)](https://image.slidesharecdn.com/cluster-160629193731/85/CLUSTERGRAM-5-320.jpg)
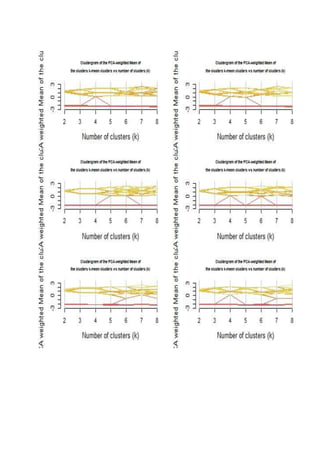

The document details the implementation of a clustering function in R, particularly using K-means clustering and visualizations through a 'clustergram'. It outlines the structure of the function, including parameters for data, range of clusters, and plotting methods. Additionally, it provides examples using the Iris dataset and random data for practical understanding of the clustering visualization process.


![Some R Examples[R table and Graphics] -Advanced Data Visualization in R (Some...](https://cdn.slidesharecdn.com/ss_thumbnails/exampless-160922204223-thumbnail.jpg?width=640&height=640&fit=bounds)


![Some Examples in R- [Data Visualization--R graphics]](https://cdn.slidesharecdn.com/ss_thumbnails/rchart-160729210112-thumbnail.jpg?width=640&height=640&fit=bounds)