Download to read offline
![Reference: https://github.com/Ather-Energy/ggTimeSeries
ggplot2 extensions-
ggTimeSeries
prepared by Volkan OBAN
Examples:
devtools::install_github('Ather-Energy/ggTimeSeries')
minimalTheme = theme_set(theme_bw(12))
minimalTheme = theme_update(
axis.ticks = element_blank(),
legend.position = 'none',
strip.background = element_blank(),
panel.border = element_blank(),
panel.background = element_blank(),
panel.grid = element_blank(),
panel.border = element_blank()
)
set.seed(1)
dtData = data.table(
DateCol = seq(
as.Date("1/01/2014", "%d/%m/%Y"),
as.Date("31/12/2015", "%d/%m/%Y"),
"days"
),
ValueCol = runif(730)
)
dtData[, ValueCol := ValueCol + (strftime(DateCol,"%u") %in% c(6,7) * runif(1) *
0.75), .I]
dtData[, ValueCol := ValueCol + (abs(as.numeric(strftime(DateCol,"%m")) - 6.5)) *
runif(1) * 0.75, .I]
# base plot
p1 = ggplot_calendar_heatmap(
dtData,
'DateCol',
'ValueCol'
)
# adding some formatting
p1 +
xlab(NULL) +
ylab(NULL) +
scale_fill_continuous(low = 'green', high = 'red') +](https://image.slidesharecdn.com/ggtimeseries-160919203032/85/ggtimeseries-ggplot2-extensions-1-320.jpg)
![facet_wrap(~Year, ncol = 1)
# creating some categorical data
dtData[, CategCol := letters[1 + round(ValueCol * 7)]]
# base plot
p2 = ggplot_calendar_heatmap(
dtData,
'DateCol',
'CategCol'
)
# adding some formatting
p2 +
xlab(NULL) +
ylab(NULL) +
facet_wrap(~Year, ncol = 1)](https://image.slidesharecdn.com/ggtimeseries-160919203032/85/ggtimeseries-ggplot2-extensions-2-320.jpg)
![# creating some data
set.seed(1)
dfData = data.frame(x = 1:1000, y = cumsum(rnorm(1000)))
# base plot
p1 = ggplot_horizon(dfData, 'x', 'y')
print("If you're seeing any vertical white stripes, it's a display thing.")
## [1] "If you're seeing any vertical white stripes, it's a display thing."
# adding some formatting
p1 +
xlab(NULL) +
ylab(NULL) +
scale_fill_continuous(low = 'green', high = 'red') +
coord_fixed( 0.5 * diff(range(dfData$x)) / diff(range(dfData$y)))](https://image.slidesharecdn.com/ggtimeseries-160919203032/85/ggtimeseries-ggplot2-extensions-3-320.jpg)

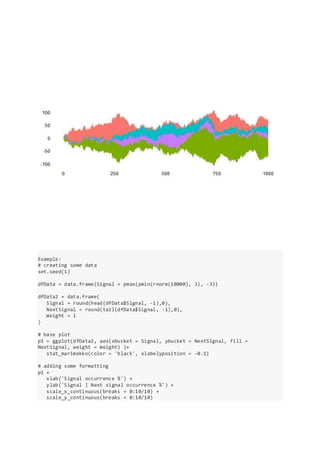
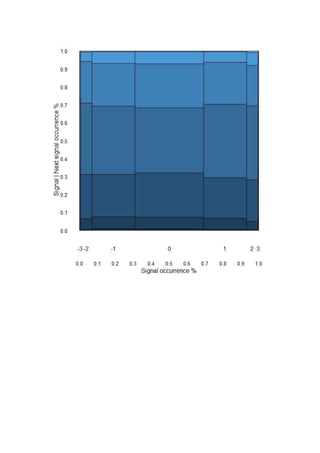

This document describes ggTimeSeries, an R package that provides extensions to ggplot2 for creating time series plots. It includes examples of using functions from ggTimeSeries to create calendar heatmaps, horizon graphs, steam graphs, and marimekko plots from time series data. The examples demonstrate how to generate sample time series data, create basic plots, and add formatting customizations.


![Some R Examples[R table and Graphics] -Advanced Data Visualization in R (Some...](https://cdn.slidesharecdn.com/ss_thumbnails/exampless-160922204223-thumbnail.jpg?width=640&height=640&fit=bounds)


![Some Examples in R- [Data Visualization--R graphics]](https://cdn.slidesharecdn.com/ss_thumbnails/rchart-160729210112-thumbnail.jpg?width=640&height=640&fit=bounds)


![[DSC Europe 25] Josip Saban - Career building for data professionals.pptx](https://cdn.slidesharecdn.com/ss_thumbnails/zroflcttkm1vmli0txea-josip-saban-career-building-for-data-professionals-260123083019-587cdb8c-thumbnail.jpg?width=640&height=640&fit=bounds)


![[DSC Europe 25] Ekaterina Bubenko - Behind the Curtain: How Data Roles Collab...](https://cdn.slidesharecdn.com/ss_thumbnails/anmv6x8dstqbbzchoklr-ekaterina-bubenko-behind-the-curtain-how-data-roles-collaborate-in-the-ai-era-a-260123083019-4b252ec7-thumbnail.jpg?width=640&height=640&fit=bounds)


![[DSC Europe 25] Milos Belcevic - Product Professional's Journey to Full-Stack...](https://cdn.slidesharecdn.com/ss_thumbnails/1zovd6fgsycdg4wvgvls-milos-belcevic-product-professionals-journey-to-full-stack-product-developer-260123083019-d993120d-thumbnail.jpg?width=640&height=640&fit=bounds)


