Download to read offline
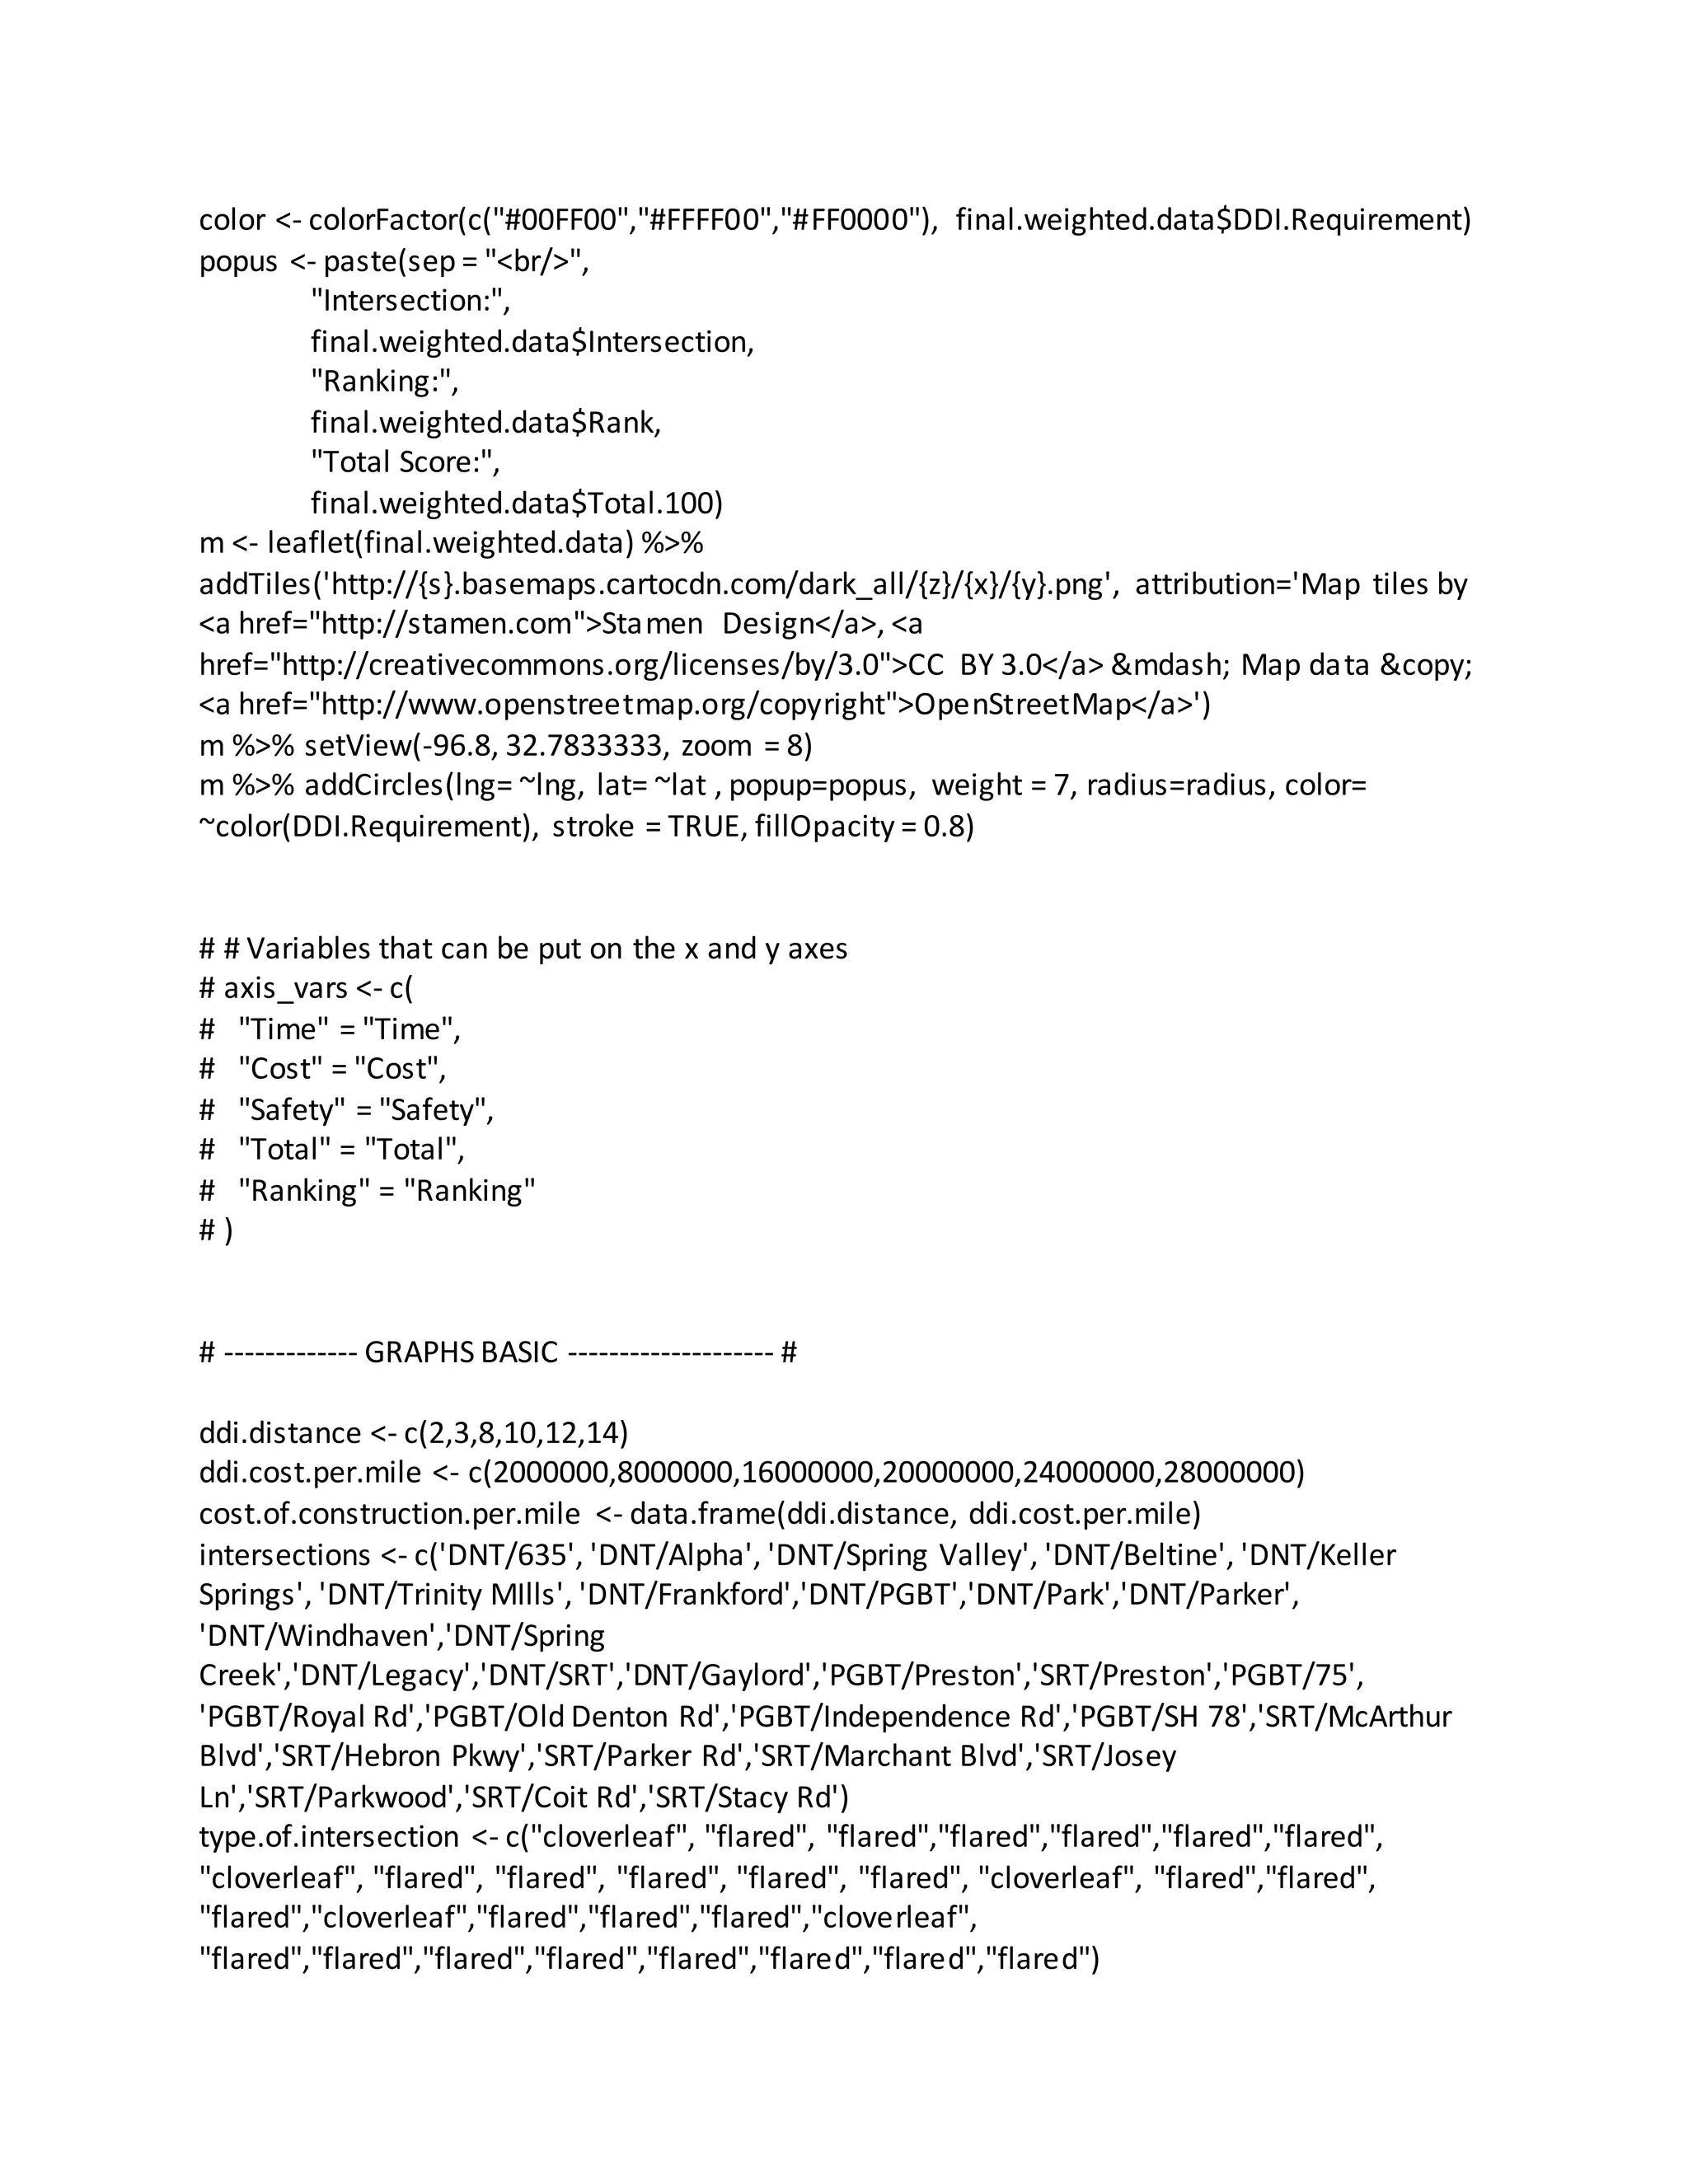
![library(shiny)
library(shinythemes)
library(dplyr)
library(ggplot2)
library(radiant.data)
library(radiant.model)
library(ggvis)
library(ggplot2)
library(ggmap)
library(gridExtra)
library(googleVis)
library(plotly)
library(DT)
library(leaflet)
# library(radiant.design)
# library(radiant.basics)
# library(radiant.multivariate)
# library(mvtnorm)
# library(radiant)
# Reading in the required datafiles from the source
time.parameter <- read.csv("timeparameter.csv")
safety.parameter <- read.csv("safetyparameter.csv")
cost.parameter <- read.csv("costparameter.csv")
cost.parameter.dropped <- cost.parameter[,c(-6,-7,-8)]
final.results <- read.csv("Finalresults.csv")
final.safety.results <- read.csv("Finalsafetyresults.csv")
final.cost.results <- read.csv("Finalcostresults.csv")
final.time.results <- read.csv("Finaltimeresults.csv")
final.weighted.data <- read.csv("Finalweighteddata1.csv")
all.location <- read.csv("Location.csv")
locations <- all.location[1:30,]
locations$Location <- gsub(",",":",locations$Location)
placeNames <- as.character(locations$Intersection)
plotData <- data.frame(name = placeNames, latLong = unlist(locations$Location))
volume.by.year <- read.csv("~/Desktop/firstpanel/volumeByYear.csv")
volume.by.year.1 <- volume.by.year[,1:10]
volumeByYear <- read.csv("~/Desktop/firstpanel/volumeByYear.csv")
volumeByYear2013 <- volumeByYear[1:30,]
social.good.2016 <- read.csv("~/Desktop/firstpanel/socialgood.csv")
final.weighted.data <- read.csv("Finalweighteddata1.csv")
final.weighted.data.table <-
final.weighted.data[,c("Intersection","Time.100","Cost.100","Safety.100","Total.100", "Rank")]
radius <- final.weighted.data$size*8](https://image.slidesharecdn.com/e18105f7-c813-40fd-aadc-9d89d9ce1bb6-170209045912/75/R-Shiny-Package-Server-Side-Code-for-Decision-Support-System-1-2048.jpg)
![intersection.type <- data.frame(intersections, type.of.intersection)
intersection.type$points <- ifelse(intersection.type$type.of.intersection=="cloverleaf", 74.5,
77.8)
# Calculating the increase in points if a DDI (83.6) is built based on the type of intersection
intersection.type$ddi <- ifelse(intersection.type$type.of.intersection=="cloverleaf", 9.1, 5.8)
# Conditional statement to see which intersections can be converted to a DDI
intersection.type$ddi.possibility <- ifelse(intersection.type$type.of.intersection=="cloverleaf",
"NO","YES")
intersection.type.modified <- subset(intersection.type, ddi.possibility == "YES")
# ------------- GRAPHS BASIC -------------------- #
# ------------------------- Creating Outputs required for PANEL 1 ---------------- #
# Creating an output in the data tab
shinyServer(function(input, output) {
output$time.data <- renderTable({
colm <- as.numeric(input$time.parameters)
time.parameter[colm]
})
output$safety.data <- renderTable({
colm <- as.numeric(input$safety.parameters)
safety.parameter[colm]
})
output$cost.data <- renderTable({
colm <- as.numeric(input$cost.parameters)
cost.parameter[colm]
})
# ------------------------- END OF TABLE RENDERING ---------------- #
# ------------------------- Creating Outputs required for PANEL 2 ---------------- #
# Filter data based on selections
output$table <- DT::renderDataTable(DT::datatable({
data <- time.parameter
if (input$intersections != "All") {
data <- data[data$Intersections == input$intersections,]
}
if (input$exist.lane.length != "All") {
data <- data[data$Existing.Lane.Length == input$exist.lane.length,]
}
if (input$left.turns != "All") {](https://image.slidesharecdn.com/e18105f7-c813-40fd-aadc-9d89d9ce1bb6-170209045912/75/R-Shiny-Package-Server-Side-Code-for-Decision-Support-System-3-2048.jpg)
![data <- data[data$Lefts == input$left.turns,]
}
data
}))
# ------------------------- END OF TABLE RENDERING for PANEL 2 ---------------- #
# ------------------------- BEGIN PANEL 3 --------------------------- #
result <- explore(dataset = "time.parameter", vars = c("X..of.left.turns",
"Hours.wasted.in.traffic", "Annual.hours.wasted.in.traffic", "Average.Daily.Total.Traffic",
"Speed.Limit", "Existing.Lane.Length"), fun = c("length", "mean_rm", "sd_rm", "min_rm",
"max_rm"), nr = 8)
time.table <- result$tab
output$time.table <- renderTable({
colm <- as.numeric(unlist(input$time.summary))
time.table[colm]
}
)
result <- explore(dataset = "cost.parameter.dropped", vars = c("Hours.wasted.in.Traffic",
"Existing.Lane.Length", "Shoulder.Width"), fun = c("length", "mean_rm", "sd_rm", "min_rm",
"max_rm"), nr = 8)
cost.table <- result$tab
output$cost.table <- renderTable({
colm <- as.numeric(unlist(input$cost.summary))
cost.table[colm]
}
)
result <- explore(dataset = "safety.parameter", vars = c("Number.of.right.lanes",
"Number.of.left.lanes", "Percentage.of.left.turns", "Average.daily.total.traffic", "Movements",
"Shoulder.width", "Percentage.of.trucks", "Clearance", "Speed.Limit"), fun = c("length",
"mean_rm", "sd_rm", "min_rm", "max_rm"), nr = 8)
safety.table <- result$tab
output$safety.table <- renderTable({
colm <- as.numeric(unlist(input$safety.summary))
safety.table[colm]
}](https://image.slidesharecdn.com/e18105f7-c813-40fd-aadc-9d89d9ce1bb6-170209045912/75/R-Shiny-Package-Server-Side-Code-for-Decision-Support-System-4-2048.jpg)
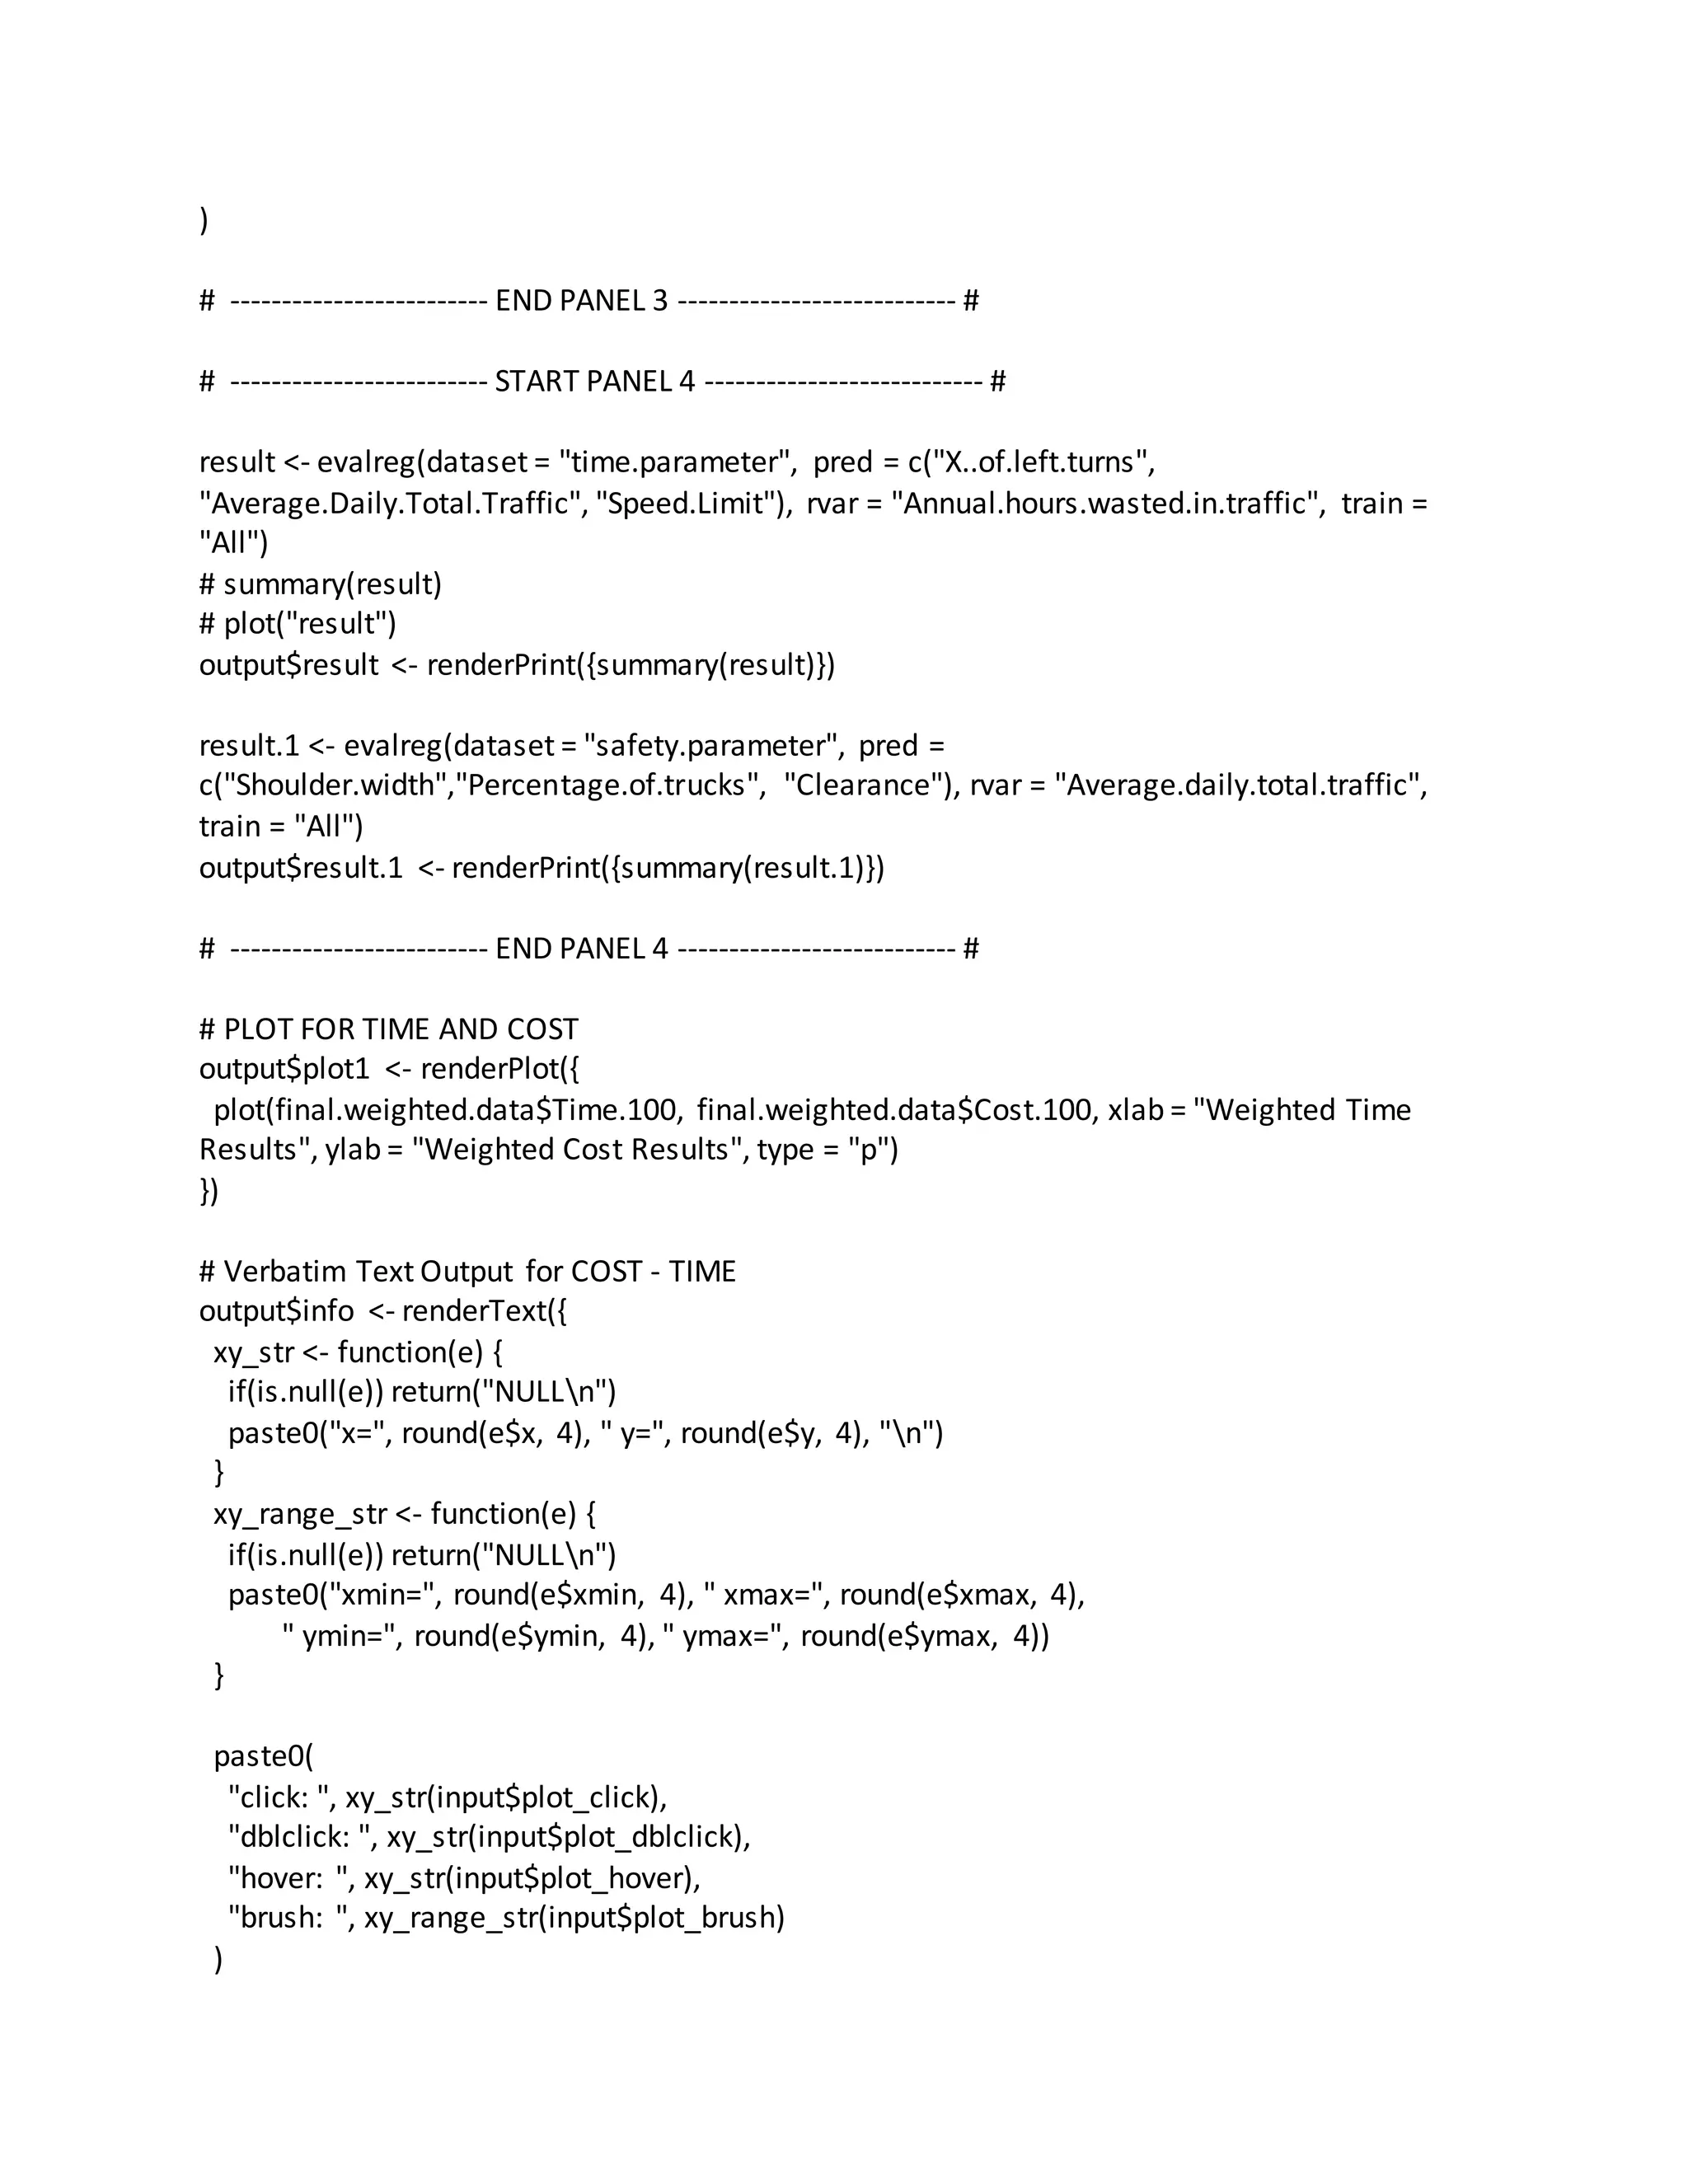
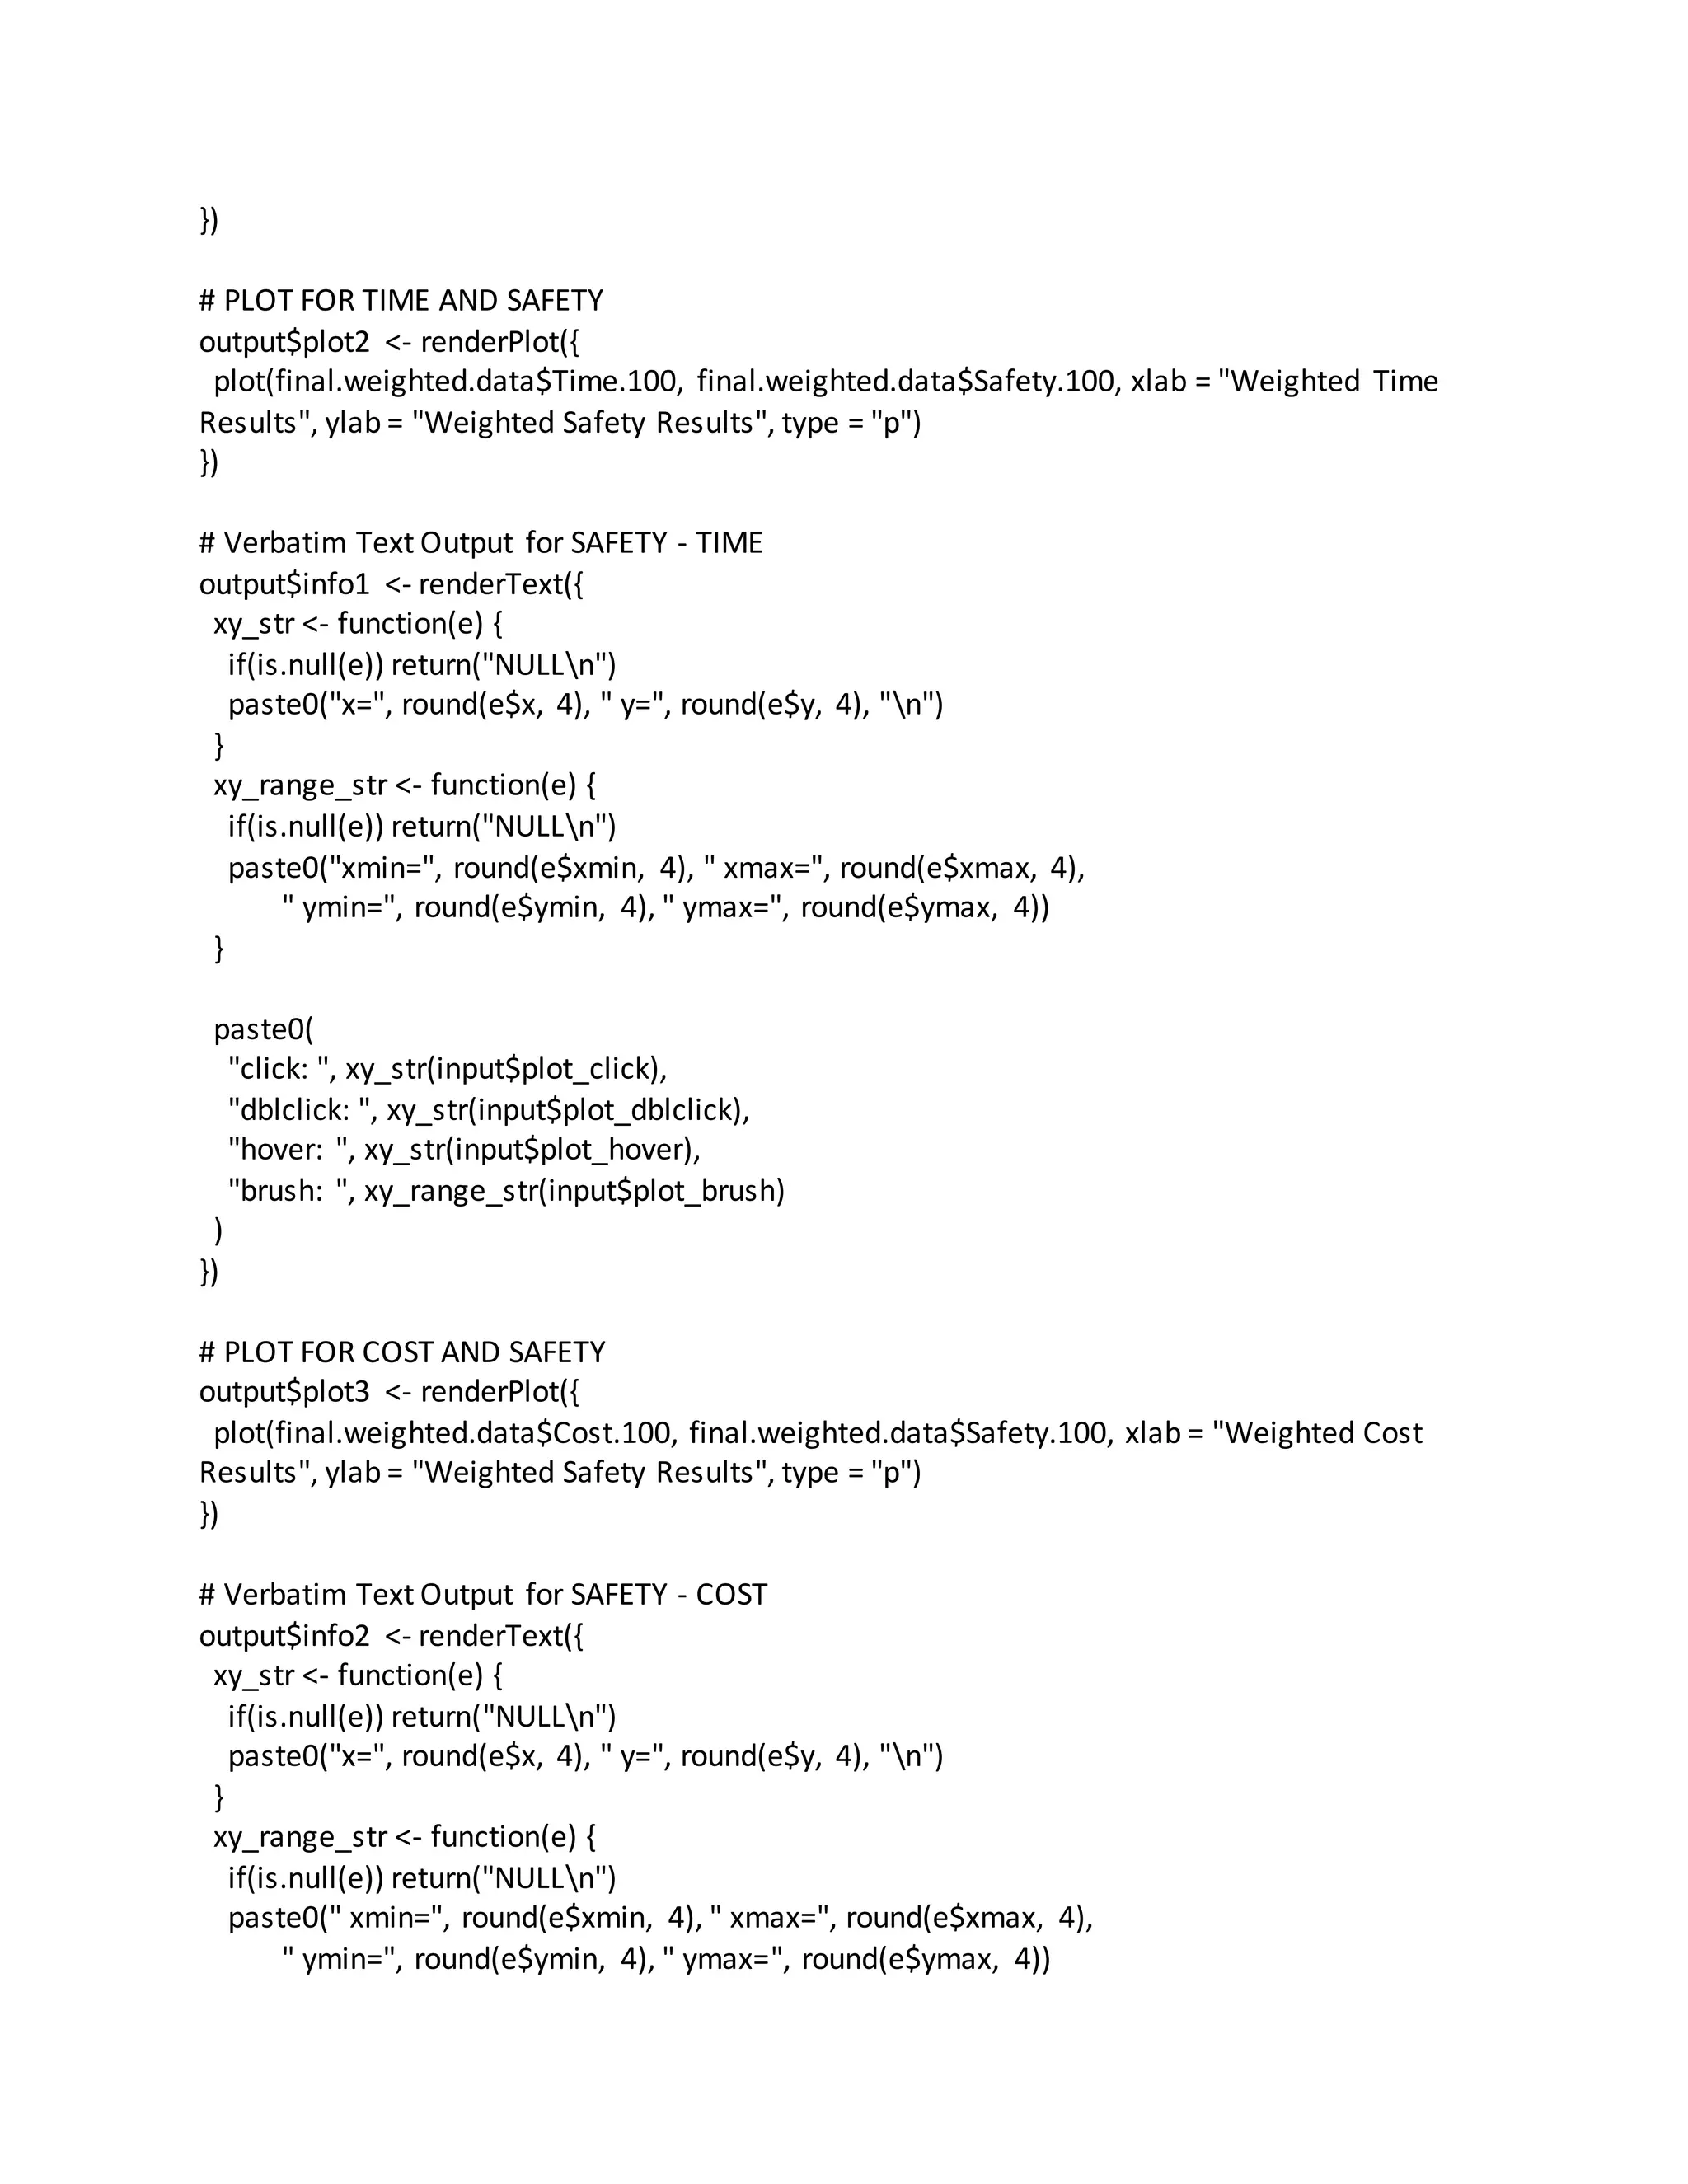
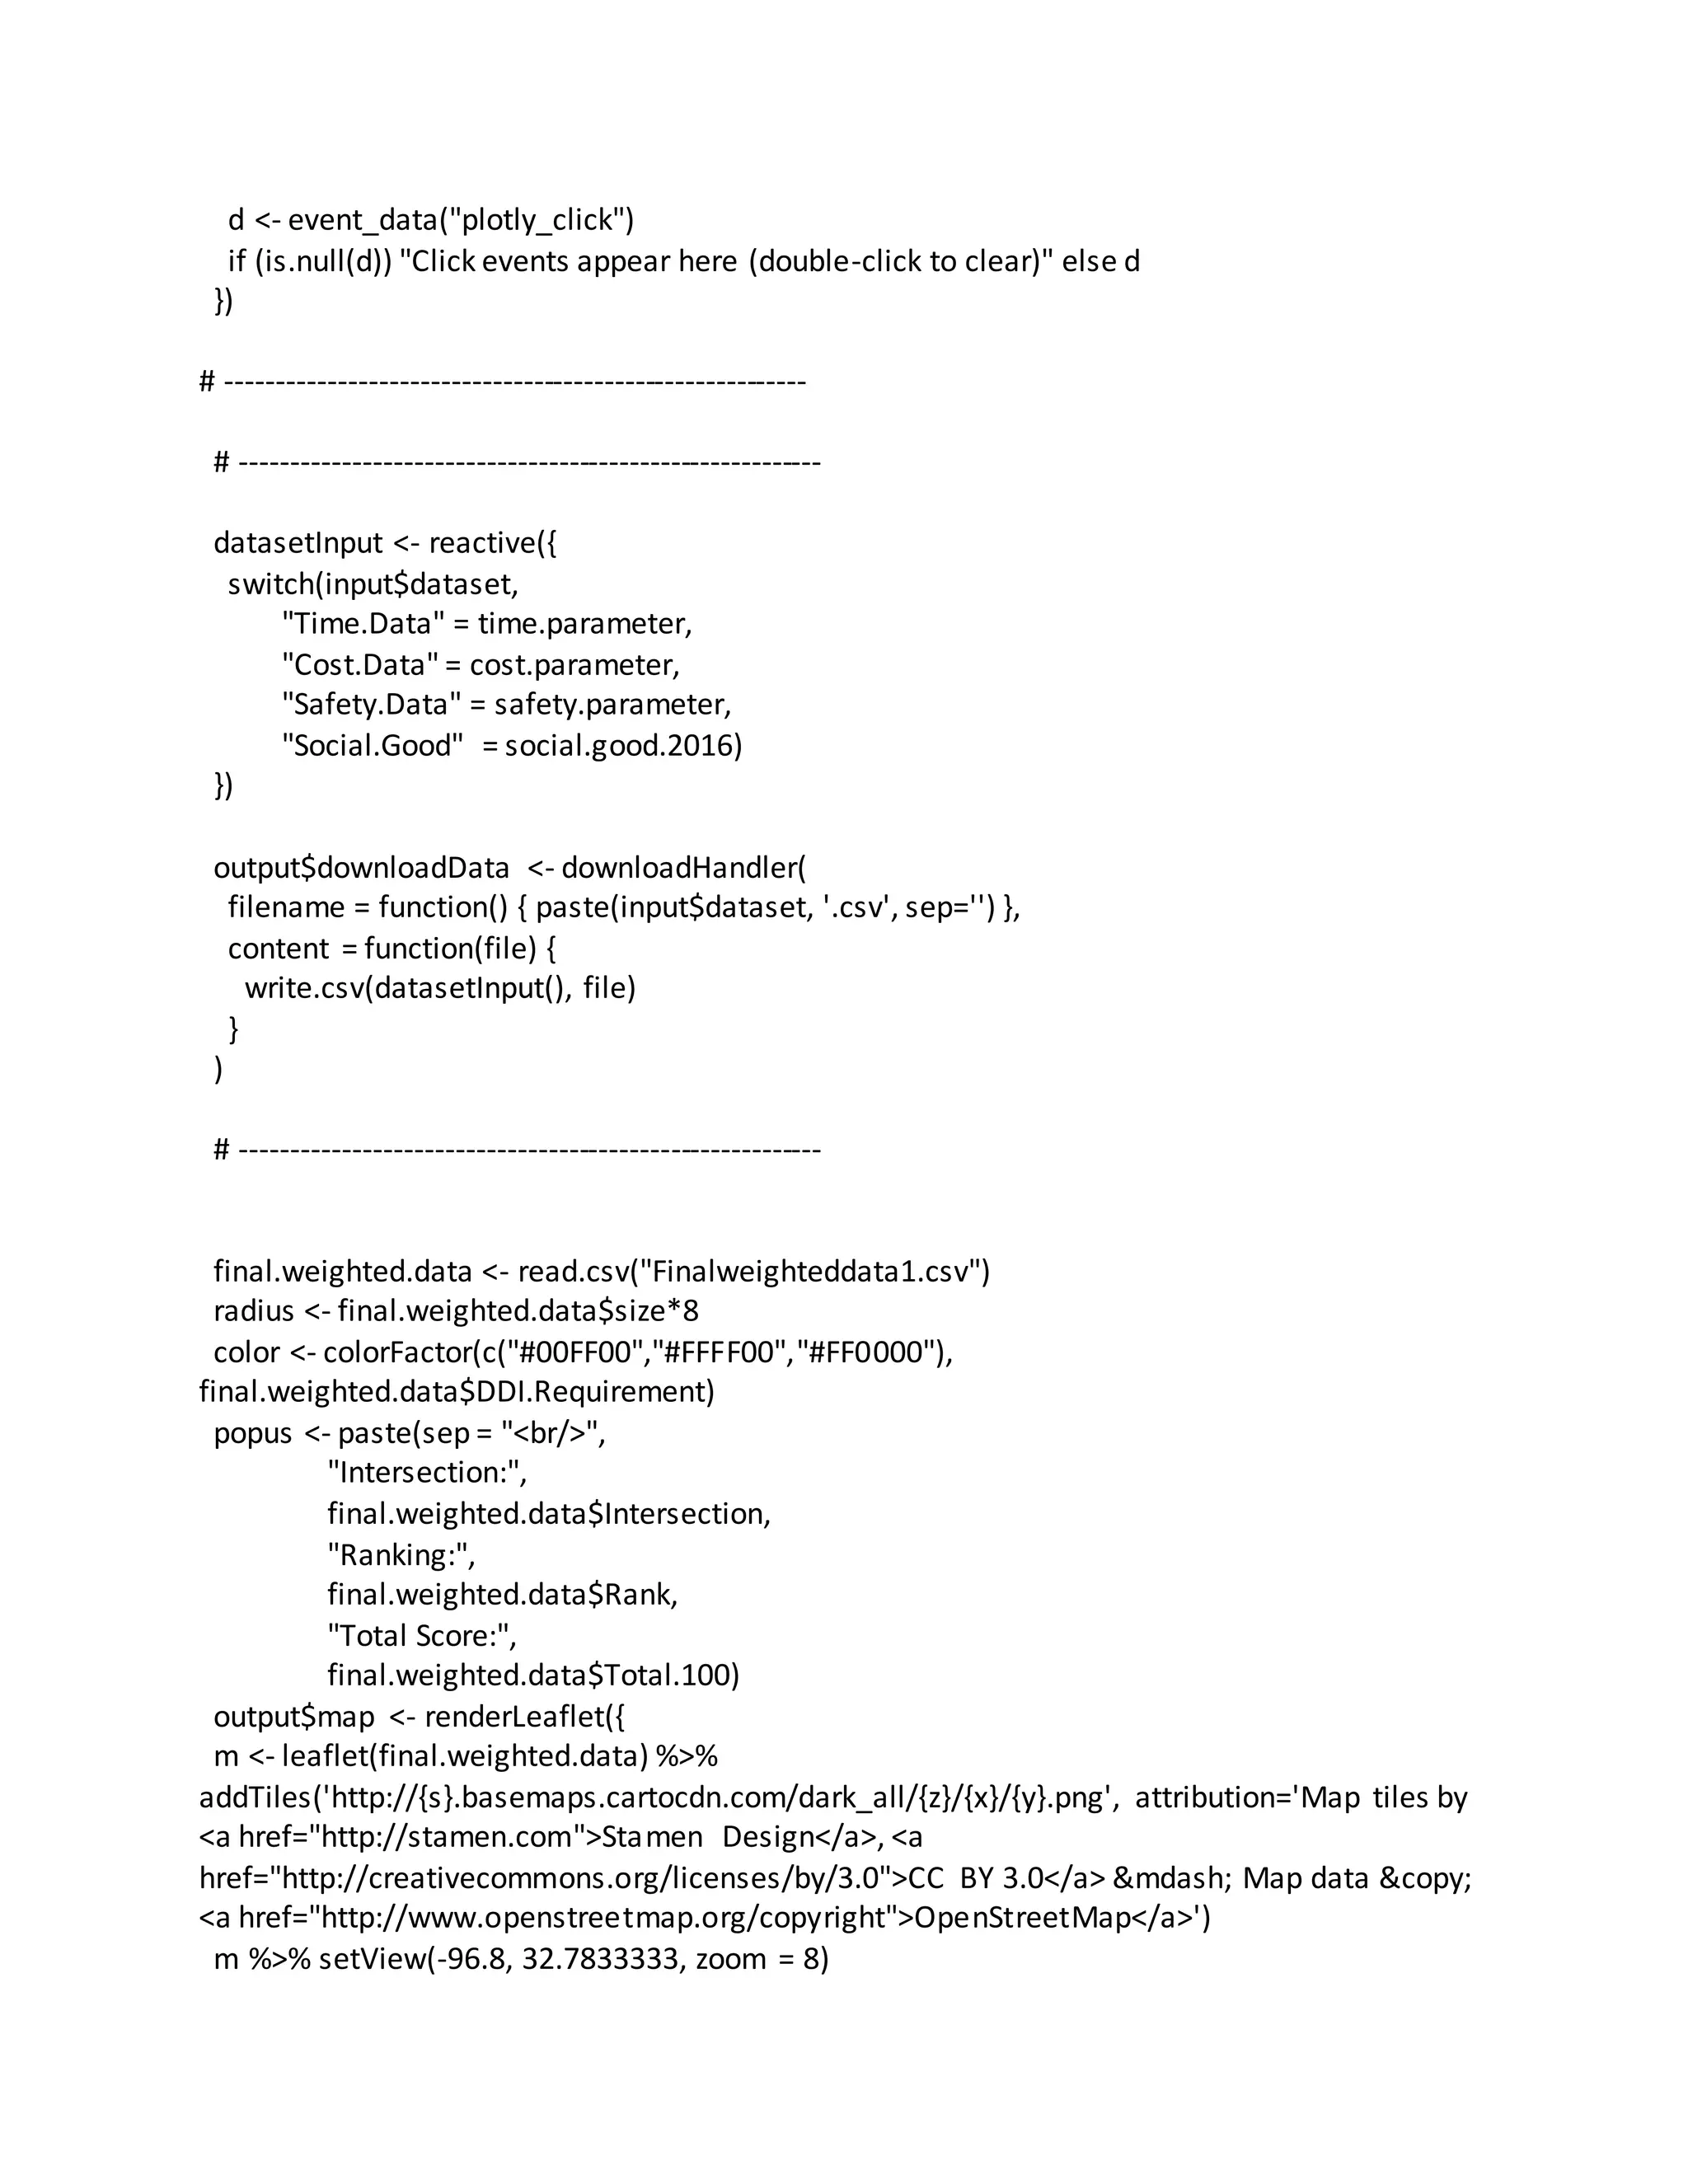
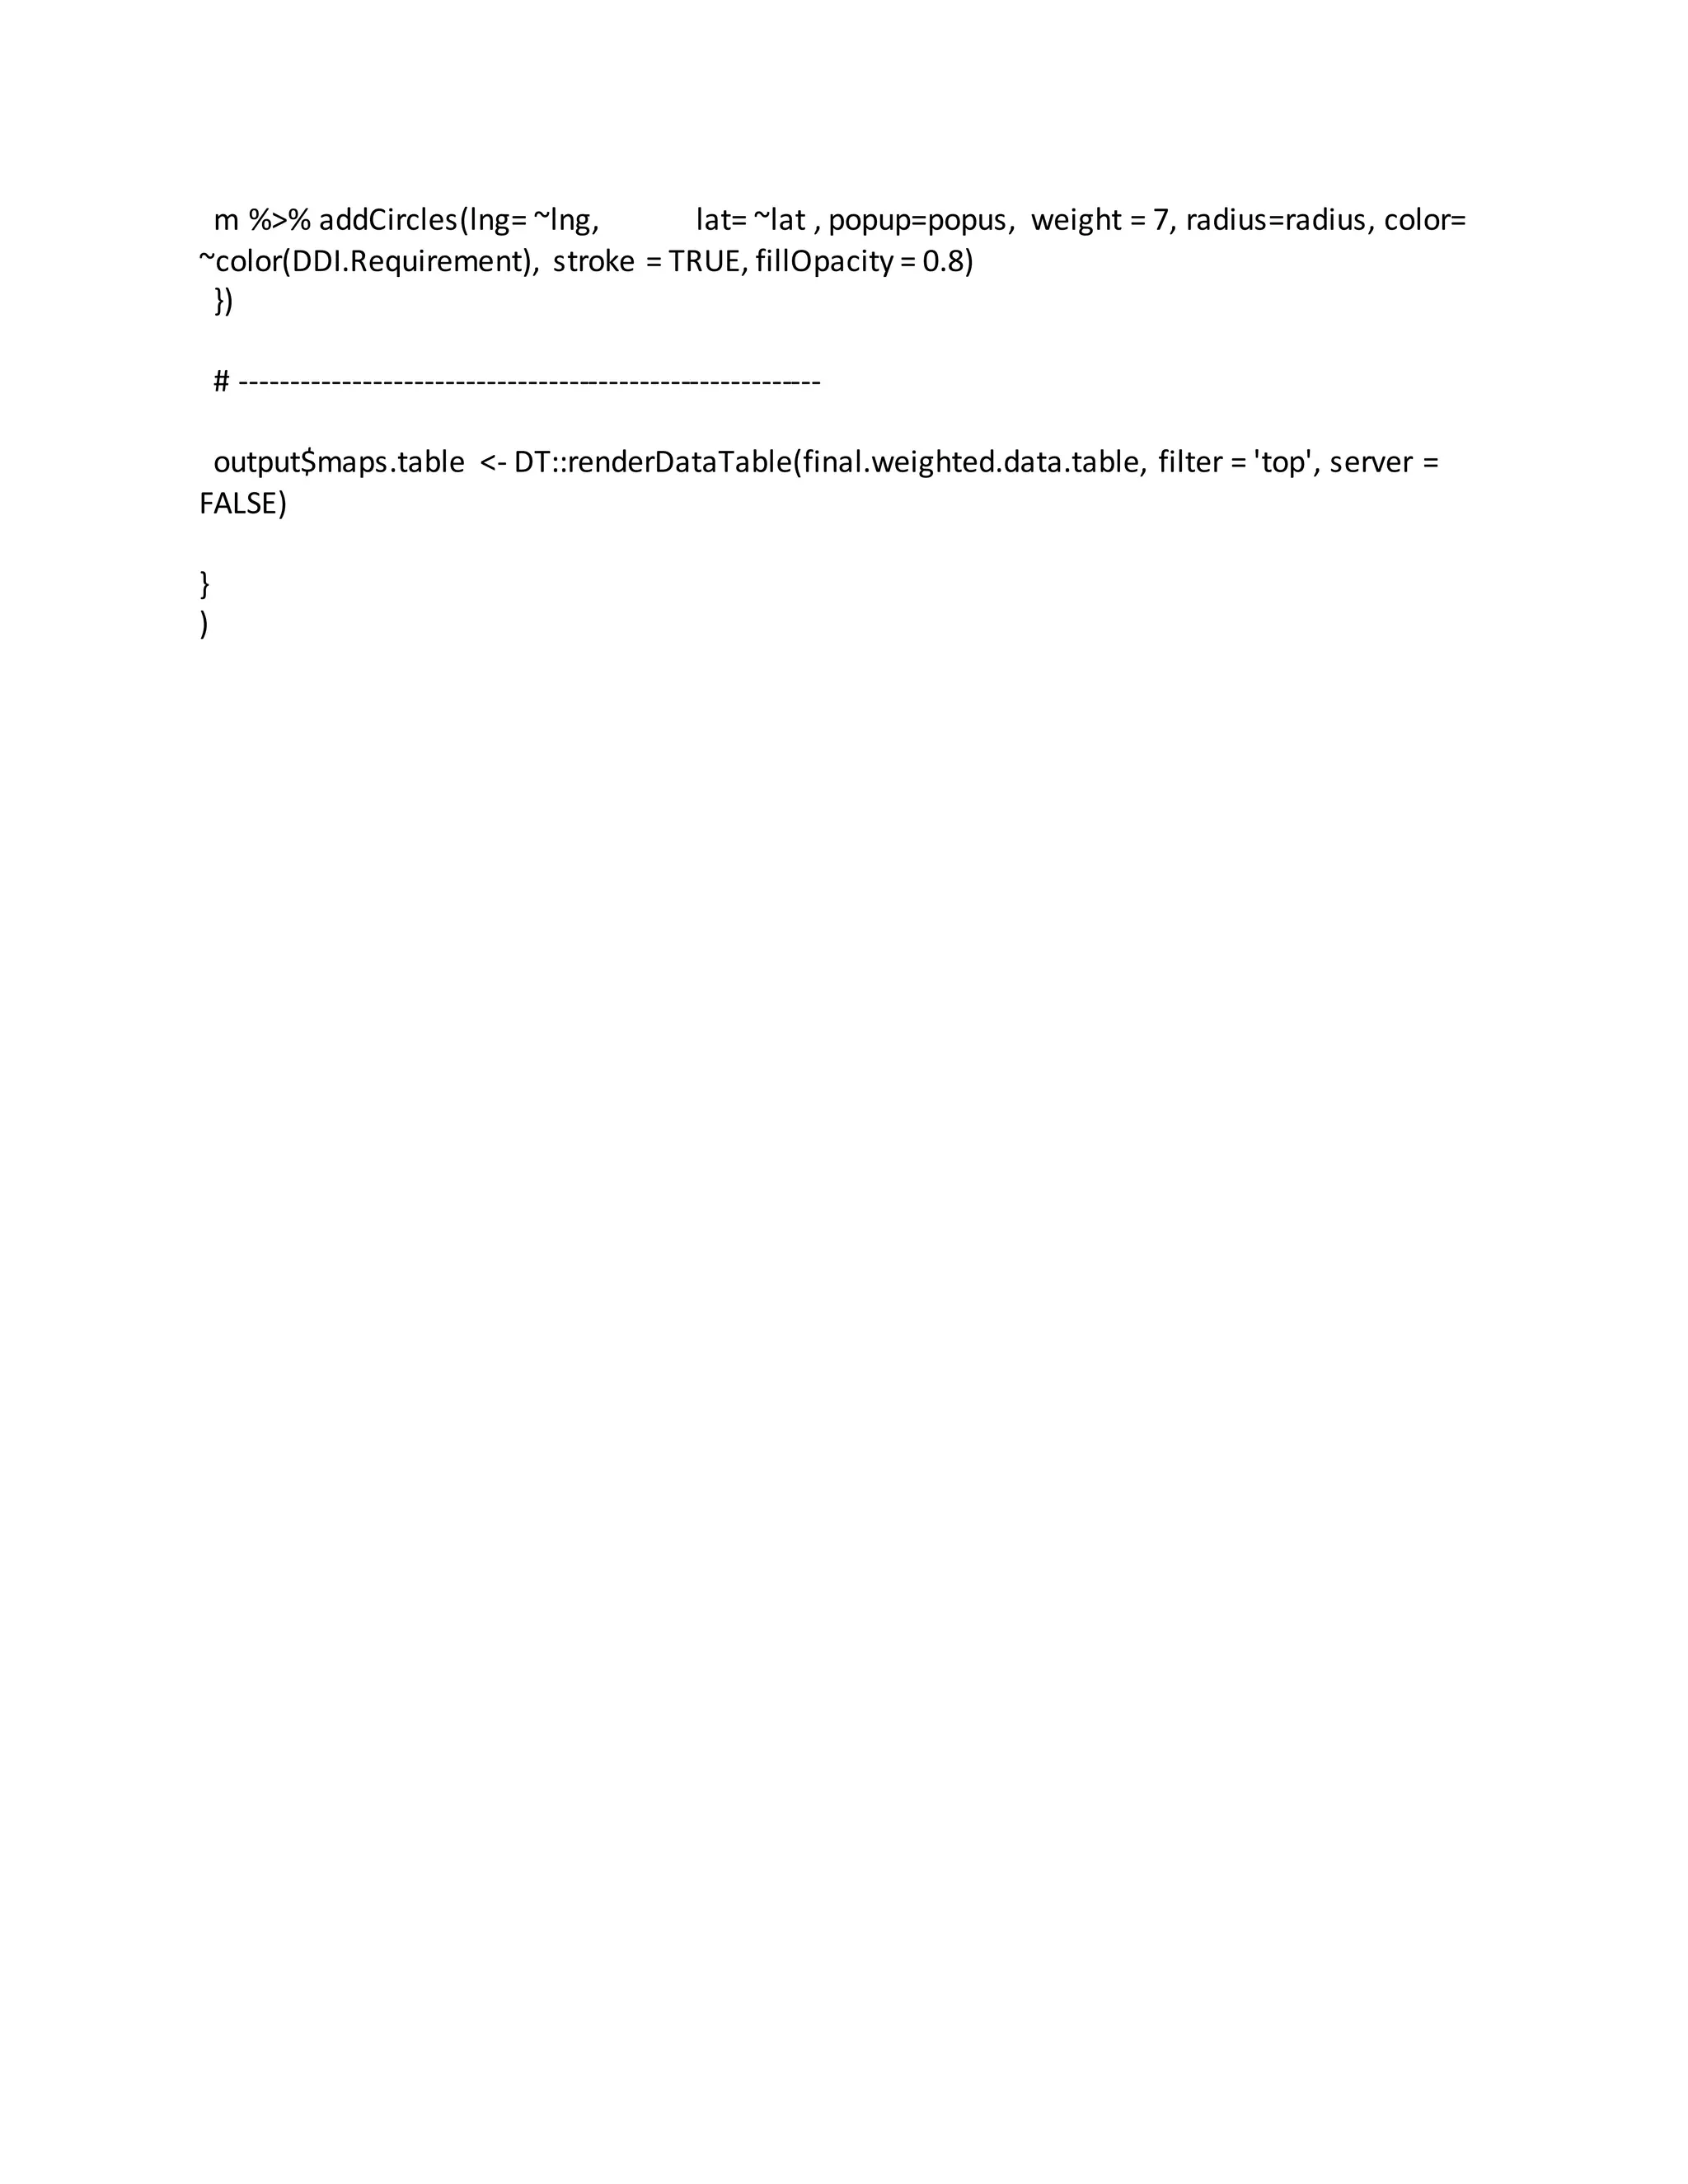

This document loads various libraries and reads in multiple csv files containing transportation data. It then performs some data cleaning and preprocessing steps. Various outputs are defined to render tables and plots of subsets of the data. Plots are created to visualize relationships between weighted time, cost, and safety metrics. Interactive elements are added to output text describing user input from the plots. Maps and motion charts are also defined as outputs to visualize additional data aspects.


![Think Spatial: Don't Ignore Location in your Models! [CARTOframes]](https://cdn.slidesharecdn.com/ss_thumbnails/cartorecordedwebinar-thinkspatial-deck-190522084544-thumbnail.jpg?width=640&height=640&fit=bounds)


