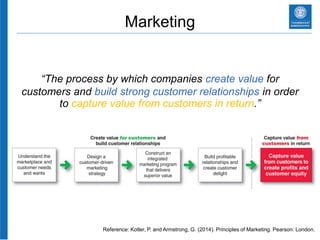
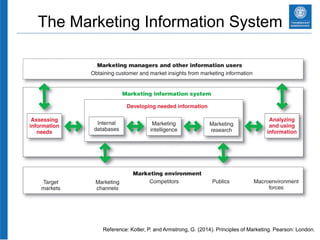
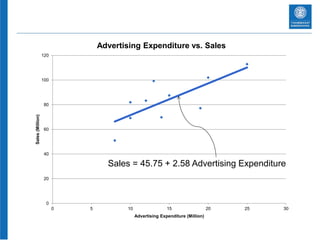
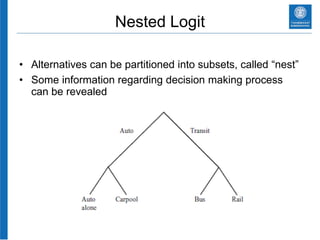
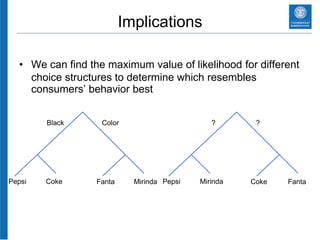
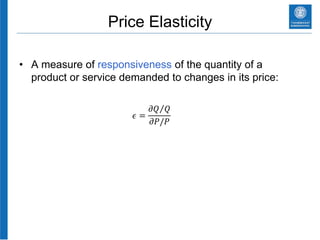
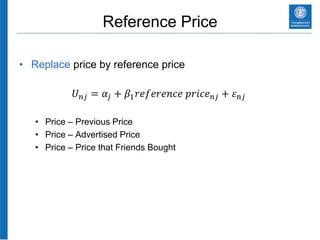
Marketing Analytics
Surat Teerakapibal, Ph.D.
Lecturer, Department of Marketing
Program Director, Doctor of Philosophy Program in Business Administration
What is Marketing?
Anti-Marketing
Marketing
“The process by which companies create value for
customers and build strong customer relationships in order
to capture value from customers in return.”
Reference: Kotler, P. and Armstrong, G. (2014). Principles of Marketing. Pearson: London.
The Big Challenge…
The Marketing Information System
Reference: Kotler, P. and Armstrong, G. (2014). Principles of Marketing. Pearson: London.
Internal Databases
• Marketing department
• Customer characteristics
• Sales transactions
• Website visits
• Customer service department
• Customer satisfaction
• Service problems
• Accounting department
• Sales
• Costs
• Cash flows
Internal Databases (cont.)
• Operations department
• Production
• Shipments
• Inventories
• Salesforce reports
• Competitor activities
• Reseller reactions
• Marketing channel partners
• Point-of-sale transaction
Marketing Intelligence
• Observe consumers
• Quizzing company’s own employees
• Benchmarking competitors’ productions
• Researching the Internet
• Monitoring the Internet buzz
Marketing Intelligence Service Sample
Marketing Research
• Exploratory research – preliminary information to help
define problems
• Observational research
• Ethnographic research
• Depth interview
• Focus groups
• Causal research – test hypotheses about cause-and-
effect relationships
• Experimental research
Marketing Research (cont.)
• Descriptive research – describe marketing problems,
situations, or markets, such as the market potential for a
product or the demographics and attitudes of consumers
• Survey research
• Secondary data
• Consumer panel data
Purchase
data
Customer ID
Brand
bought
Quantity
bought
Place of
purchase
(Store ID)
Store data
Store ID
Products
available
Price
Feature
Customer
data
Customer ID
Income
Household
size
Marketing Data Scientists
= MARKETING
The Shopper
“The Consumer Black Box”
Product
Price
Place
Promotion
.
.
.
CRM
Situation
Influencers
Choice
Tree of Marketing
Reference: Department of Marketing, Thammasat Business School
Econometrics. What is it?
• Econometrics is “the branch of economics that aims to
give empirical content to economic relations.”
• The most basic tool for econometrics is the linear
regression model
𝑦𝑖 = 𝛽0 + 𝛽1 𝑋𝑖 + 𝜀𝑖
0
20
40
60
80
100
120
0 5 10 15 20 25 30
Sales(Million)
Advertising Expenditure (Million)
Advertising Expenditure vs. Sales
Sales = 45.75 + 2.58 Advertising Expenditure
0
20
40
60
80
100
120
0 5 10 15 20 25 30
Sales(Million)
Advertising Expenditure (Million)
Advertising Expenditure vs. Sales
Implications
• Capability to determine existence of relationship
On average, increasing the advertising expenditure by 1 baht will
result in 2.58 baht increase in sales.
(More careful statistical analysis could be conducted to test for
statistical significance.)
𝑆𝑎𝑙𝑒𝑠𝑖 = 45.75 + 2.58𝐴𝑑𝑣𝑒𝑟𝑡𝑖𝑠𝑖𝑛𝑔 𝐸𝑥𝑝𝑒𝑛𝑑𝑖𝑡𝑢𝑟𝑒𝑖
Implications (cont.)
• Future sales can be forecasted based on knowledge
about advertisement expenditure
For instance, if the firm spends 10million baht on advertising next
month, what would be the expected sales?
𝑆𝑎𝑙𝑒𝑠𝑖 = 45.75 + 2.58𝐴𝑑𝑣𝑒𝑟𝑡𝑖𝑠𝑖𝑛𝑔 𝐸𝑥𝑝𝑒𝑛𝑑𝑖𝑡𝑢𝑟𝑒𝑖
𝑆𝑎𝑙𝑒𝑠 = 45.75 + 2.58 ∗ 10
𝑆𝑎𝑙𝑒𝑠 = 45.75 + 25.8
𝑆𝑎𝑙𝑒𝑠 = 71.55 𝑚𝑖𝑙𝑙𝑖𝑜𝑛 𝑏𝑎ℎ𝑡
Software Packages
An Example: Car or Bus?
Random Utility Models (RUMs)
• A decision maker, n, faces a choice among J
alternatives. The utility that decision maker n obtains
from alternative j is:
𝑈 𝑛𝑗 = 𝑉𝑛𝑗 + 𝜀 𝑛𝑗
known to the researcher
unknown to the researcher
Implications
• We need 2 equations for our case: 1 for car and 1 for
bus.
• We need to know marketing theories in order to identify
variables to be included in the model.
• We need to find the data for each of the variables for
both car and bus
• We need “large” amount of data for accuracy
• Existence of relationship
• Predication
Based on Traditional Logit Framework
• For car:
• For bus:
𝑈 𝑛,𝑐𝑎𝑟 = 𝛼 𝑐𝑎𝑟 + 𝛽1 𝑝𝑟𝑖𝑐𝑒 𝑛,𝑐𝑎𝑟 + 𝛽2 𝑐𝑜𝑛𝑣𝑒𝑛𝑖𝑒𝑛𝑐𝑒 𝑛,𝑐𝑎𝑟 + 𝜀 𝑛,𝑐𝑎𝑟
𝑈 𝑛,𝑏𝑢𝑠 = 𝛼 𝑏𝑢𝑠 + 𝛽1 𝑝𝑟𝑖𝑐𝑒 𝑛,𝑏𝑢𝑠 + 𝛽2 𝑐𝑜𝑛𝑣𝑒𝑛𝑖𝑒𝑛𝑐𝑒 𝑛,𝑏𝑢𝑠 + 𝜀 𝑛,𝑏𝑢𝑠
Based on Traditional Logit Framework (cont.)
• For car:
• For bus:
𝑈 𝑛,𝑐𝑎𝑟 = 𝛼 𝑐𝑎𝑟>𝑏𝑢𝑠 + 𝛽1 𝑝𝑟𝑖𝑐𝑒 𝑛,𝑐𝑎𝑟 + 𝛽2 𝑐𝑜𝑛𝑣𝑒𝑛𝑖𝑒𝑛𝑐𝑒 𝑛,𝑐𝑎𝑟 + 𝜀 𝑛,𝑐𝑎𝑟
𝑈 𝑛,𝑏𝑢𝑠 = 𝛼 𝑏𝑢𝑠 + 𝛽1 𝑝𝑟𝑖𝑐𝑒 𝑛,𝑏𝑢𝑠 + 𝛽2 𝑐𝑜𝑛𝑣𝑒𝑛𝑖𝑒𝑛𝑐𝑒 𝑛,𝑏𝑢𝑠 + 𝜀 𝑛,𝑏𝑢𝑠
known to the researcher
How Consumers Choose?
• Each consumer will choose the option with highest utility.
• But, we have an unknown part
• So,
• But, this probability depends on 𝛼 and 𝛽’s.
𝑃𝑛,𝑐𝑎𝑟 = 𝑃𝑟𝑜𝑏 𝑈 𝑛,𝑐𝑎𝑟 > 𝑈 𝑛,𝑏𝑢𝑠
𝑃𝑛,𝑏𝑢𝑠 = 𝑃𝑟𝑜𝑏 𝑈 𝑛,𝑏𝑢𝑠 > 𝑈 𝑛,𝑐𝑎𝑟
What Do We Have to Do?
• If consumer n chooses bus, we want:
• If consumer n chooses car, we want:
• Ultimately, we have to choose 𝛼 and 𝛽’s such that this
happens (or close to happen)
𝑃𝑛,𝑐𝑎𝑟 = 𝑃𝑟𝑜𝑏 𝑈 𝑛,𝑐𝑎𝑟 > 𝑈 𝑛,𝑏𝑢𝑠 = 0
𝑃𝑛,𝑏𝑢𝑠 = 𝑃𝑟𝑜𝑏 𝑈 𝑛,𝑏𝑢𝑠 > 𝑈 𝑛,𝑐𝑎𝑟 = 1
𝑃𝑛,𝑐𝑎𝑟 = 𝑃𝑟𝑜𝑏 𝑈 𝑛,𝑐𝑎𝑟 > 𝑈 𝑛,𝑏𝑢𝑠 = 1
𝑃𝑛,𝑏𝑢𝑠 = 𝑃𝑟𝑜𝑏 𝑈 𝑛,𝑏𝑢𝑠 > 𝑈 𝑛,𝑐𝑎𝑟 = 0
Likelihood Function
• But we have N consumers, so we need joint probability.
• For instance, if we have 5 consumers:
𝐿 = 𝑃1 ∗ 𝑃2∗ 𝑃3∗ 𝑃4∗ 𝑃5
• We want to find 𝛼 and 𝛽’s that give us the highest
likelihood
• We must mathematically derive this formula
• We must code optimization algorithm
Software Packages
Nested Logit
• Alternatives can be partitioned into subsets, called “nest”
• Some information regarding decision making process
can be revealed
Implications
• We can find the maximum value of likelihood for different
choice structures to determine which resembles
consumers’ behavior best
Black Color
Pepsi Coke Fanta Mirinda
? ?
Pepsi Mirinda Coke Fanta
Price Elasticity
• A measure of responsiveness of the quantity of a
product or service demanded to changes in its price:
𝜖 =
𝜕𝑄 𝑄
𝜕𝑃/𝑃
Reference Price
• Replace price by reference price
• Price – Previous Price
• Price – Advertised Price
• Price – Price that Friends Bought
𝑈 𝑛𝑗 = 𝛼𝑗 + 𝛽1 𝑟𝑒𝑓𝑒𝑟𝑒𝑛𝑐𝑒 𝑝𝑟𝑖𝑐𝑒 𝑛𝑗 + 𝜀 𝑛𝑗
Contact
• Email: suratt7@tbs.tu.ac.th
• Facebook:
Art Surat Teerakapibal
• Line:
artsurat

Marketing analytics

  • 1.
    Marketing Analytics Surat Teerakapibal,Ph.D. Lecturer, Department of Marketing Program Director, Doctor of Philosophy Program in Business Administration
  • 2.
  • 3.
  • 4.
    Marketing “The process bywhich companies create value for customers and build strong customer relationships in order to capture value from customers in return.” Reference: Kotler, P. and Armstrong, G. (2014). Principles of Marketing. Pearson: London.
  • 6.
  • 7.
    The Marketing InformationSystem Reference: Kotler, P. and Armstrong, G. (2014). Principles of Marketing. Pearson: London.
  • 8.
    Internal Databases • Marketingdepartment • Customer characteristics • Sales transactions • Website visits • Customer service department • Customer satisfaction • Service problems • Accounting department • Sales • Costs • Cash flows
  • 9.
    Internal Databases (cont.) •Operations department • Production • Shipments • Inventories • Salesforce reports • Competitor activities • Reseller reactions • Marketing channel partners • Point-of-sale transaction
  • 10.
    Marketing Intelligence • Observeconsumers • Quizzing company’s own employees • Benchmarking competitors’ productions • Researching the Internet • Monitoring the Internet buzz
  • 11.
  • 12.
    Marketing Research • Exploratoryresearch – preliminary information to help define problems • Observational research • Ethnographic research • Depth interview • Focus groups • Causal research – test hypotheses about cause-and- effect relationships • Experimental research
  • 13.
    Marketing Research (cont.) •Descriptive research – describe marketing problems, situations, or markets, such as the market potential for a product or the demographics and attitudes of consumers • Survey research • Secondary data • Consumer panel data
  • 17.
    Purchase data Customer ID Brand bought Quantity bought Place of purchase (StoreID) Store data Store ID Products available Price Feature Customer data Customer ID Income Household size
  • 20.
  • 21.
  • 22.
    “The Consumer BlackBox” Product Price Place Promotion . . . CRM Situation Influencers Choice
  • 23.
    Tree of Marketing Reference:Department of Marketing, Thammasat Business School
  • 25.
    Econometrics. What isit? • Econometrics is “the branch of economics that aims to give empirical content to economic relations.” • The most basic tool for econometrics is the linear regression model 𝑦𝑖 = 𝛽0 + 𝛽1 𝑋𝑖 + 𝜀𝑖
  • 26.
    0 20 40 60 80 100 120 0 5 1015 20 25 30 Sales(Million) Advertising Expenditure (Million) Advertising Expenditure vs. Sales
  • 27.
    Sales = 45.75+ 2.58 Advertising Expenditure 0 20 40 60 80 100 120 0 5 10 15 20 25 30 Sales(Million) Advertising Expenditure (Million) Advertising Expenditure vs. Sales
  • 28.
    Implications • Capability todetermine existence of relationship On average, increasing the advertising expenditure by 1 baht will result in 2.58 baht increase in sales. (More careful statistical analysis could be conducted to test for statistical significance.) 𝑆𝑎𝑙𝑒𝑠𝑖 = 45.75 + 2.58𝐴𝑑𝑣𝑒𝑟𝑡𝑖𝑠𝑖𝑛𝑔 𝐸𝑥𝑝𝑒𝑛𝑑𝑖𝑡𝑢𝑟𝑒𝑖
  • 29.
    Implications (cont.) • Futuresales can be forecasted based on knowledge about advertisement expenditure For instance, if the firm spends 10million baht on advertising next month, what would be the expected sales? 𝑆𝑎𝑙𝑒𝑠𝑖 = 45.75 + 2.58𝐴𝑑𝑣𝑒𝑟𝑡𝑖𝑠𝑖𝑛𝑔 𝐸𝑥𝑝𝑒𝑛𝑑𝑖𝑡𝑢𝑟𝑒𝑖 𝑆𝑎𝑙𝑒𝑠 = 45.75 + 2.58 ∗ 10 𝑆𝑎𝑙𝑒𝑠 = 45.75 + 25.8 𝑆𝑎𝑙𝑒𝑠 = 71.55 𝑚𝑖𝑙𝑙𝑖𝑜𝑛 𝑏𝑎ℎ𝑡
  • 30.
  • 34.
  • 35.
    Random Utility Models(RUMs) • A decision maker, n, faces a choice among J alternatives. The utility that decision maker n obtains from alternative j is: 𝑈 𝑛𝑗 = 𝑉𝑛𝑗 + 𝜀 𝑛𝑗 known to the researcher unknown to the researcher
  • 36.
    Implications • We need2 equations for our case: 1 for car and 1 for bus. • We need to know marketing theories in order to identify variables to be included in the model. • We need to find the data for each of the variables for both car and bus • We need “large” amount of data for accuracy • Existence of relationship • Predication
  • 37.
    Based on TraditionalLogit Framework • For car: • For bus: 𝑈 𝑛,𝑐𝑎𝑟 = 𝛼 𝑐𝑎𝑟 + 𝛽1 𝑝𝑟𝑖𝑐𝑒 𝑛,𝑐𝑎𝑟 + 𝛽2 𝑐𝑜𝑛𝑣𝑒𝑛𝑖𝑒𝑛𝑐𝑒 𝑛,𝑐𝑎𝑟 + 𝜀 𝑛,𝑐𝑎𝑟 𝑈 𝑛,𝑏𝑢𝑠 = 𝛼 𝑏𝑢𝑠 + 𝛽1 𝑝𝑟𝑖𝑐𝑒 𝑛,𝑏𝑢𝑠 + 𝛽2 𝑐𝑜𝑛𝑣𝑒𝑛𝑖𝑒𝑛𝑐𝑒 𝑛,𝑏𝑢𝑠 + 𝜀 𝑛,𝑏𝑢𝑠
  • 38.
    Based on TraditionalLogit Framework (cont.) • For car: • For bus: 𝑈 𝑛,𝑐𝑎𝑟 = 𝛼 𝑐𝑎𝑟>𝑏𝑢𝑠 + 𝛽1 𝑝𝑟𝑖𝑐𝑒 𝑛,𝑐𝑎𝑟 + 𝛽2 𝑐𝑜𝑛𝑣𝑒𝑛𝑖𝑒𝑛𝑐𝑒 𝑛,𝑐𝑎𝑟 + 𝜀 𝑛,𝑐𝑎𝑟 𝑈 𝑛,𝑏𝑢𝑠 = 𝛼 𝑏𝑢𝑠 + 𝛽1 𝑝𝑟𝑖𝑐𝑒 𝑛,𝑏𝑢𝑠 + 𝛽2 𝑐𝑜𝑛𝑣𝑒𝑛𝑖𝑒𝑛𝑐𝑒 𝑛,𝑏𝑢𝑠 + 𝜀 𝑛,𝑏𝑢𝑠 known to the researcher
  • 39.
    How Consumers Choose? •Each consumer will choose the option with highest utility. • But, we have an unknown part • So, • But, this probability depends on 𝛼 and 𝛽’s. 𝑃𝑛,𝑐𝑎𝑟 = 𝑃𝑟𝑜𝑏 𝑈 𝑛,𝑐𝑎𝑟 > 𝑈 𝑛,𝑏𝑢𝑠 𝑃𝑛,𝑏𝑢𝑠 = 𝑃𝑟𝑜𝑏 𝑈 𝑛,𝑏𝑢𝑠 > 𝑈 𝑛,𝑐𝑎𝑟
  • 40.
    What Do WeHave to Do? • If consumer n chooses bus, we want: • If consumer n chooses car, we want: • Ultimately, we have to choose 𝛼 and 𝛽’s such that this happens (or close to happen) 𝑃𝑛,𝑐𝑎𝑟 = 𝑃𝑟𝑜𝑏 𝑈 𝑛,𝑐𝑎𝑟 > 𝑈 𝑛,𝑏𝑢𝑠 = 0 𝑃𝑛,𝑏𝑢𝑠 = 𝑃𝑟𝑜𝑏 𝑈 𝑛,𝑏𝑢𝑠 > 𝑈 𝑛,𝑐𝑎𝑟 = 1 𝑃𝑛,𝑐𝑎𝑟 = 𝑃𝑟𝑜𝑏 𝑈 𝑛,𝑐𝑎𝑟 > 𝑈 𝑛,𝑏𝑢𝑠 = 1 𝑃𝑛,𝑏𝑢𝑠 = 𝑃𝑟𝑜𝑏 𝑈 𝑛,𝑏𝑢𝑠 > 𝑈 𝑛,𝑐𝑎𝑟 = 0
  • 41.
    Likelihood Function • Butwe have N consumers, so we need joint probability. • For instance, if we have 5 consumers: 𝐿 = 𝑃1 ∗ 𝑃2∗ 𝑃3∗ 𝑃4∗ 𝑃5 • We want to find 𝛼 and 𝛽’s that give us the highest likelihood • We must mathematically derive this formula • We must code optimization algorithm
  • 42.
  • 43.
    Nested Logit • Alternativescan be partitioned into subsets, called “nest” • Some information regarding decision making process can be revealed
  • 44.
    Implications • We canfind the maximum value of likelihood for different choice structures to determine which resembles consumers’ behavior best Black Color Pepsi Coke Fanta Mirinda ? ? Pepsi Mirinda Coke Fanta
  • 45.
    Price Elasticity • Ameasure of responsiveness of the quantity of a product or service demanded to changes in its price: 𝜖 = 𝜕𝑄 𝑄 𝜕𝑃/𝑃
  • 49.
    Reference Price • Replaceprice by reference price • Price – Previous Price • Price – Advertised Price • Price – Price that Friends Bought 𝑈 𝑛𝑗 = 𝛼𝑗 + 𝛽1 𝑟𝑒𝑓𝑒𝑟𝑒𝑛𝑐𝑒 𝑝𝑟𝑖𝑐𝑒 𝑛𝑗 + 𝜀 𝑛𝑗
  • 51.
    Contact • Email: suratt7@tbs.tu.ac.th •Facebook: Art Surat Teerakapibal • Line: artsurat