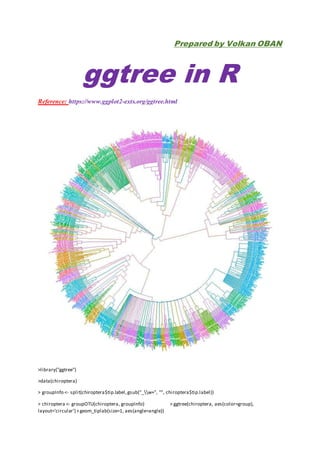
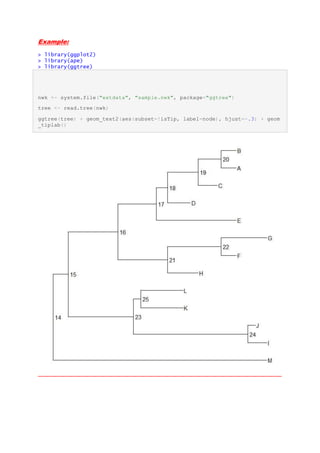
ref:https://www.ggplot2-exts.org/ggtree.html
ggtree
https://bioconductor.org/packages/release/bioc/html/ggtree.html
gtree is designed for visualizing phylogenetic tree and different types of associated annotation data.
Overview of tree algorithms from decision tree to xgboostTakami Sato
For my understanding, I surveyed popular tree algorithms on Machine Learning and their evolution. This is the first time I wrote a presentation in English. So, I am happy if you give me a feedback.
Overview of tree algorithms from decision tree to xgboostTakami Sato
For my understanding, I surveyed popular tree algorithms on Machine Learning and their evolution. This is the first time I wrote a presentation in English. So, I am happy if you give me a feedback.
Kickstart your data science journey with this Python cheat sheet that contains code examples for strings, lists, importing libraries and NumPy arrays.
Find more cheat sheets and learn data science with Python at www.datacamp.com.
Kickstart your data science journey with this Python cheat sheet that contains code examples for strings, lists, importing libraries and NumPy arrays.
Find more cheat sheets and learn data science with Python at www.datacamp.com.
Forecasting through ARIMA Modeling using R
ref:http://ucanalytics.com/blogs/step-by-step-graphic-guide-to-forecasting-through-arima-modeling-in-r-manufacturing-case-study-example/
Some R Examples[R table and Graphics] -Advanced Data Visualization in R (Some...Dr. Volkan OBAN
Some R Examples[R table and Graphics]
Advanced Data Visualization in R (Some Examples)
References:
http://zevross.com/blog/2014/08/04/beautiful-plotting-in-r-a-ggplot2-cheatsheet-3/
http://www.cookbook-r.com/
http://moderndata.plot.ly/trisurf-plots-in-r-using-plotly/
I hope that it would ne useful for UseRs.
Umarım; R programı ile ilgilenen herkes için yararlı olur.
Volkan OBAN
ggtimeseries-->ggplot2 extensions
This R package offers novel time series visualisations. It is based on ggplot2 and offers geoms and pre-packaged functions for easily creating any of the offered charts. Some examples are listed below.
This package can be installed from github by installing devtools library and then running the following command - devtools::install_github('Ather-Energy/ggTimeSeries').
reference: https://github.com/Ather-Energy/ggTimeSeries
The presentation from SPb Python Interest Group community meetup.
The presentation tells about the dictionaries in Python, reviews the implementation of dictionary in CPython 2.x, dictionary in CPython 3.x, and also recent changes in CPython 3.6. In addition to CPython the dictionaries in alternative Python implementations such as PyPy, IronPython and Jython are reviewed.
PLOTCON NYC: Behind Every Great Plot There's a Great Deal of WranglingPlotly
If you are struggling to make a plot, tear yourself away from stackoverflow for a moment and ... take a hard look at your data. Is it really in the most favorable form for the task at hand? Time and time again I have found that my visualization struggles are really a symptom of unfinished data wrangling. R has long had excellent facilities for data aggregation or "split-apply-combine": split an object into pieces, compute on each piece, and glue the result back together again. Recent developments, especially in the purrr package, have made "split-apply-combine" even easier and more general. But this requires a certain comfort level with lists, especially with lists that are columns inside a data frame. This is unfamiliar to most of us. I give an overview of this set of problems and match them up with solutions based on grouped, nested, and split data frames.
Rapid and Scalable Development with MongoDB, PyMongo, and MingRick Copeland
This intermediate-level talk will teach you techniques using the popular NoSQL database MongoDB and the Python library Ming to write maintainable, high-performance, and scalable applications. We will cover everything you need to become an effective Ming/MongoDB developer from basic PyMongo queries to high-level object-document mapping setups in Ming.
I'll found many papers and books talking about category theory, but many peoples still don't know how it can help. On this talk I'll help you better understand how math can help us develop a software more composable.
Coder on Beer - Concrete
2018 - São Paulo
When working with enterprise applications, you want to have the same user experience that you know from for instance office applications and browsers. People know how to use the features that can be found in browsers such as bookmarking, favorites, and working with tabs. The search mechanism provided by Google, that uses suggestions based on the text typed by the user, is so common that people expect this in every application. And there are more of these UI patterns. In this session, you will learn how to implement some of the common UI patterns in your ADF application.
Talk was presented at PGConfUS on April 20th, 2016.
___________
With features like foreign data wrappers, Postgres makes it easy for you to integrate rich data stores into your application architectures. Yet sometimes you only have a few rich data structures to deal with, or can’t afford the time and resource cost of running a NoSQL cluster alongside Postgres. Happily Postgres natively supports several document data formats, giving you the best of both worlds in one database. You can keep document oriented data solely within Postgres, or write a foreign table schema that’s naturally compatible with your document database.
At this talk you’ll learn how to access document data stored in Postgres, and write Ruby code to make use of the data with your favorite ORM. We’ll survey the various document stores which are natively supported in Postgres. You’ll learn what are the pros and cons of each data type, and come away understanding which use cases are best suited to each document store.
Covid19py by Konstantinos Kamaropoulos
A tiny Python package for easy access to up-to-date Coronavirus (COVID-19, SARS-CoV-2) cases data.
ref:https://github.com/Kamaropoulos/COVID19Py
https://pypi.org/project/COVID19Py/?fbclid=IwAR0zFKe_1Y6Nm0ak1n0W1ucFZcVT4VBWEP4LOFHJP-DgoL32kx3JCCxkGLQ
"optrees" package in R and examples.(optrees:finds optimal trees in weighted ...Dr. Volkan OBAN
Finds optimal trees in weighted graphs. In
particular, this package provides solving tools for minimum cost spanning
tree problems, minimum cost arborescence problems, shortest path tree
problems and minimum cut tree problem.
by Volkan OBAN
k-means Clustering in Python
scikit-learn--Machine Learning in Python
from sklearn.cluster import KMeans
k-means clustering is a method of vector quantization, originally from signal processing, that is popular for cluster analysis in data mining. k-means clustering aims to partition n observations into k clusters in which each observation belongs to the cluster with the nearest mean, serving as a prototype of the cluster. This results in a partitioning of the data space into Voronoi cells.
The problem is computationally difficult (NP-hard); however, there are efficient heuristic algorithms that are commonly employed and converge quickly to a local optimum. These are usually similar to the expectation-maximization algorithm for mixtures of Gaussian distributions via an iterative refinement approach employed by both algorithms. Additionally, they both use cluster centers to model the data; however, k-means clustering tends to find clusters of comparable spatial extent, while the expectation-maximization mechanism allows clusters to have different shapes.[wikipedia]
ref: http://scikit-learn.org/stable/auto_examples/cluster/plot_cluster_iris.html
k-means Clustering and Custergram with R.
K Means Clustering is an unsupervised learning algorithm that tries to cluster data based on their similarity. Unsupervised learning means that there is no outcome to be predicted, and the algorithm just tries to find patterns in the data. In k means clustering, we have the specify the number of clusters we want the data to be grouped into. The algorithm randomly assigns each observation to a cluster, and finds the centroid of each cluster.
ref:https://www.r-bloggers.com/k-means-clustering-in-r/
ref:https://rpubs.com/FelipeRego/K-Means-Clustering
ref:https://www.r-bloggers.com/clustergram-visualization-and-diagnostics-for-cluster-analysis-r-code/
Data Science and its Relationship to Big Data and Data-Driven Decision MakingDr. Volkan OBAN
Data Science and its Relationship to Big Data and Data-Driven Decision Making
To cite this article:
Foster Provost and Tom Fawcett. Big Data. February 2013, 1(1): 51-59. doi:10.1089/big.2013.1508.
Foster Provost and Tom Fawcett
Published in Volume: 1 Issue 1: February 13, 2013
ref:http://online.liebertpub.com/doi/full/10.1089/big.2013.1508
https://www.researchgate.net/publication/256439081_Data_Science_and_Its_Relationship_to_Big_Data_and_Data-Driven_Decision_Making
R Machine Learning packages( generally used)
prepared by Volkan OBAN
reference:
https://github.com/josephmisiti/awesome-machine-learning#r-general-purpose
Data visualization with R.
Mosaic plot .
---Ref: https://www.stat.auckland.ac.nz/~ihaka/120/Lectures/lecture17.pdf
http://www.statmethods.net/advgraphs/mosaic.html
https://stat.ethz.ch/R-manual/R-devel/library/graphics/html/mosaicplot.html
imager package in R and example
References:
http://dahtah.github.io/imager/
http://dahtah.github.io/imager/imager.html
https://cran.r-project.org/web/packages/imager/imager.pdf
Levelwise PageRank with Loop-Based Dead End Handling Strategy : SHORT REPORT ...Subhajit Sahu
Abstract — Levelwise PageRank is an alternative method of PageRank computation which decomposes the input graph into a directed acyclic block-graph of strongly connected components, and processes them in topological order, one level at a time. This enables calculation for ranks in a distributed fashion without per-iteration communication, unlike the standard method where all vertices are processed in each iteration. It however comes with a precondition of the absence of dead ends in the input graph. Here, the native non-distributed performance of Levelwise PageRank was compared against Monolithic PageRank on a CPU as well as a GPU. To ensure a fair comparison, Monolithic PageRank was also performed on a graph where vertices were split by components. Results indicate that Levelwise PageRank is about as fast as Monolithic PageRank on the CPU, but quite a bit slower on the GPU. Slowdown on the GPU is likely caused by a large submission of small workloads, and expected to be non-issue when the computation is performed on massive graphs.
Opendatabay - Open Data Marketplace.pptxOpendatabay
Opendatabay.com unlocks the power of data for everyone. Open Data Marketplace fosters a collaborative hub for data enthusiasts to explore, share, and contribute to a vast collection of datasets.
First ever open hub for data enthusiasts to collaborate and innovate. A platform to explore, share, and contribute to a vast collection of datasets. Through robust quality control and innovative technologies like blockchain verification, opendatabay ensures the authenticity and reliability of datasets, empowering users to make data-driven decisions with confidence. Leverage cutting-edge AI technologies to enhance the data exploration, analysis, and discovery experience.
From intelligent search and recommendations to automated data productisation and quotation, Opendatabay AI-driven features streamline the data workflow. Finding the data you need shouldn't be a complex. Opendatabay simplifies the data acquisition process with an intuitive interface and robust search tools. Effortlessly explore, discover, and access the data you need, allowing you to focus on extracting valuable insights. Opendatabay breaks new ground with a dedicated, AI-generated, synthetic datasets.
Leverage these privacy-preserving datasets for training and testing AI models without compromising sensitive information. Opendatabay prioritizes transparency by providing detailed metadata, provenance information, and usage guidelines for each dataset, ensuring users have a comprehensive understanding of the data they're working with. By leveraging a powerful combination of distributed ledger technology and rigorous third-party audits Opendatabay ensures the authenticity and reliability of every dataset. Security is at the core of Opendatabay. Marketplace implements stringent security measures, including encryption, access controls, and regular vulnerability assessments, to safeguard your data and protect your privacy.
Data Centers - Striving Within A Narrow Range - Research Report - MCG - May 2...pchutichetpong
M Capital Group (“MCG”) expects to see demand and the changing evolution of supply, facilitated through institutional investment rotation out of offices and into work from home (“WFH”), while the ever-expanding need for data storage as global internet usage expands, with experts predicting 5.3 billion users by 2023. These market factors will be underpinned by technological changes, such as progressing cloud services and edge sites, allowing the industry to see strong expected annual growth of 13% over the next 4 years.
Whilst competitive headwinds remain, represented through the recent second bankruptcy filing of Sungard, which blames “COVID-19 and other macroeconomic trends including delayed customer spending decisions, insourcing and reductions in IT spending, energy inflation and reduction in demand for certain services”, the industry has seen key adjustments, where MCG believes that engineering cost management and technological innovation will be paramount to success.
MCG reports that the more favorable market conditions expected over the next few years, helped by the winding down of pandemic restrictions and a hybrid working environment will be driving market momentum forward. The continuous injection of capital by alternative investment firms, as well as the growing infrastructural investment from cloud service providers and social media companies, whose revenues are expected to grow over 3.6x larger by value in 2026, will likely help propel center provision and innovation. These factors paint a promising picture for the industry players that offset rising input costs and adapt to new technologies.
According to M Capital Group: “Specifically, the long-term cost-saving opportunities available from the rise of remote managing will likely aid value growth for the industry. Through margin optimization and further availability of capital for reinvestment, strong players will maintain their competitive foothold, while weaker players exit the market to balance supply and demand.”