Download to read offline


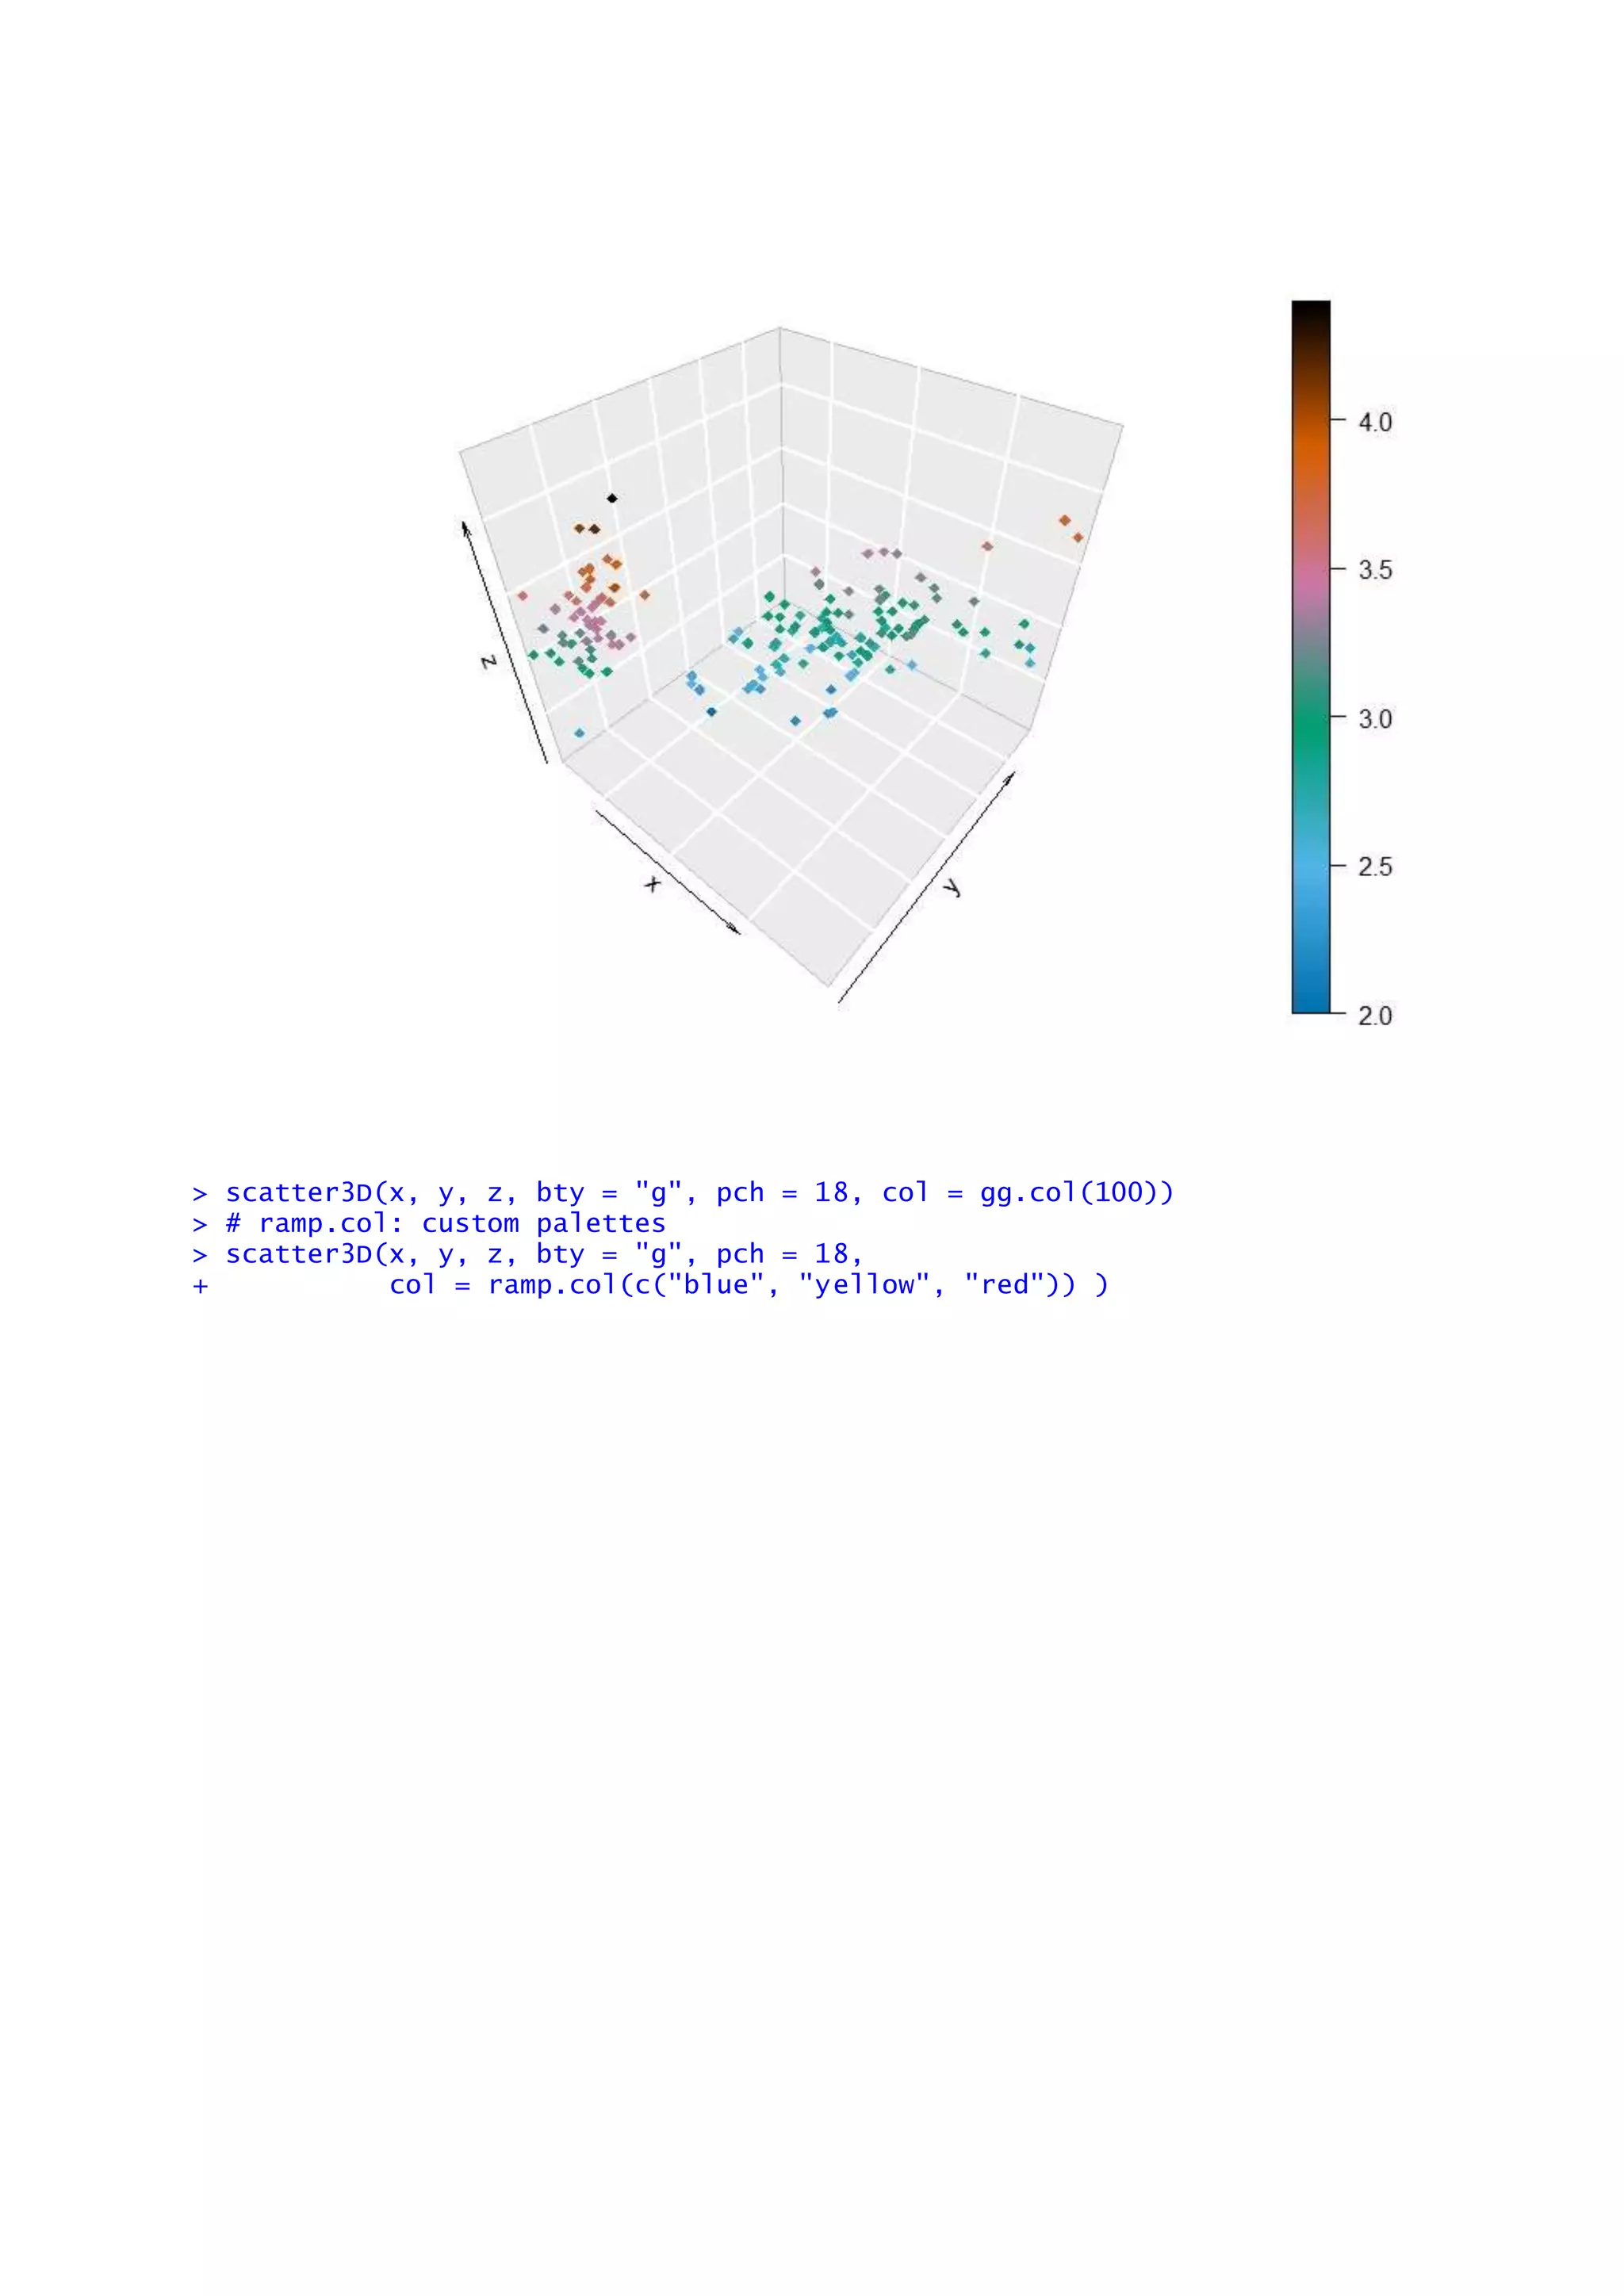


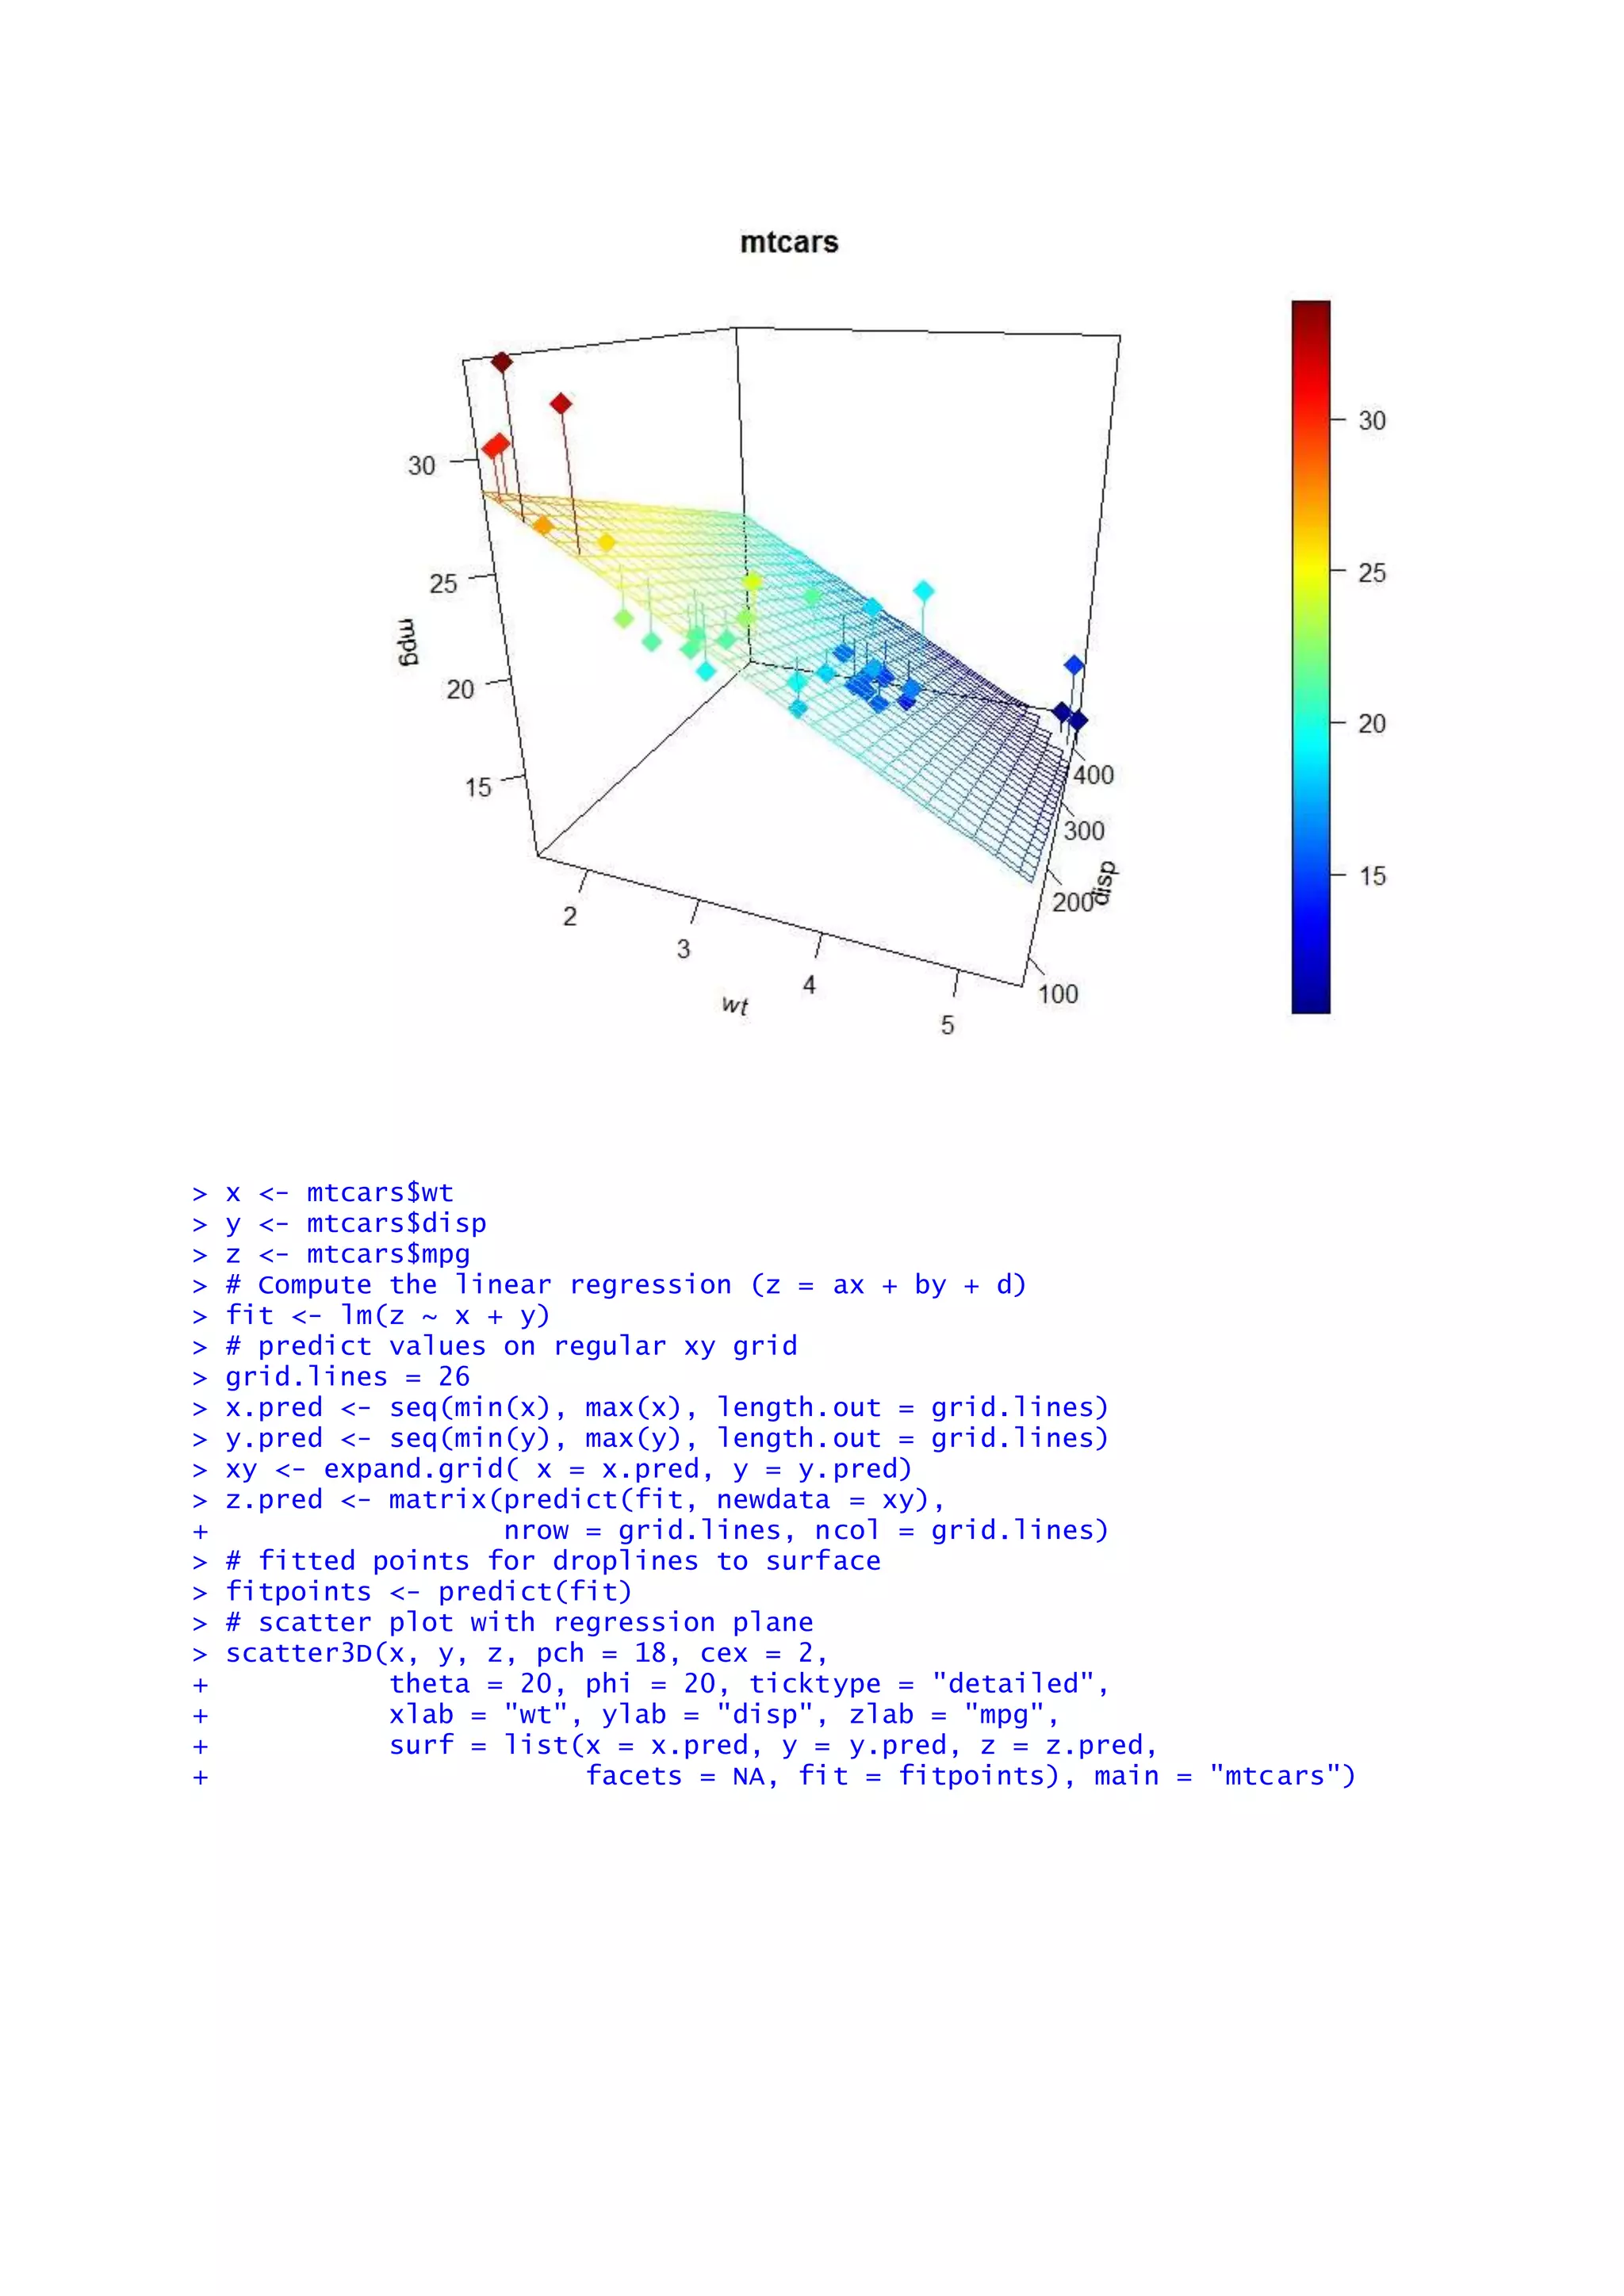

This document discusses the use of the plot3d package in R for 3D data visualization, including various functions like text3d, hist3d, and scatter3d. It provides examples using datasets such as 'usarrests', 'vadeaths', and 'iris' to demonstrate creating 3D plots, adding text labels, and visualizing relationships between multiple variables. The document includes code snippets to guide users on plotting techniques and data representation in a 3D space.


![Some Examples in R- [Data Visualization--R graphics]](https://cdn.slidesharecdn.com/ss_thumbnails/rchart-160729210112-thumbnail.jpg?width=640&height=640&fit=bounds)