Downloaded 12 times

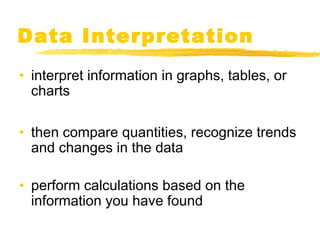
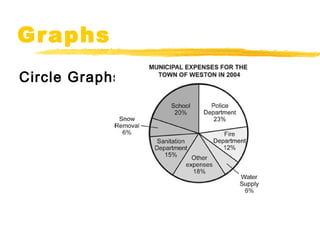
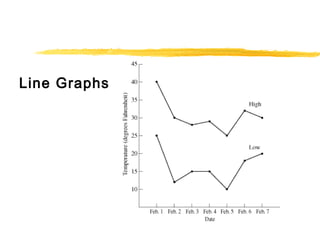
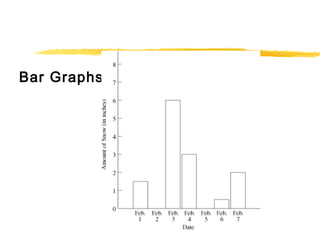
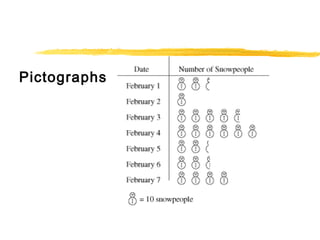
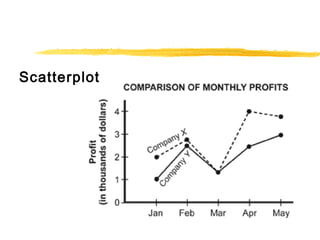
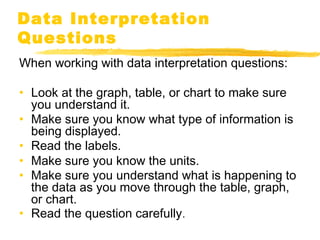
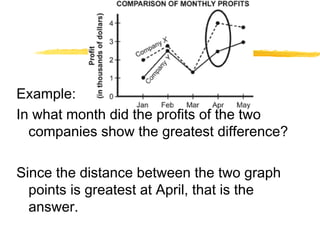
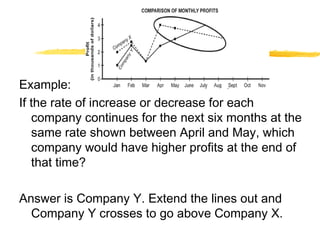
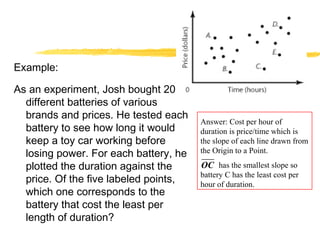
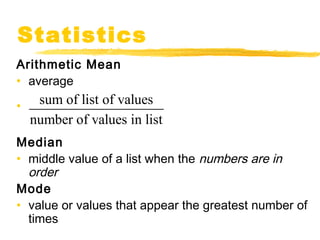
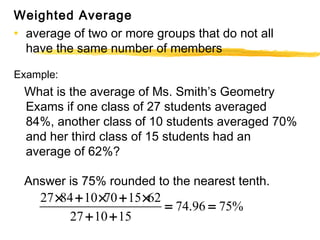
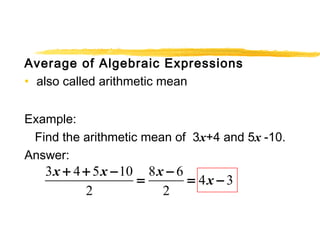
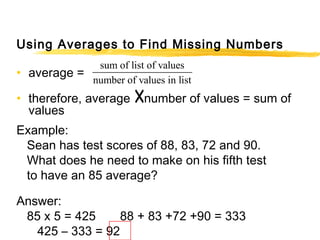
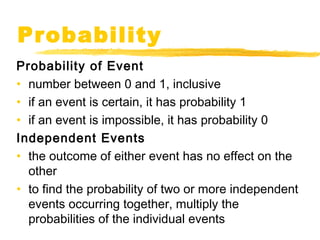
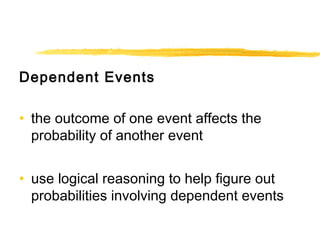
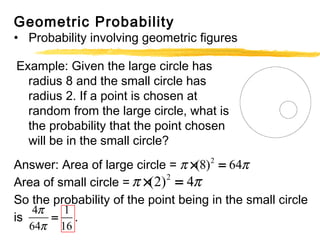
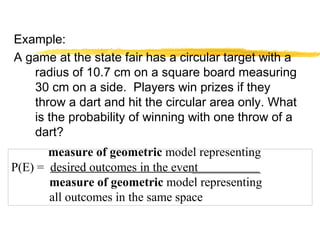
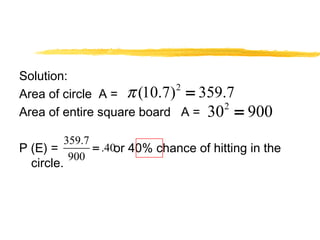

This document provides an overview of topics related to data analysis, statistics, and probability that may be covered on the SAT. It includes brief explanations of different types of graphs used to display data, guidelines for interpreting data from graphs, tables, and charts, definitions and examples of common statistical concepts like mean, median, mode, and weighted average, and explanations of probability, independent and dependent events, and calculating probabilities using geometric models. Practice problems with solutions are provided as examples.


