Downloaded 13 times

![5
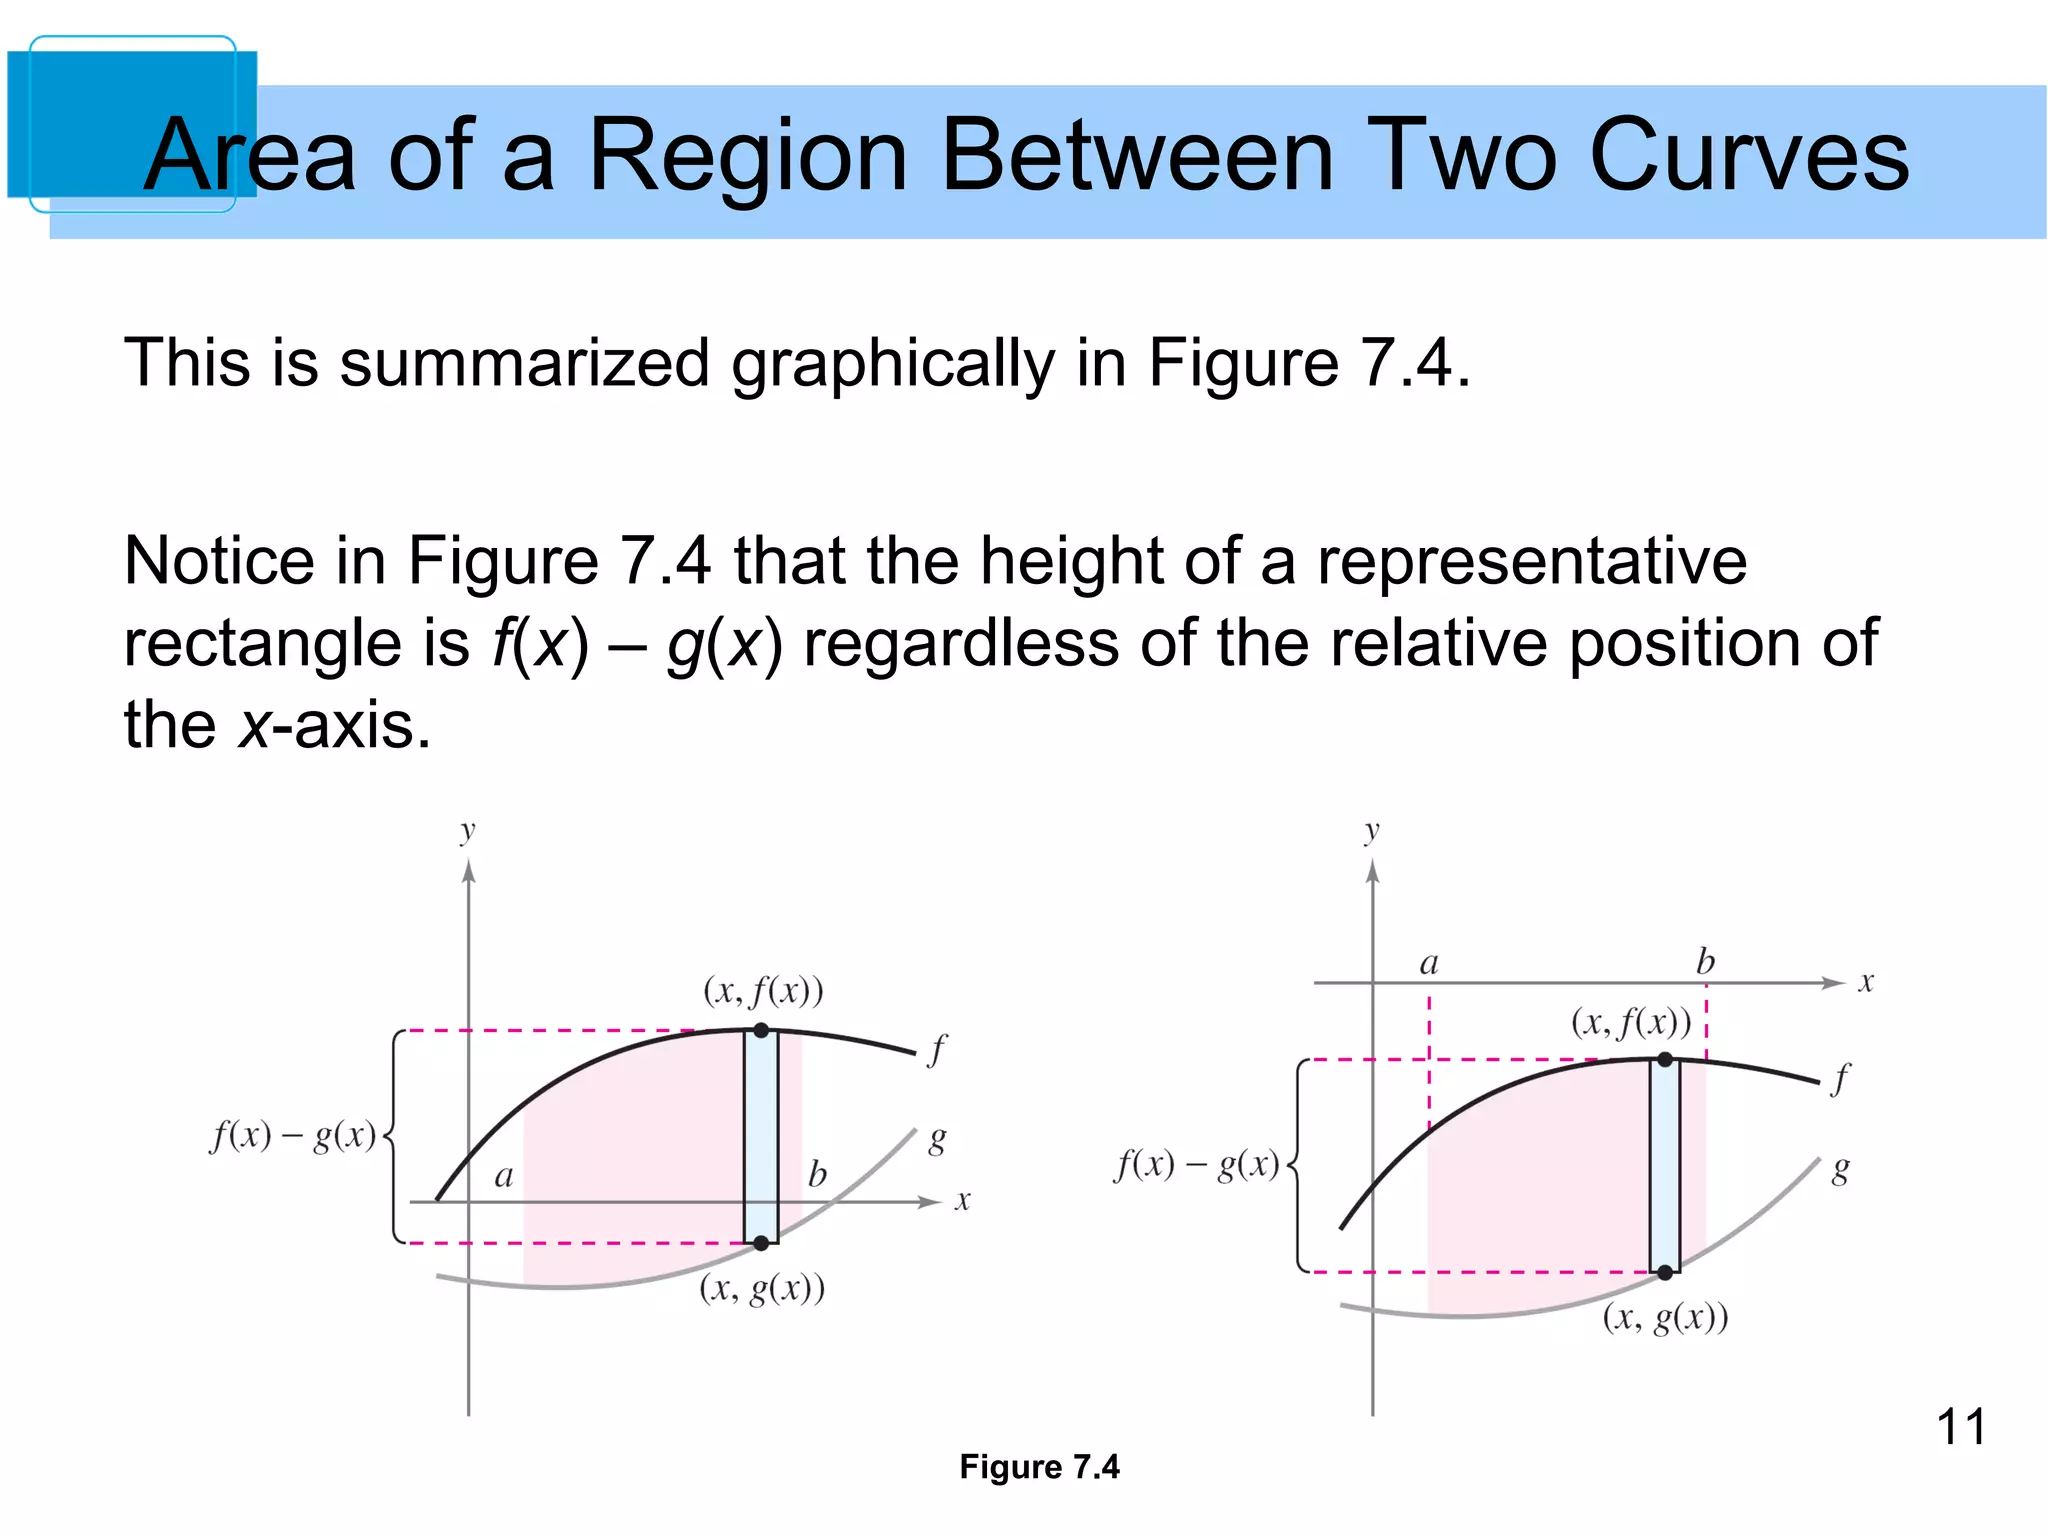
Area of a Region Between Two Curves
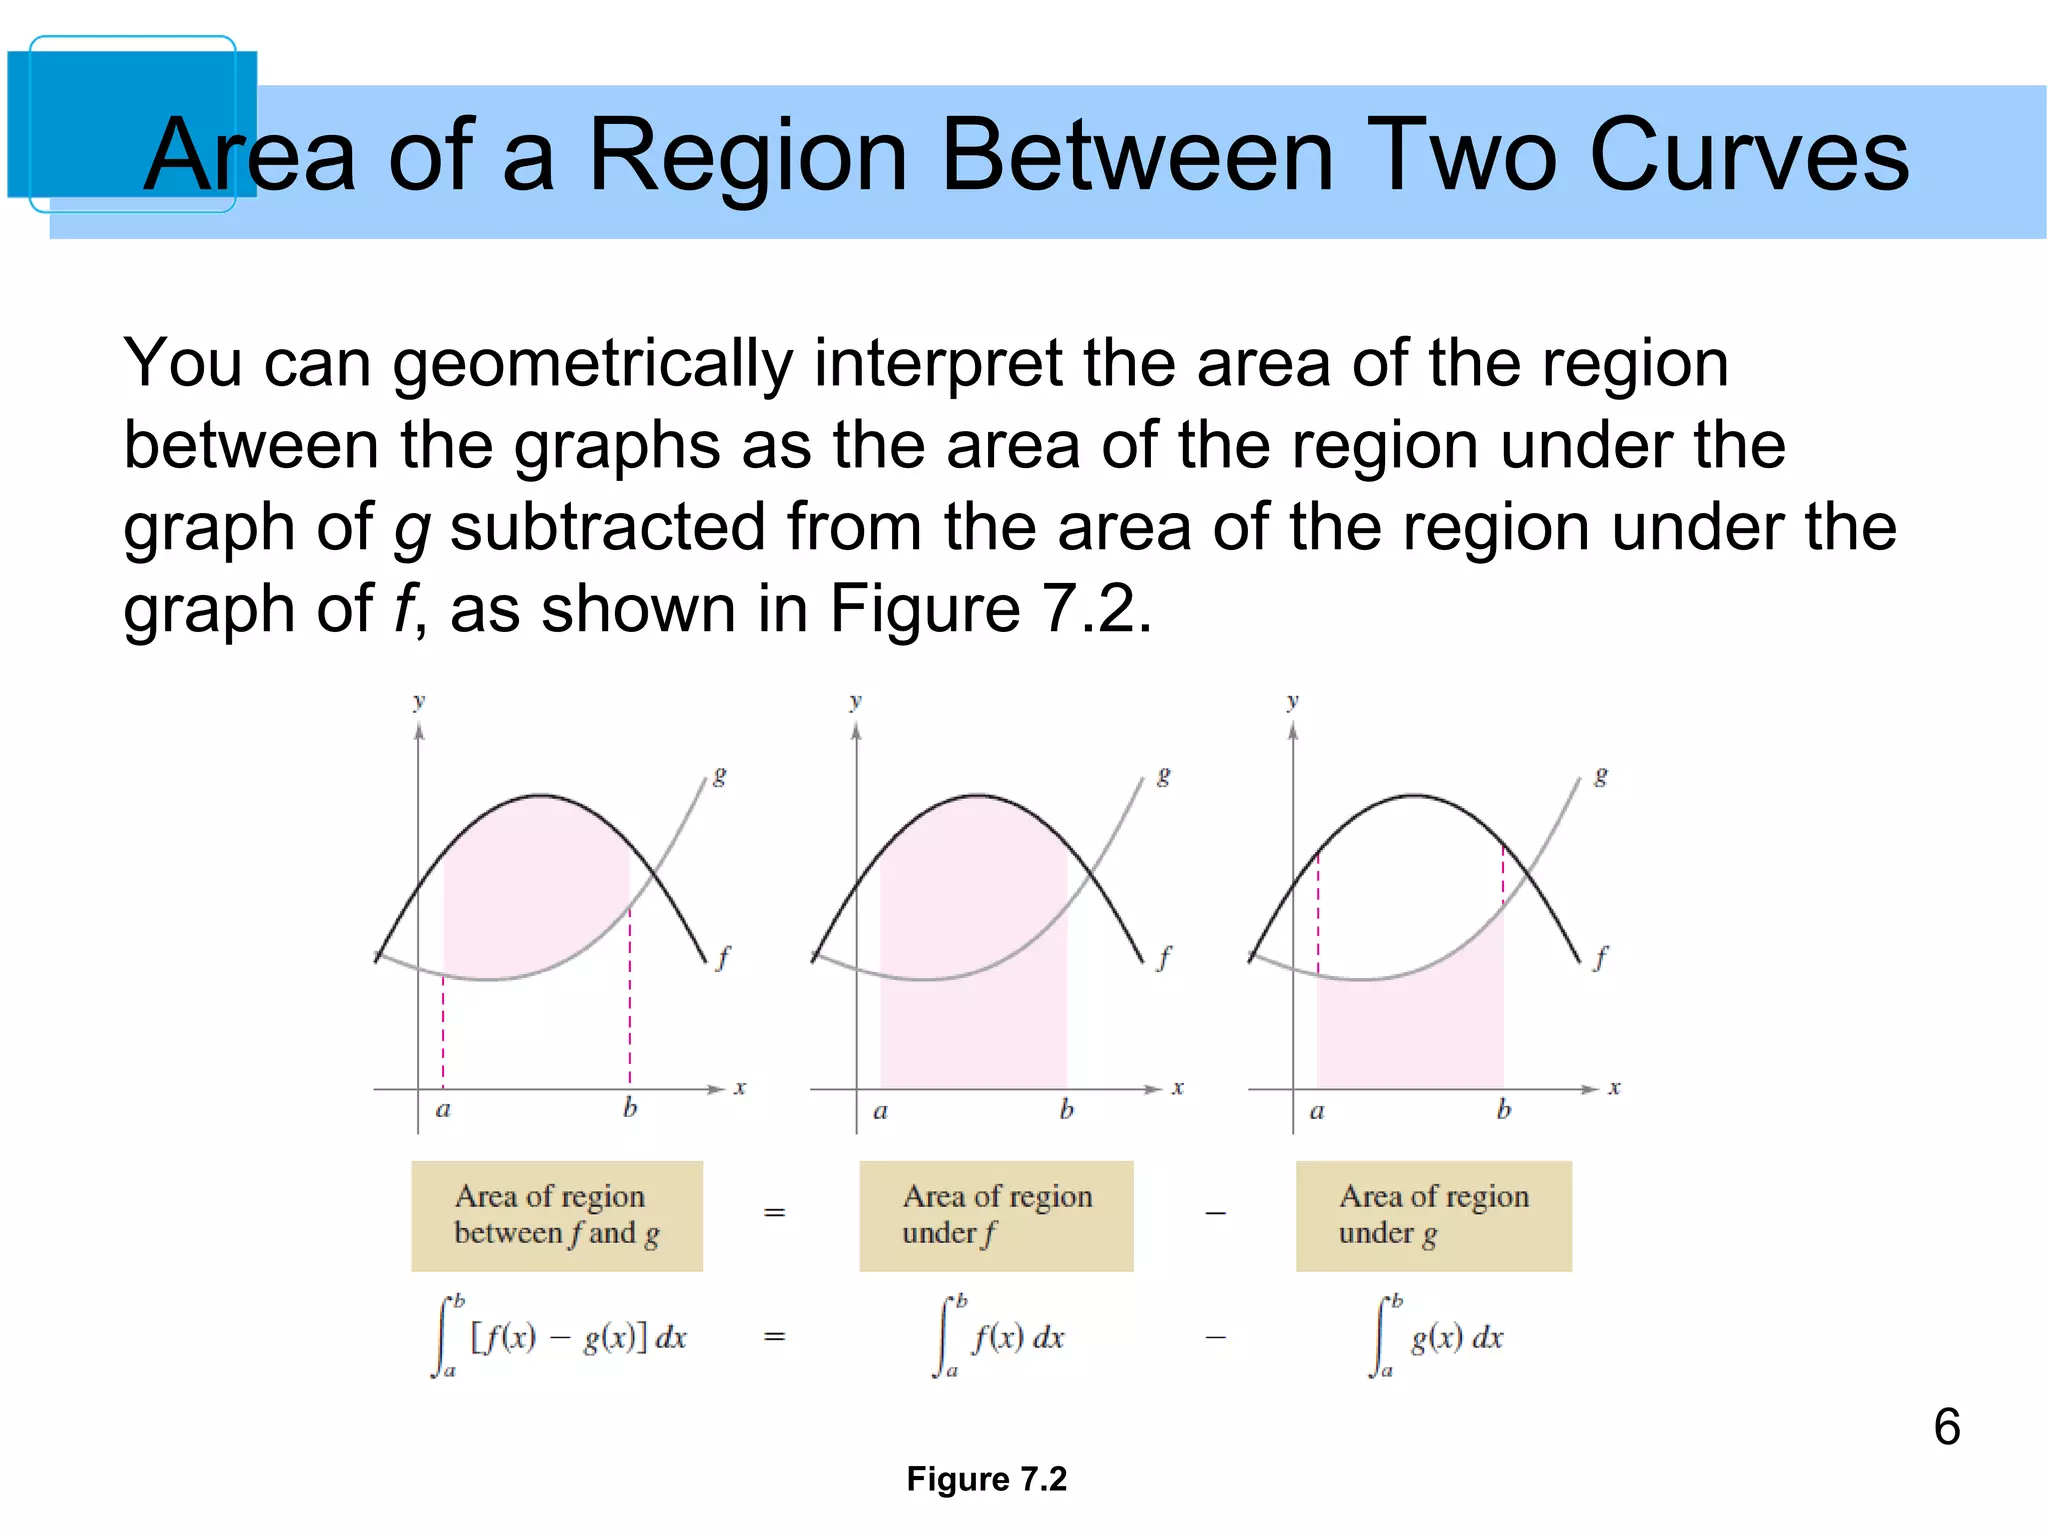
With a few modifications, you can extend the application of
definite integrals from the area of a region under a curve to
the area of a region between two curves.
Consider two functions f and g that are continuous on the
interval [a, b].
Also, the graphs of both f and g
lie above the x-axis, and the graph
of g lies below the graph of f,
as shown in Figure 7.1.
Figure 7.1](https://image.slidesharecdn.com/larcalc10ch07sec1-140831022047-phpapp01/75/Lar-calc10-ch07_sec1-5-2048.jpg)
![7
Area of a Region Between Two Curves
To verify the reasonableness of the result shown in
Figure 7.2, you can partition the interval [a, b] into n
subintervals, each of width Dx.
Then, as shown in Figure 7.3,
sketch a representative rectangle
of width Dx and height f(xi) – g(xi),
where xi is in the ith subinterval.
Figure 7.3](https://image.slidesharecdn.com/larcalc10ch07sec1-140831022047-phpapp01/75/Lar-calc10-ch07_sec1-7-2048.jpg)
![8
Area of a Region Between Two Curves
The area of this representative rectangle is
DAi = (height)(width) = [f(xi) – g(xi)]Dx.
By adding the areas of the n rectangles and taking the limit
as ||D||→0 (n→ ), you obtain
Because f and g are continuous on [a, b], f – g is also
continuous on [a, b] and the limit exists. So, the area of the
given region is](https://image.slidesharecdn.com/larcalc10ch07sec1-140831022047-phpapp01/75/Lar-calc10-ch07_sec1-8-2048.jpg)
![10
Area of a Region Between Two Curves
In Figure 7.1, the graphs of f and g are shown above the
x-axis. This, however, is not necessary.
Figure 7.1
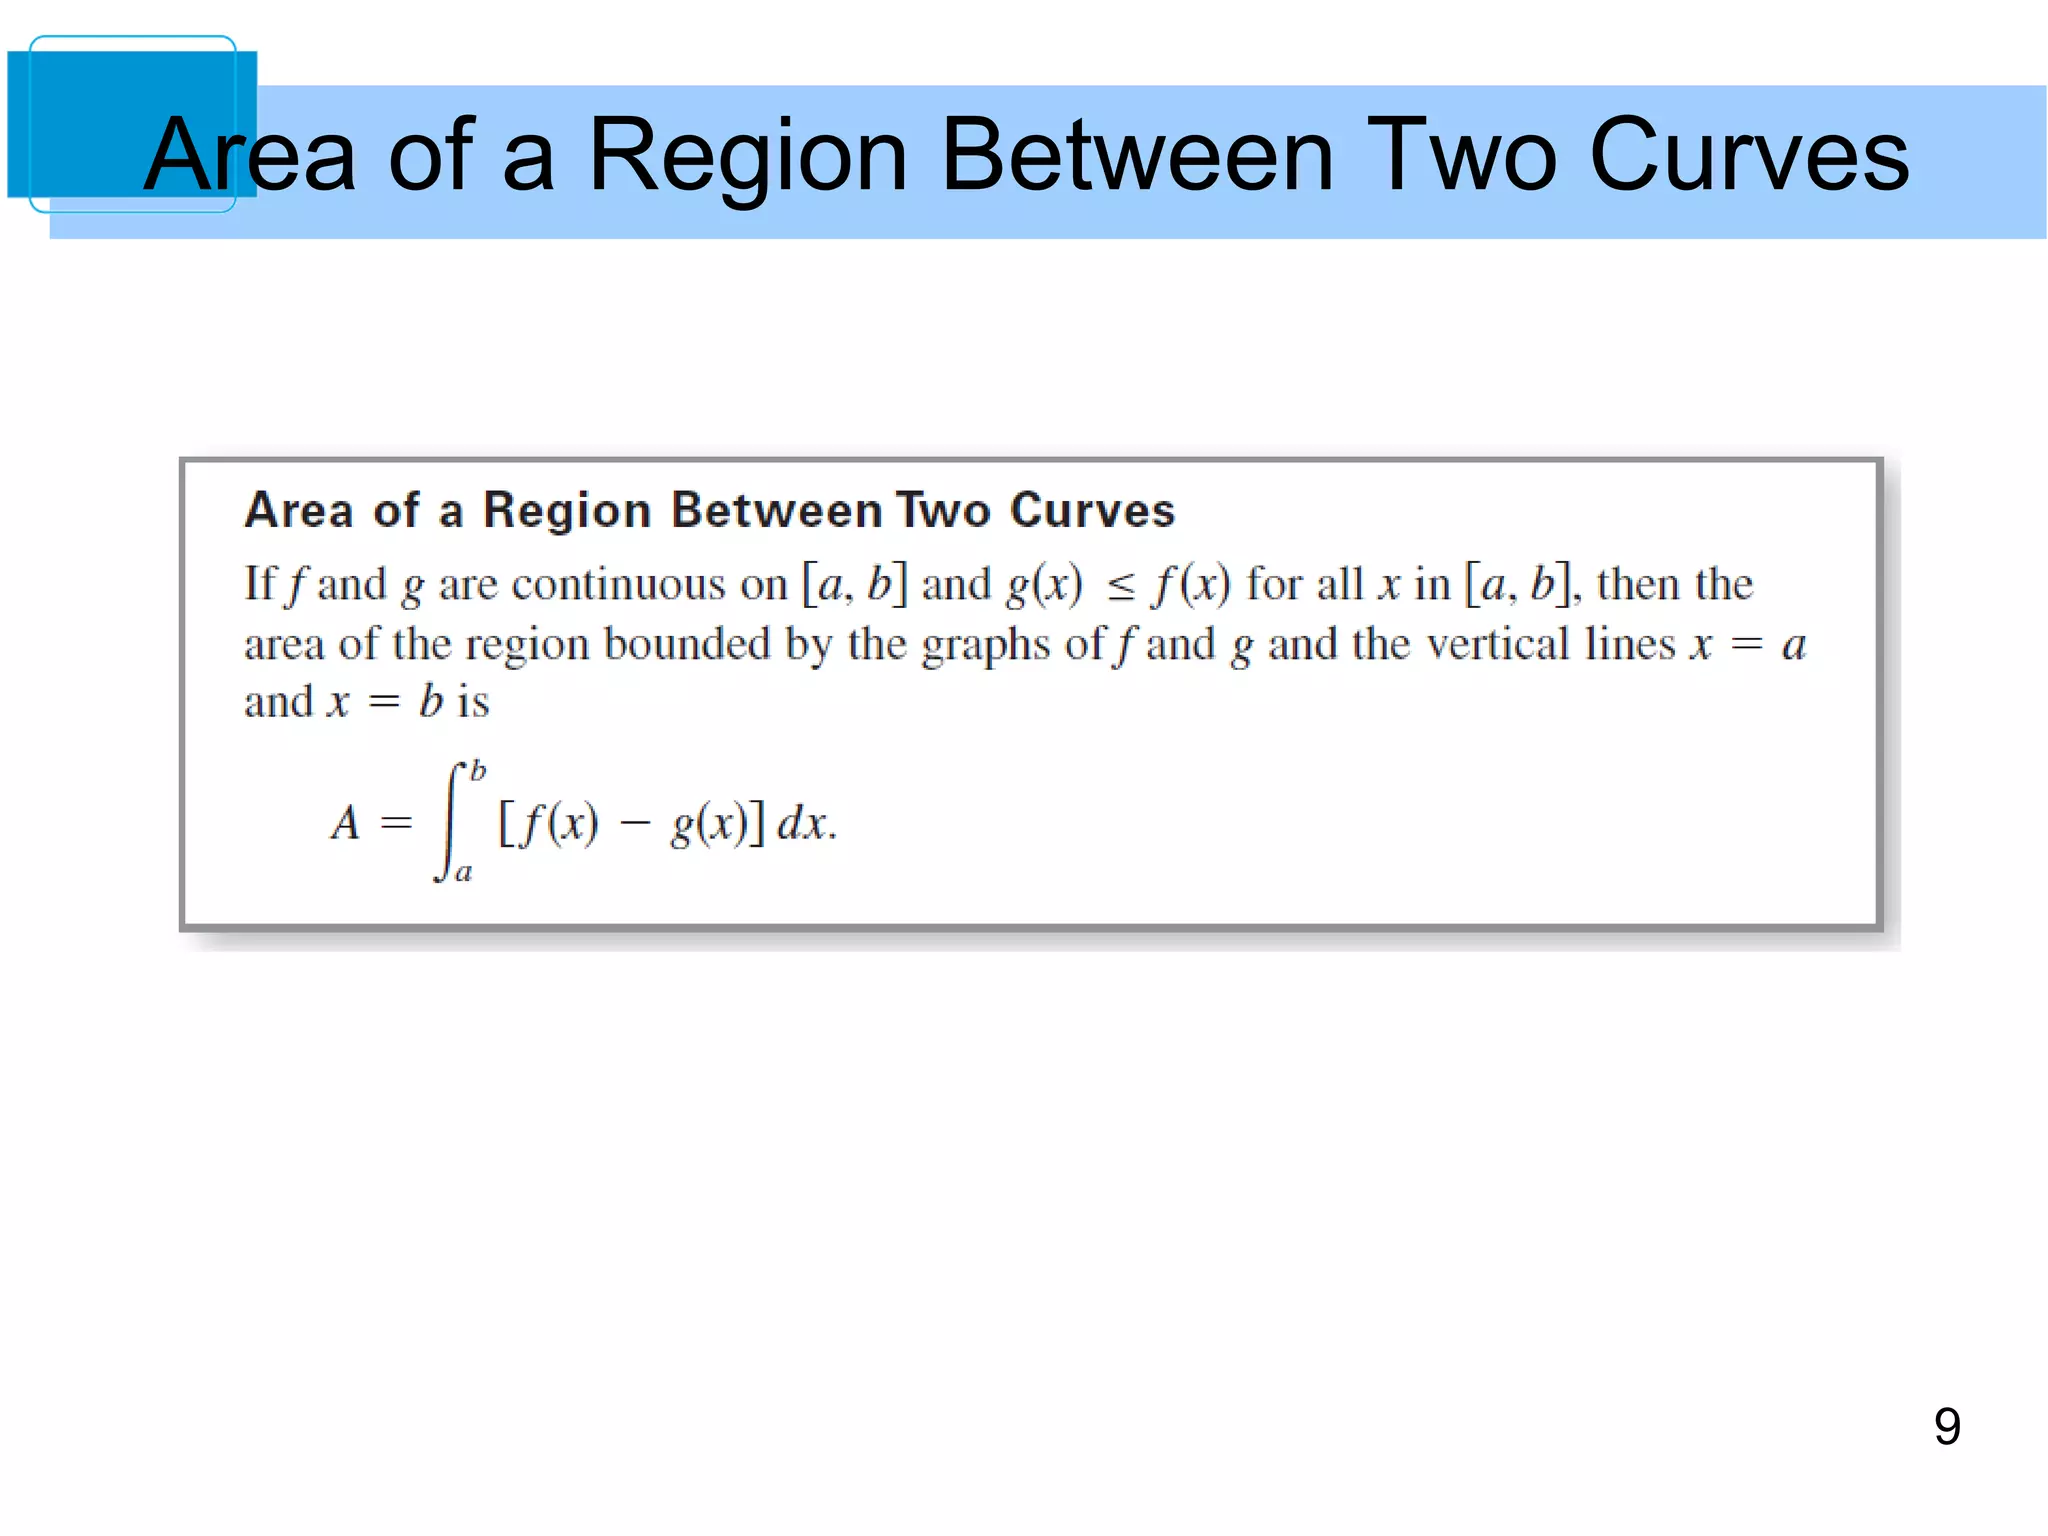
The same integrand [f(x) – g(x)] can be used as long as
f and g are continuous and g(x) ≤ f(x) for all x in the interval
[a, b].](https://image.slidesharecdn.com/larcalc10ch07sec1-140831022047-phpapp01/75/Lar-calc10-ch07_sec1-10-2048.jpg)
![13
Example 1 – Finding the Area of a Region Between Two Curves
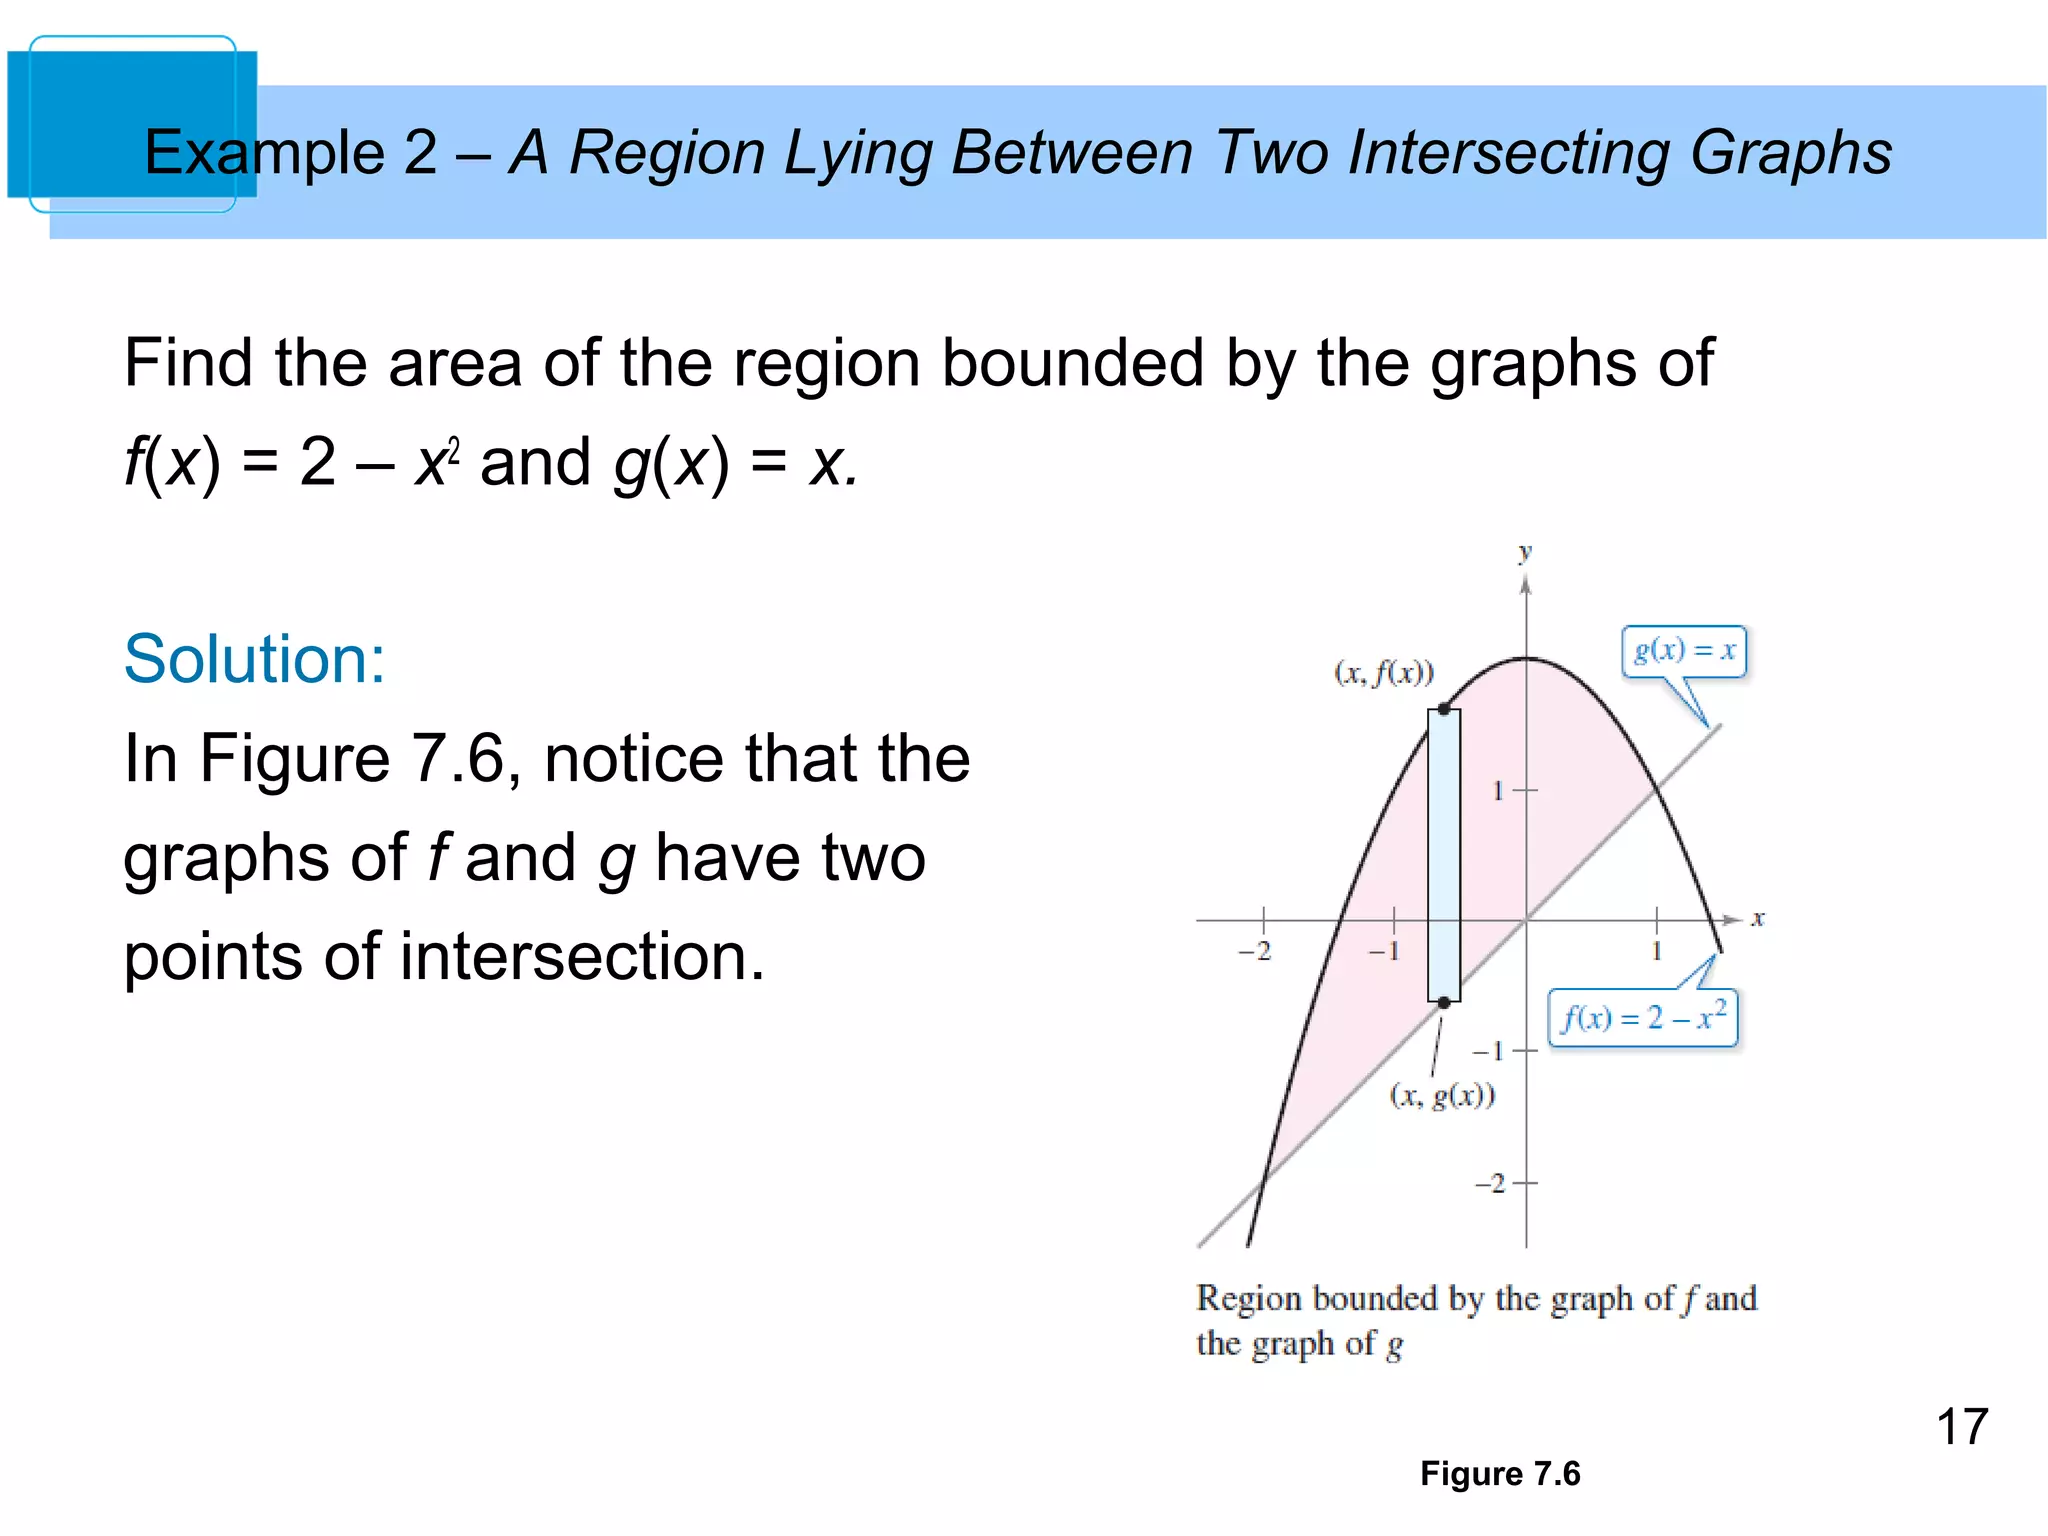
Find the area of the region bounded by the graphs of
f(x) = x2 + 2, g(x) = –x, x = 0, and x = 1.
Solution:
Let g(x) = –x and f(x) = x2 + 2.
Then g(x) ≤ f(x) for all x in [0, 1],
as shown in Figure 7.5.
Figure 7.5](https://image.slidesharecdn.com/larcalc10ch07sec1-140831022047-phpapp01/75/Lar-calc10-ch07_sec1-13-2048.jpg)
![14
Example 1 – Solution
So, the area of the representative rectangle is
DA = [f(x) – g(x)]Dx
= [(x2 + 2) – (–x)]Dx
and the area of the region is
cont’d](https://image.slidesharecdn.com/larcalc10ch07sec1-140831022047-phpapp01/75/Lar-calc10-ch07_sec1-14-2048.jpg)
![cont’d Example 2 – Solution
19
Because g(x) ≤ f(x) for all x in the interval [–2, 1], the
representative rectangle has an area of
DA = [f(x) – g(x)]Dx
= [(2 – x2) – x]Dx
and the area of the region is](https://image.slidesharecdn.com/larcalc10ch07sec1-140831022047-phpapp01/75/Lar-calc10-ch07_sec1-19-2048.jpg)
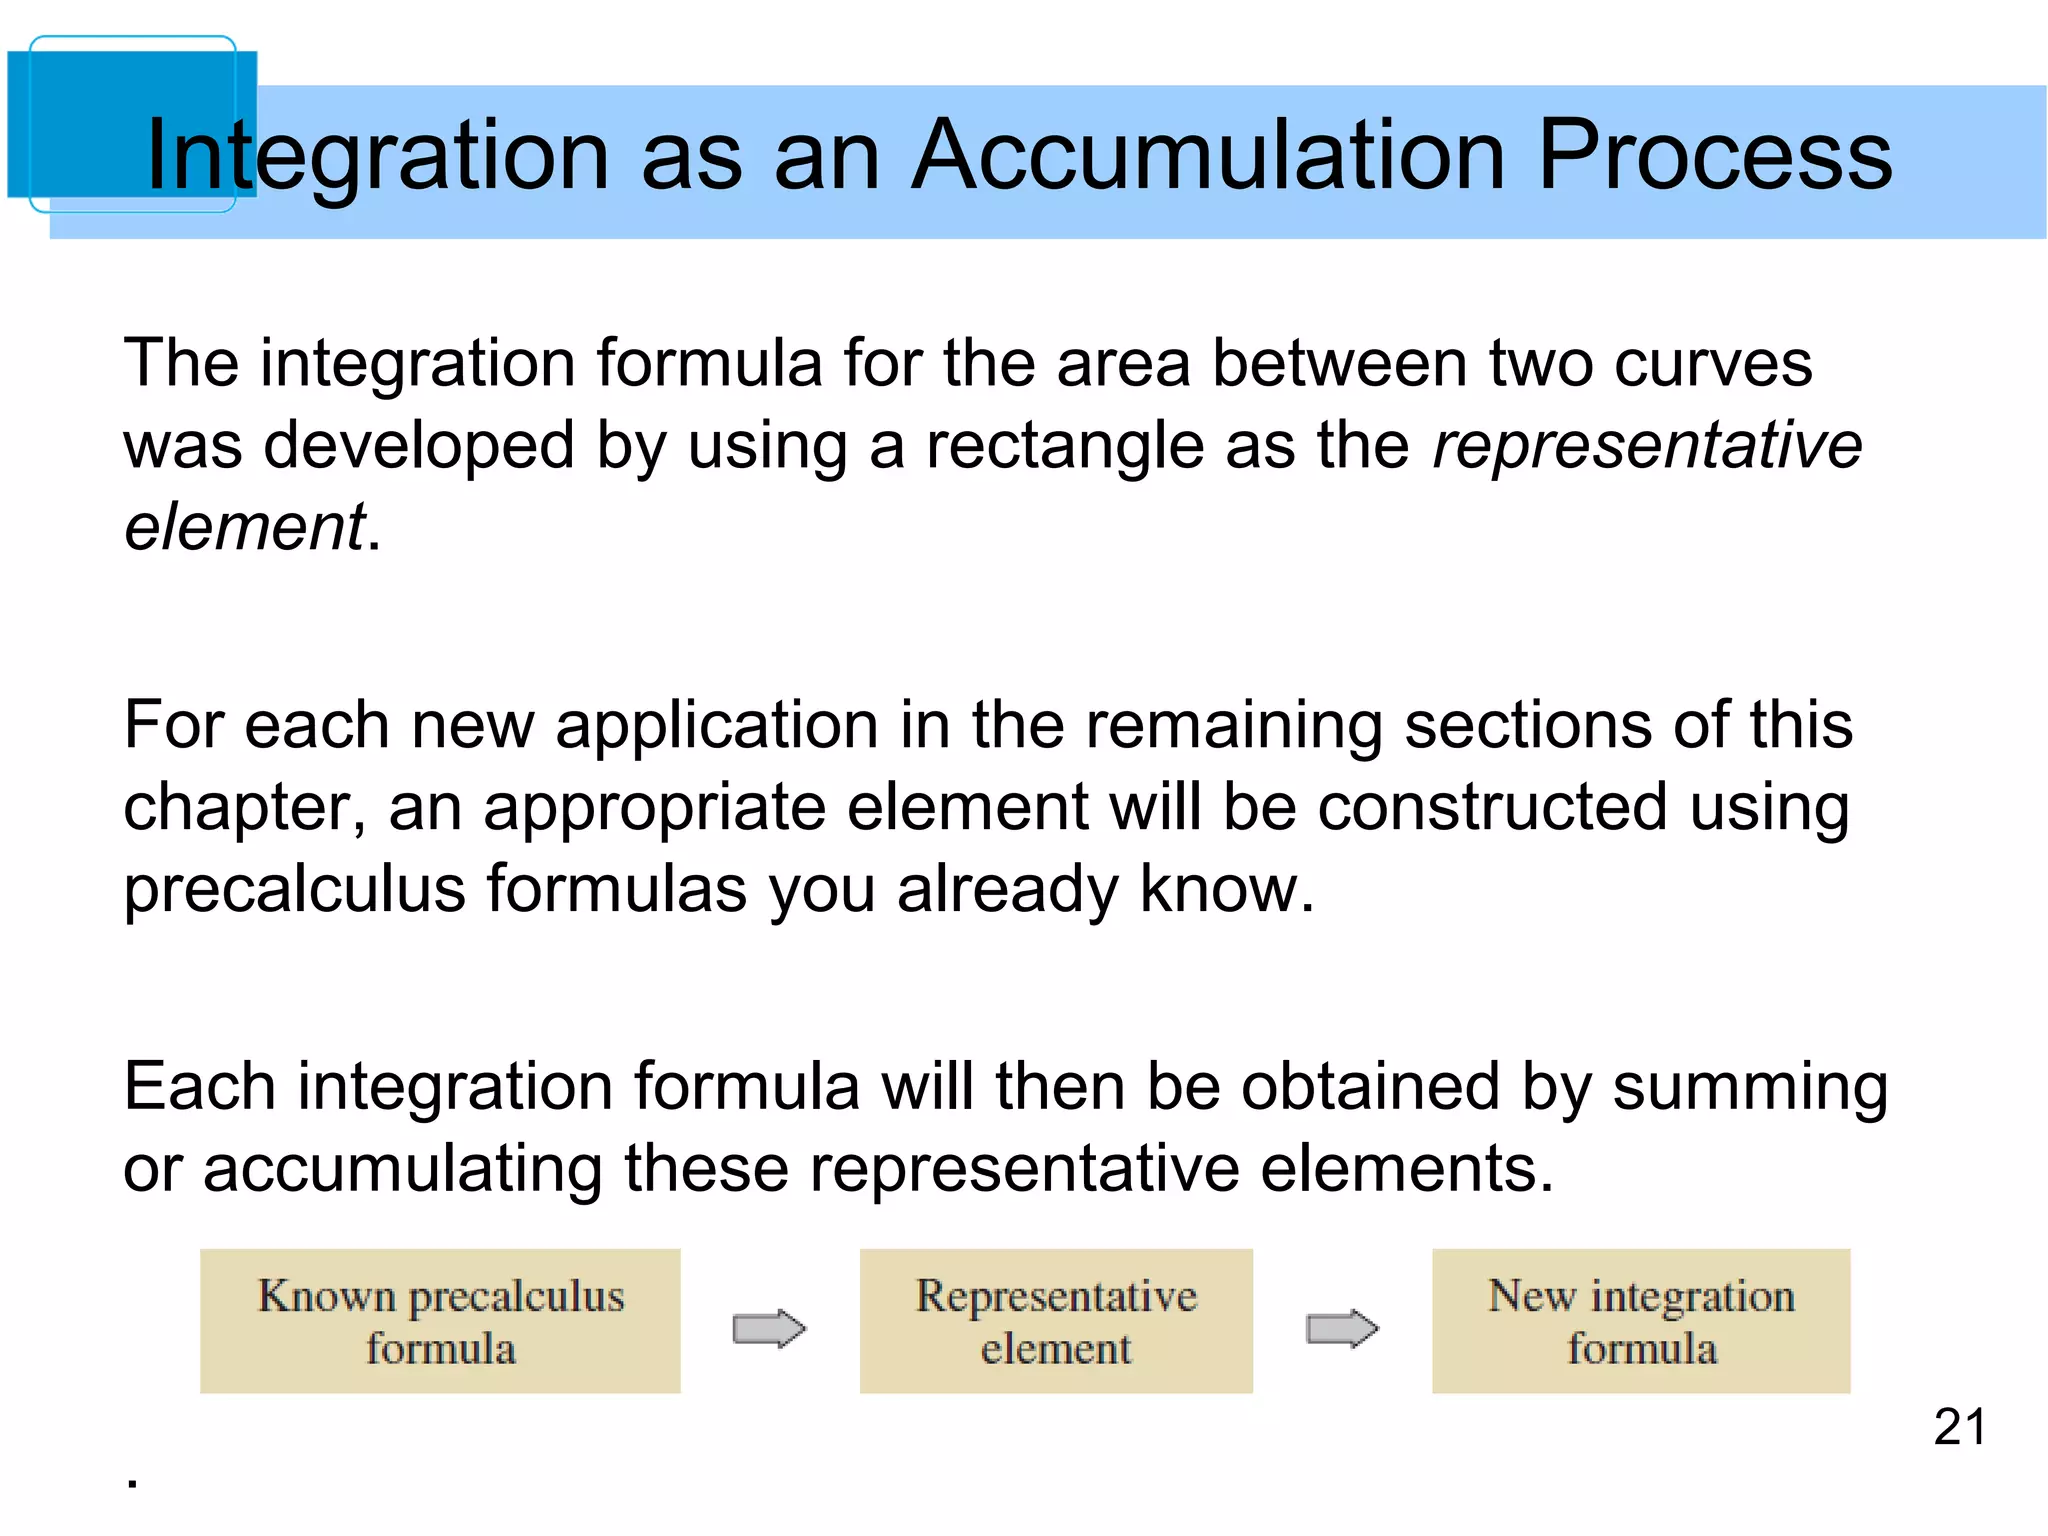
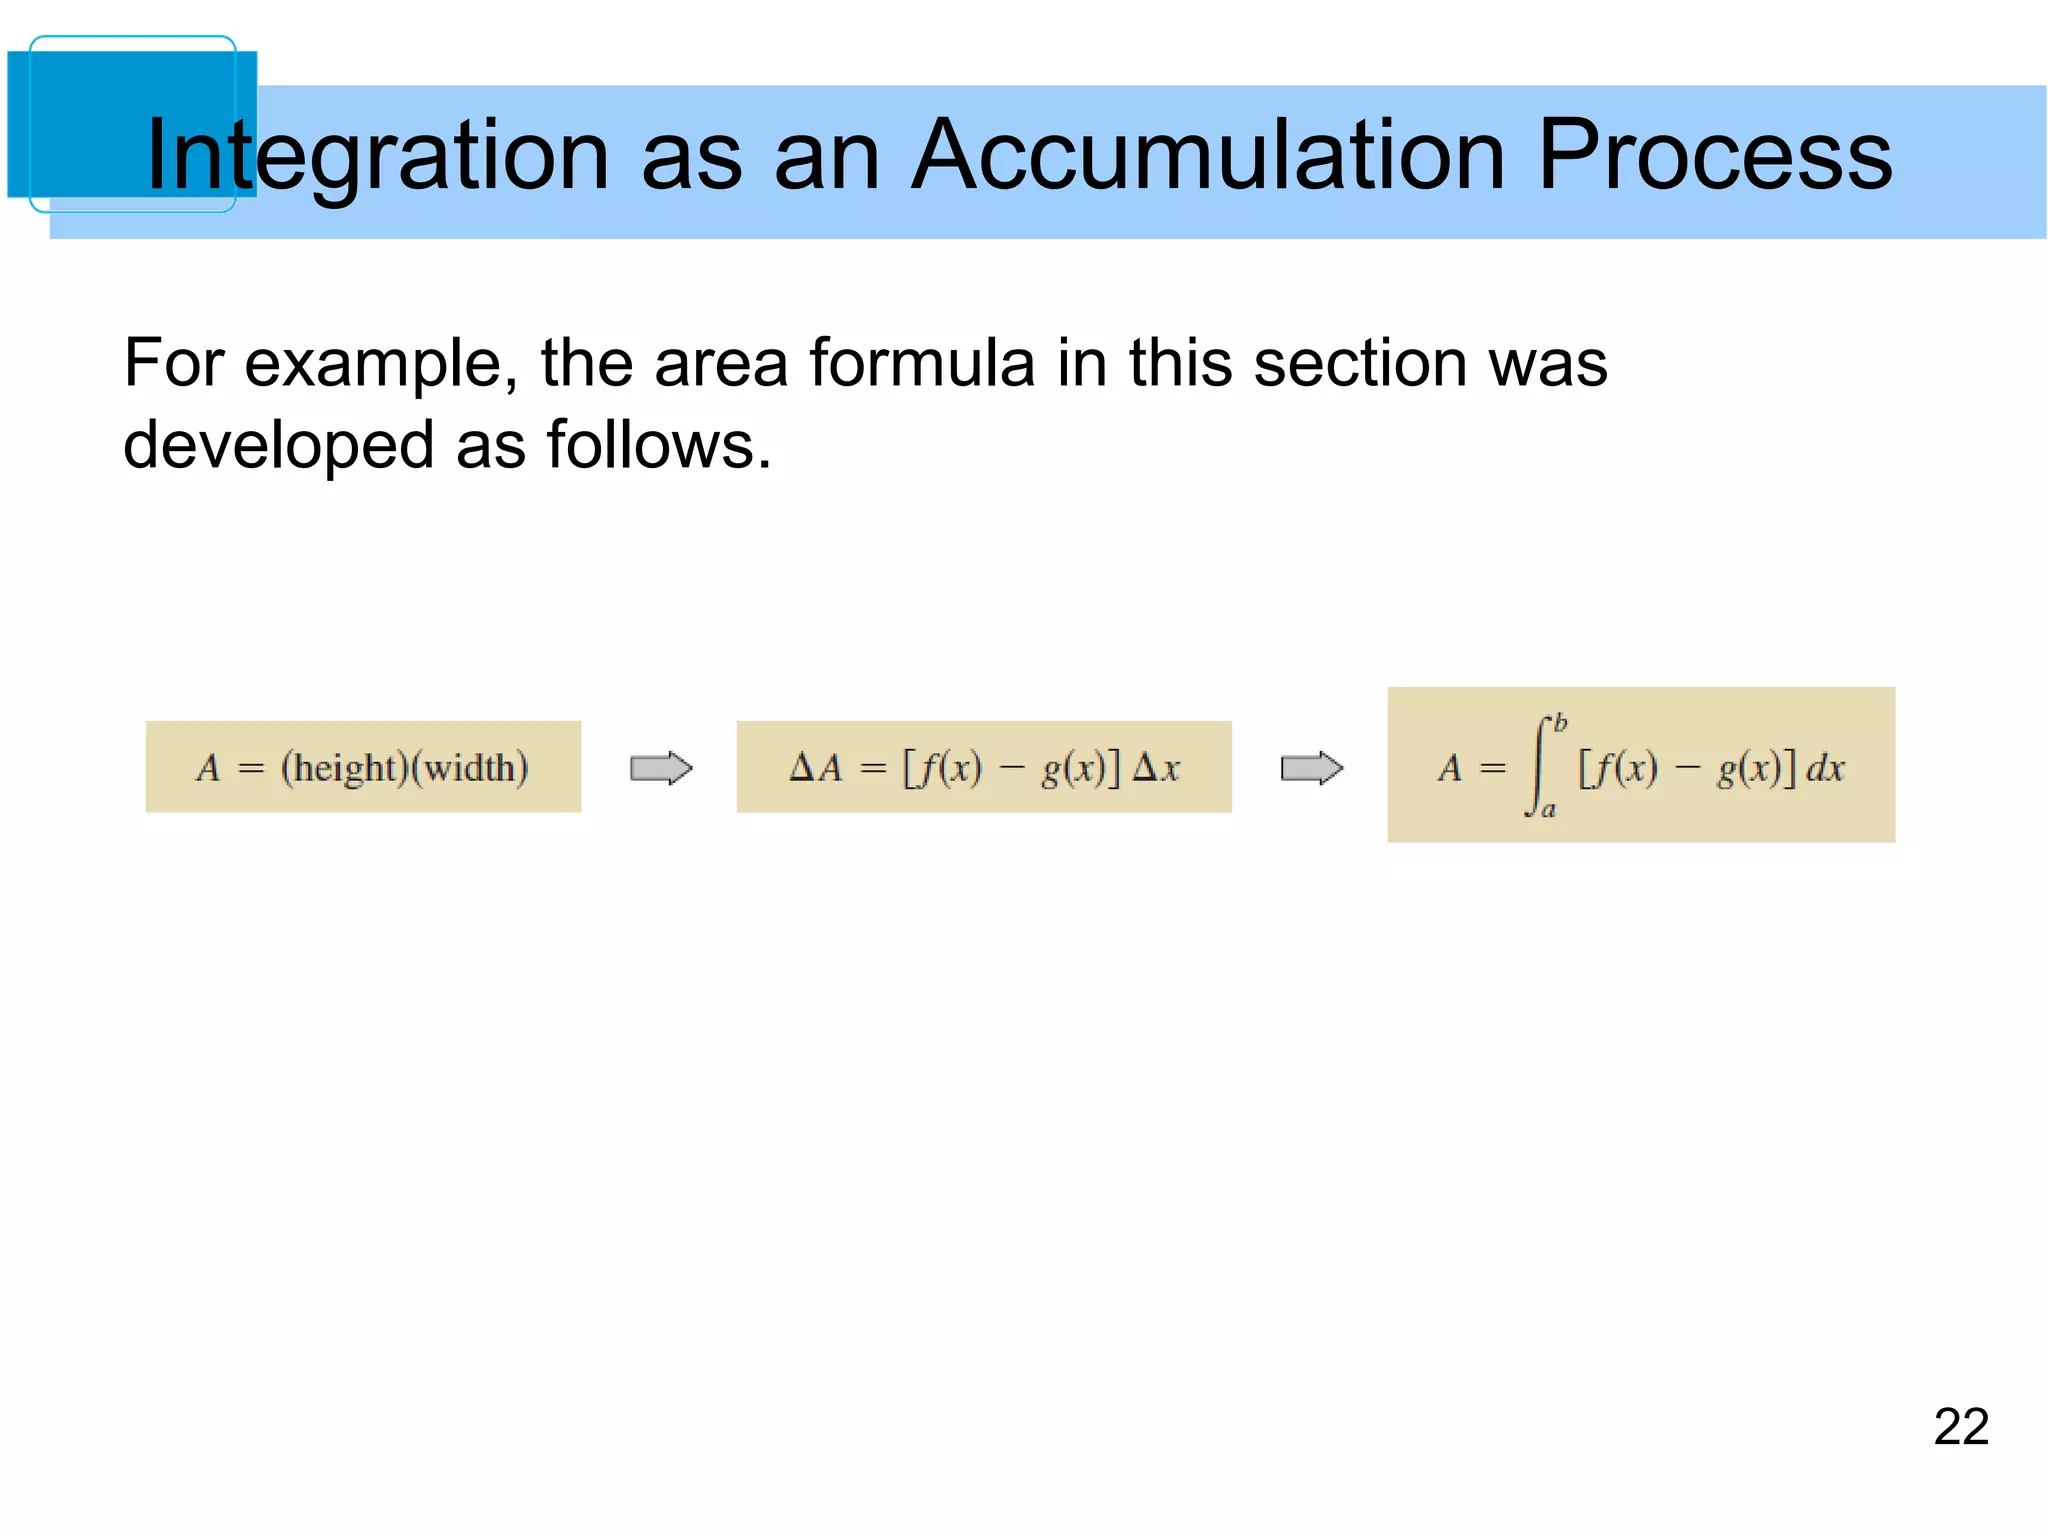

This document discusses using integration to find the area between two curves. It defines the area between two functions f and g on an interval [a,b] as the area under f subtracted by the area under g. This is calculated using the integral from a to b of f(x) - g(x) dx. Examples are provided of finding the area between two non-intersecting curves and between two intersecting curves, where the intersection points define the limits of integration a and b. Integration is described as an accumulation process where the integral represents summing the areas of thin rectangles between the curves.