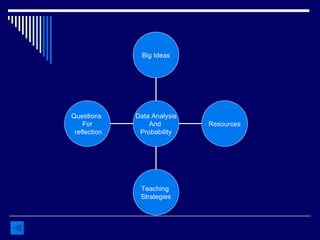
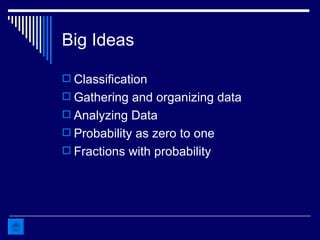
Data Analysis  and Probability Jenny, Heather, Kristi, and Becky
Questions  For  reflection Teaching  Strategies Resources Big Ideas Data Analysis And  Probability
Big Ideas Classification Gathering and organizing data Analyzing Data Probability as zero to one Fractions with probability
Classification It involves making decisions on how to categorize things It involves looking at the item’s or person’s attributes Example Venn Diagram Ask students to compare attribute pieces  * See National content recommendations Pre-K-8
Gathering and organizing data Involves asking and answering questions Make it relevant to the students Data must first be organized Make connections to other subject areas Example Take samples of a population Conduct a survey of the class  * See National content recommendations Pre-K-8
Analyzing Data Looking at the shapes of the data Making the data real and applicable Descriptive statistics Averages Mean, Median, Mode Box and Whisker * See National content recommendations Pre-K-8
Analyzing Data Example Take a survey of the class about how the students came to school that day. Represent the data in one of the following ways: Bar graphs, picture graphs, stem and leaf plots, histographs, & circle graphs. * See National content recommendations Pre-K-8
Probability from Zero to One Describing outcomes of events based on the zero to one continuum.  Zero is impossible and one is certain Example: Spinner : Have students use applet to determine possible outcomes of the sections of the spinner. Bobby Bear * See National content recommendations Pre-K-8
Fractions with Probability Theoretical and experimental probability Theoretical-what you expect will happen Experimental- what actually happens The larger the size of data set, the closer the experimental probability will be to the theoretical Example: Have students flip a coin ten times. Then have the students generalize the outcome and find the theoretical probability of 100 times. * See National content recommendations Pre-K-8
Teaching Strategies Encourage students to do their best Allow students to explore the problems themselves Include simulations Encourage risk taking Include technology Online resources Applets
Resources  EMSM textbook Chapter 21 Books: “ Frog and Toad are Friends”  Lobal, 1970 “ Incredible Comparisons” Ash, 1996 “ Do you Wanna Bet? Your Chance to Find Out About Probability” Cushman, 1991 Illuminations Website
Reflection Questions How does Data Analysis and probability connect to other strands of mathematics and in students’ everyday lives?  How will this look in your classroom? Ready to respond? Yes (go to blackboard) No ( back to the beginning )

Data Analysis And Probability

  • 1.
    Data Analysis and Probability Jenny, Heather, Kristi, and Becky
  • 2.
    Questions For reflection Teaching Strategies Resources Big Ideas Data Analysis And Probability
  • 3.
    Big Ideas ClassificationGathering and organizing data Analyzing Data Probability as zero to one Fractions with probability
  • 4.
    Classification It involvesmaking decisions on how to categorize things It involves looking at the item’s or person’s attributes Example Venn Diagram Ask students to compare attribute pieces * See National content recommendations Pre-K-8
  • 5.
    Gathering and organizingdata Involves asking and answering questions Make it relevant to the students Data must first be organized Make connections to other subject areas Example Take samples of a population Conduct a survey of the class * See National content recommendations Pre-K-8
  • 6.
    Analyzing Data Lookingat the shapes of the data Making the data real and applicable Descriptive statistics Averages Mean, Median, Mode Box and Whisker * See National content recommendations Pre-K-8
  • 7.
    Analyzing Data ExampleTake a survey of the class about how the students came to school that day. Represent the data in one of the following ways: Bar graphs, picture graphs, stem and leaf plots, histographs, & circle graphs. * See National content recommendations Pre-K-8
  • 8.
    Probability from Zeroto One Describing outcomes of events based on the zero to one continuum. Zero is impossible and one is certain Example: Spinner : Have students use applet to determine possible outcomes of the sections of the spinner. Bobby Bear * See National content recommendations Pre-K-8
  • 9.
    Fractions with ProbabilityTheoretical and experimental probability Theoretical-what you expect will happen Experimental- what actually happens The larger the size of data set, the closer the experimental probability will be to the theoretical Example: Have students flip a coin ten times. Then have the students generalize the outcome and find the theoretical probability of 100 times. * See National content recommendations Pre-K-8
  • 10.
    Teaching Strategies Encouragestudents to do their best Allow students to explore the problems themselves Include simulations Encourage risk taking Include technology Online resources Applets
  • 11.
    Resources EMSMtextbook Chapter 21 Books: “ Frog and Toad are Friends” Lobal, 1970 “ Incredible Comparisons” Ash, 1996 “ Do you Wanna Bet? Your Chance to Find Out About Probability” Cushman, 1991 Illuminations Website
  • 12.
    Reflection Questions Howdoes Data Analysis and probability connect to other strands of mathematics and in students’ everyday lives? How will this look in your classroom? Ready to respond? Yes (go to blackboard) No ( back to the beginning )