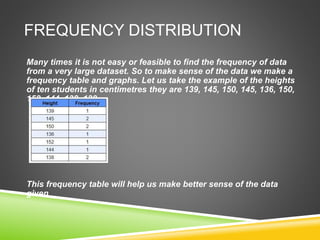
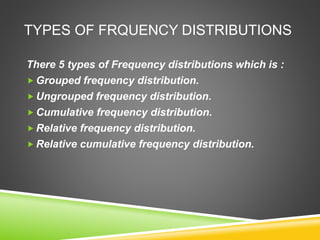
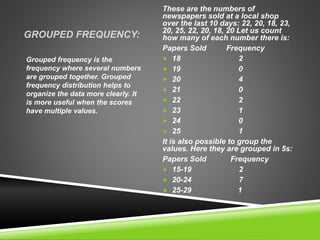
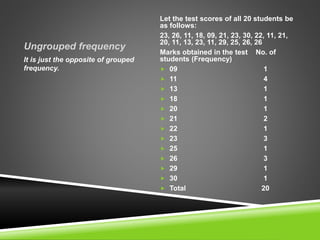
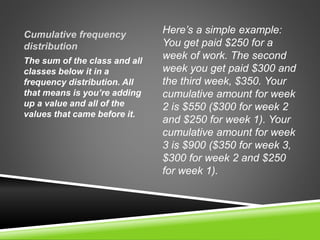
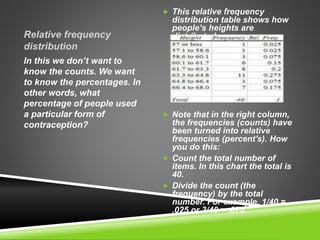
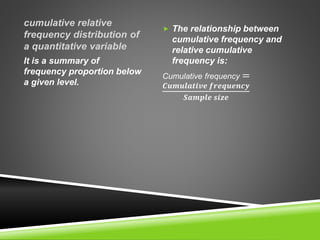
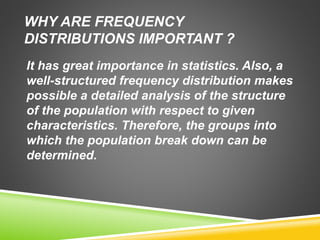
This document provides an introduction to data handling and various statistical concepts. It defines different types of data like raw data, discrete data and continuous data. It then discusses frequency and different types of frequency distributions like grouped, ungrouped, cumulative, relative and relative cumulative distributions. It also explains concepts related to probability, chance and the probability formula. Finally, it covers topics like arithmetic mean, median and mode and provides examples to illustrate these statistical concepts.
Please Subscribe to this Channel for more solutions and lectures
http://www.youtube.com/onlineteaching
Chapter 2: Exploring Data with Tables and Graphs
2.1: Frequency Distributions for Organizing and Summarizing Data
35880 Topic Discussion7Number of Pages 1 (Double Spaced).docxdomenicacullison
35880 Topic: Discussion7
Number of Pages: 1 (Double Spaced)
Number of sources: 1
Writing Style: APA
Type of document: Essay
Academic Level:Master
Category: Psychology
Language Style: English (U.S.)
Order Instructions: Attached
I will attach the instruction
Please follow them carefully
Discussion3: Please discuss, elaborate and give example on the topic below. Please use only the reference I attach. Please be careful with grammar and spelling. No running head please.
Author: Jackson, S.L. (2017). Statistics Plain and Simple (4th ed.): Cengage Learning
Topic:
You find out that the average 10th grade math score, for Section 6 of the local high school, is 87 for the 25 students in the class. The average test score for all 10th grade math students across the state is 85 for 1,800 students. The standard deviation for the state is 3.8.
Answer the following questions:
· What z score do you calculate?
· What is the area between the mean and the z score found in Appendix A of the textbook?
· What does this mean about the probability of this test score difference occurring by chance? Is it
less than 0.05?
Reference
Module 9: The Single-Sample z Test
The z Test: What It Is and What It Does
The Sampling Distribution
The Standard Error of the Mean
Calculations for the One-Tailed z Test
Interpreting the One-Tailed z Test
Calculations for the Two-Tailed z Test
Interpreting the Two-Tailed z Test
Statistical Power
Assumptions and Appropriate Use of the z Test
Confidence Intervals Based on the z Distribution
Review of Key Terms
Module Exercises
Critical Thinking Check Answers
Module 10: The Single-Sample t Test
The t Test: What It Is and What It Does
Student's t Distribution
Calculations for the One-Tailed t Test
The Estimated Standard Error of the Mean
Interpreting the One-Tailed t Test
Calculations for the Two-Tailed t Test
Interpreting the Two-Tailed t Test
Assumptions and Appropriate Use of the Single-Sample t Test
Confidence Intervals Based on the t Distribution
Review of Key Terms
Module Exercises
Critical Thinking Check Answers
Chapter 5 Summary and Review
Chapter 5 Statistical Software Resources
In this chapter, we continue our discussion of inferential statistics—procedures for drawing conclusions about a population based on data collected from a sample. We will address two different statistical tests: the z test and t test. After reading this chapter, engaging in the Critical Thinking checks, and working through the problems at the end of each module and at the end of the chapter, you should understand the differences between the two tests covered in this chapter, when to use each test, how to use each to test a hypothesis, and the assumptions of each test.
MODULE 9
The Single-Sample z Test
Learning Objectives
•Explain what a z test is and what it does.
•Calculate a z test.
•Explain what statistical power is and how to make statistical tests more powerful.
•List the assumptions of the z test.
•Calculate confidence intervals usi.
Answer the questions in one paragraph 4-5 sentences. · Why did t.docxboyfieldhouse
Answer the questions in one paragraph 4-5 sentences.
· Why did the class collectively sign a blank check? Was this a wise decision; why or why not? we took a decision all the class without hesitation
· What is something that I said individuals should always do; what is it; why wasn't it done this time? Which mitigation strategies were used; what other strategies could have been used/considered? individuals should always participate in one group and take one decision
SAMPLING MEAN:
DEFINITION:
The term sampling mean is a statistical term used to describe the properties of statistical distributions. In statistical terms, the sample meanfrom a group of observations is an estimate of the population mean. Given a sample of size n, consider n independent random variables X1, X2... Xn, each corresponding to one randomly selected observation. Each of these variables has the distribution of the population, with mean and standard deviation. The sample mean is defined to be
WHAT IT IS USED FOR:
It is also used to measure central tendency of the numbers in a database. It can also be said that it is nothing more than a balance point between the number and the low numbers.
HOW TO CALCULATE IT:
To calculate this, just add up all the numbers, then divide by how many numbers there are.
Example: what is the mean of 2, 7, and 9?
Add the numbers: 2 + 7 + 9 = 18
Divide by how many numbers (i.e., we added 3 numbers): 18 ÷ 3 = 6
So the Mean is 6
SAMPLE VARIANCE:
DEFINITION:
The sample variance, s2, is used to calculate how varied a sample is. A sample is a select number of items taken from a population. For example, if you are measuring American people’s weights, it wouldn’t be feasible (from either a time or a monetary standpoint) for you to measure the weights of every person in the population. The solution is to take a sample of the population, say 1000 people, and use that sample size to estimate the actual weights of the whole population.
WHAT IT IS USED FOR:
The sample variance helps you to figure out the spread out in the data you have collected or are going to analyze. In statistical terminology, it can be defined as the average of the squared differences from the mean.
HOW TO CALCULATE IT:
Given below are steps of how a sample variance is calculated:
· Determine the mean
· Then for each number: subtract the Mean and square the result
· Then work out the mean of those squared differences.
To work out the mean, add up all the values then divide by the number of data points.
First add up all the values from the previous step.
But how do we say "add them all up" in mathematics? We use the Roman letter Sigma: Σ
The handy Sigma Notation says to sum up as many terms as we want.
· Next we need to divide by the number of data points, which is simply done by multiplying by "1/N":
Statistically it can be stated by the following:
·
· This value is the variance
EXAMPLE:
Sam has 20 Rose Bushes.
The number of flowers on each b.
F ProjHOSPITAL INPATIENT P & L20162017Variance Variance Per DC 20.docxmecklenburgstrelitzh
F ProjHOSPITAL INPATIENT P & L20162017Variance Variance %Per DC 2016Per DC 2017Total Number of Beds149149Maximum Occupancy55,74554,561Total Patient Days37,25037,926Actual Occupancy %ALOSDischarges by PayerMedicare/Medicaid4,9224,989Commercial Ins5,2415,099Private Pay/Bad Debt1,2801,162Total DischargesREVENUEGross Patient Revenue$ 161,325,872$ 135,365,715Contract Allowances, Uncollectables$ (84,696,083)$ (65,680,261) Net Patient RevenueMisc Income$ 378,530$ 303,233 NET REVENUEPatient Care Expenses Salaries $ 18,387,223$ 18,244,610Benefits $ 4,140,146$ 4,211,157Contract Labor $ 1,724,507$ 1,820,377Physician Contract Services$ 6,439,165$ 6,335,188Lab Services $ 1,589,648$ 1,575,808Radiology Services$ 2,336,043$ 2,343,920Rehabilitation Services$ 655,766$ 679,444General Supplies $ 653,941$ 689,766Medical Supplies $ 1,006,220$ 1,029,151Cost of Food $ 576,245$ 612,890Patient Transportation $ 35,324$ 36,031Total Patient Care ExpensesGeneral and Administrative ExpensesSalaries$ 8,450,134$ 8,629,126Benefits$ 2,001,199$ 1,993,174Contract Labor$ 157,925$ 161,015Purchased Services $ 1,285,925$ 1,355,602Medical Director $ 162,909$ 167,207Telephone$ 586,985$ 596,466Meals & Entertainment $ 254,517$ 289,185Travel$ 126,951$ 141,561General Supplies $ 332,069$ 337,874Postage$ 53,760$ 57,383Building Expense$ 2,685,376$ 2,950,379Equipment Rents $ 363,302$ 429,694Repairs and Maintenance $ 337,711$ 366,311Insurance$ 644,384$ 715,563Utilities $ 504,959$ 556,226Total General and Administrative ExpensesNet Operating Expenses NET PROFIT (LOSS) before Interest, Taxes and Depreciation (EBITDA)NET PROFIT (LOSS) %2017CASH FLOW 2016RELEVANT FINANCIAL RATIOS 2016What is your average Daily Revenue?Return on Assets (ROA)Return on Assets (ROA)Assume your AR Days are 55, what is your Total AR?Return on Equity (ROE)Return on Equity (ROE)What is your Average Daily Expense?Current RatioCurrent RatioAssume your AP Days are 35, what is your total AP?Debt RatioDebt RatioBALANCE SHEET 2016ASSETS Cash and EquivalentsAssume 45 days of ExpensesAssume 45 days of Expenses Accounts Receivable$ - 0$ - 0 Inventory All SuppliesAssume 55 days of suppliesAssume 55 days of suppliesTotal Current AssetsFixed Assets:xxxxxxxxxxxxxxxxxxxxxxxxxxxx Bldg and Equipment$ 14,700,779$14,700,779Total AssetsLIABILITIES AND EQUITYCurrent Liabilitiesxxxxxxxxxxxxxxxxxxxxxxxxxxxx Accounts Payable$ - 0$0Long Term Debtxxxxxxxxxxxxxxxxxxxxxxxxxxxx Bldg and Equipment$ 8,149,152$8,149,152Total LiabilitiesEquityTotal Liabilities and EquityITEMSPOINT VALUEOccupany Calcs2Hospital Cols B & C3Variance (2014-2013) $ and %2PPD 2013 - 20142Cash flow 20142Balance Sheet Calculations5Relevant Financial Ratios4Sub-Total20
35879 Topic: Discussion6
Number of Pages: 1 (Double Spaced)
Number of sources: 1
Writing Style: APA
Type of document: Essay
Academic Level:Master
.
In this slide, variables types, probability theory behind the algorithms and its uses including distribution is explained. Also theorems like bayes theorem is also explained.
35881 DiscussionNumber of Pages 1 (Double Spaced)Number o.docxrhetttrevannion
35881 Discussion
Number of Pages: 1 (Double Spaced)
Number of sources: 1
Writing Style: APA
Type of document: Essay
Academic Level:Master
Category: Psychology
Language Style: English (U.S.)
Order Instructions: Attached
I will attach the instruction
Please follow them carefully
35876 Topic: Discussion3
Number of Pages: 1 (Double Spaced)
Number of sources: 1
Writing Style: APA
Type of document: Essay
Academic Level:Master
Category: Psychology
Language Style: English (U.S.)
Order Instructions: Attached
I will attach the instruction
Please follow them carefully
Discussion: Please discuss, elaborate and give example on the topic. Be careful with grammar and spelling. No running head please. Please Use only the reference I will attach as the professor will not be able to give grade.
Author: (Jackson, S. L. (2017). Statistics plain and simple. (4th ed.). Boston, MA: Cengage Learning.)
Topic
What level of measurement can be used for this test for the independent and dependent variables?
Reference:
Module 9: The Single-Sample z Test
The z Test: What It Is and What It Does
The Sampling Distribution
The Standard Error of the Mean
Calculations for the One-Tailed z Test
Interpreting the One-Tailed z Test
Calculations for the Two-Tailed z Test
Interpreting the Two-Tailed z Test
Statistical Power
Assumptions and Appropriate Use of the z Test
Confidence Intervals Based on the z Distribution
Review of Key Terms
Module Exercises
Critical Thinking Check Answers
Module 10: The Single-Sample t Test
The t Test: What It Is and What It Does
Student's t Distribution
Calculations for the One-Tailed t Test
The Estimated Standard Error of the Mean
Interpreting the One-Tailed t Test
Calculations for the Two-Tailed t Test
Interpreting the Two-Tailed t Test
Assumptions and Appropriate Use of the Single-Sample t Test
Confidence Intervals Based on the t Distribution
Review of Key Terms
Module Exercises
Critical Thinking Check Answers
Chapter 5 Summary and Review
Chapter 5 Statistical Software Resources
In this chapter, we continue our discussion of inferential statistics—procedures for drawing conclusions about a population based on data collected from a sample. We will address two different statistical tests: the z test and t test. After reading this chapter, engaging in the Critical Thinking checks, and working through the problems at the end of each module and at the end of the chapter, you should understand the differences between the two tests covered in this chapter, when to use each test, how to use each to test a hypothesis, and the assumptions of each test.
MODULE 9
The Single-Sample z Test
Learning Objectives
•Explain what a z test is and what it does.
•Calculate a z test.
•Explain what statistical power is and how to make statistical tests more powerful.
•List the assumptions of the z test.
•Calculate confidence intervals using the z distribution.
The z Test: What It Is and What It Does
The z test is a parametric statistical te.
A General Manger of Harley-Davidson has to decide on the size of a.docxevonnehoggarth79783
A General Manger of Harley-Davidson has to decide on the size of a new facility. The GM has narrowed the choices to two: large facility or small facility. The company has collected information on the payoffs. It now has to decide which option is the best using probability analysis, the decision tree model, and expected monetary value.
Options:
Facility
Demand Options
Probability
Actions
Expected Payoffs
Large
Low Demand
0.4
Do Nothing
($10)
Low Demand
0.4
Reduce Prices
$50
High Demand
0.6
$70
Small
Low Demand
0.4
$40
High Demand
0.6
Do Nothing
$40
High Demand
0.6
Overtime
$50
High Demand
0.6
Expand
$55
Determination of chance probability and respective payoffs:
Build Small:
Low Demand
0.4($40)=$16
High Demand
0.6($55)=$33
Build Large:
Low Demand
0.4($50)=$20
High Demand
0.6($70)=$42
Determination of Expected Value of each alternative
Build Small: $16+$33=$49
Build Large: $20+$42=$62
Click here for the Statistical Terms review sheet.
Submit your conclusion in a Word document to the M4: Assignment 2 Dropbox byWednesday, November 18, 2015.
A General Manger of Harley
-
Davidson has to decide on the size of a new facility. The GM has narrowed
the choices to two: large facility or small facility. The company has collected information on the payoffs. It
now has to decide which option is the best u
sing probability analysis, the decision tree model, and
expected monetary value.
Options:
Facility
Demand
Options
Probability
Actions
Expected
Payoffs
Large
Low Demand
0.4
Do Nothing
($10)
Low Demand
0.4
Reduce Prices
$50
High Demand
0.6
$70
Small
Low Demand
0.4
$40
High Demand
0.6
Do Nothing
$40
High Demand
0.6
Overtime
$50
High Demand
0.6
Expand
$55
A General Manger of Harley-Davidson has to decide on the size of a new facility. The GM has narrowed
the choices to two: large facility or small facility. The company has collected information on the payoffs. It
now has to decide which option is the best using probability analysis, the decision tree model, and
expected monetary value.
Options:
Facility
Demand
Options
Probability Actions
Expected
Payoffs
Large Low Demand 0.4 Do Nothing ($10)
Low Demand 0.4 Reduce Prices $50
High Demand 0.6
$70
Small Low Demand 0.4
$40
High Demand 0.6 Do Nothing $40
High Demand 0.6 Overtime $50
High Demand 0.6 Expand $55
SAMPLING MEAN:
DEFINITION:
The term sampling mean is a statistical term used to describe the properties of statistical distributions. In statistical terms, the sample meanfrom a group of observations is an estimate of the population mean. Given a sample of size n, consider n independent random variables X1, X2... Xn, each corresponding to one randomly selected observation. Each of these variables has the distribution of the population, with mean and standard deviation. The sample mean is defined to be
WHAT IT IS USED FOR:
It is also used to measure central tendency of the numbers in a .
BUS308 – Week 1 Lecture 2 Describing Data Expected Out.docxcurwenmichaela
BUS308 – Week 1 Lecture 2
Describing Data
Expected Outcomes
After reading this lecture, the student should be familiar with:
1. Basic descriptive statistics for data location
2. Basic descriptive statistics for data consistency
3. Basic descriptive statistics for data position
4. Basic approaches for describing likelihood
5. Difference between descriptive and inferential statistics
What this lecture covers
This lecture focuses on describing data and how these descriptions can be used in an
analysis. It also introduces and defines some specific descriptive statistical tools and results.
Even if we never become a data detective or do statistical tests, we will be exposed and
bombarded with statistics and statistical outcomes. We need to understand what they are telling
us and how they help uncover what the data means on the “crime,” AKA research question/issue.
How we obtain these results will be covered in lecture 1-3.
Detecting
In our favorite detective shows, starting out always seems difficult. They have a crime,
but no real clues or suspects, no idea of what happened, no “theory of the crime,” etc. Much as
we are at this point with our question on equal pay for equal work.
The process followed is remarkably similar across the different shows. First, a case or
situation presents itself. The heroes start by understanding the background of the situation and
those involved. They move on to collecting clues and following hints, some of which do not pan
out to be helpful. They then start to build relationships between and among clues and facts,
tossing out ideas that seemed good but lead to dead-ends or non-helpful insights (false leads,
etc.). Finally, a conclusion is reached and the initial question of “who done it” is solved.
Data analysis, and specifically statistical analysis, is done quite the same way as we will
see.
Descriptive Statistics
Week 1 Clues
We are interested in whether or not males and females are paid the same for doing equal
work. So, how do we go about answering this question? The “victim” in this question could be
considered the difference in pay between males and females, specifically when they are doing
equal work. An initial examination (Doc, was it murder or an accident?) involves obtaining
basic information to see if we even have cause to worry.
The first action in any analysis involves collecting the data. This generally involves
conducting a random sample from the population of employees so that we have a manageable
data set to operate from. In this case, our sample, presented in Lecture 1, gave us 25 males and
25 females spread throughout the company. A quick look at the sample by HR provided us with
assurance that the group looked representative of the company workforce we are concerned with
as a whole. Now we can confidently collect clues to see if we should be concerned or not.
As with any detective, the first issue is to understand the.
SAMPLING MEAN DEFINITION The term sampling mean is.docxagnesdcarey33086
SAMPLING MEAN:
DEFINITION:
The term sampling mean is a statistical term used to describe the properties of statistical
distributions. In statistical terms, the sample mean from a group of observations is an
estimate of the population mean . Given a sample of size n, consider n independent random
variables X1, X2... Xn, each corresponding to one randomly selected observation. Each of these
variables has the distribution of the population, with mean and standard deviation . The
sample mean is defined to be
WHAT IT IS USED FOR:
It is also used to measure central tendency of the numbers in a database. It can also be said that
it is nothing more than a balance point between the number and the low numbers.
HOW TO CALCULATE IT:
To calculate this, just add up all the numbers, then divide by how many numbers there are.
Example: what is the mean of 2, 7, and 9?
Add the numbers: 2 + 7 + 9 = 18
Divide by how many numbers (i.e., we added 3 numbers): 18 ÷ 3 = 6
So the Mean is 6
SAMPLE VARIANCE:
DEFINITION:
The sample variance, s2, is used to calculate how varied a sample is. A sample is a select number
of items taken from a population. For example, if you are measuring American people’s weights,
it wouldn’t be feasible (from either a time or a monetary standpoint) for you to measure the
weights of every person in the population. The solution is to take a sample of the population, say
1000 people, and use that sample size to estimate the actual weights of the whole population.
WHAT IT IS USED FOR:
The sample variance helps you to figure out the spread out in the data you have collected or are
going to analyze. In statistical terminology, it can be defined as the average of the squared
differences from the mean.
HOW TO CALCULATE IT:
Given below are steps of how a sample variance is calculated:
• Determine the mean
• Then for each number: subtract the Mean and square the result
• Then work out the mean of those squared differences.
To work out the mean, add up all the values then divide by the number of data points.
First add up all the values from the previous step.
But how do we say "add them all up" in mathematics? We use the Roman letter Sigma: Σ
The handy Sigma Notation says to sum up as many terms as we want.
• Next we need to divide by the number of data points, which is simply done by
multiplying by "1/N":
Statistically it can be stated by the following:
•
• This value is the variance
EXAMPLE:
Sam has 20 Rose Bushes.
The number of flowers on each bush is
9, 2, 5, 4, 12, 7, 8, 11, 9, 3, 7, 4, 12, 5, 4, 10, 9, 6, 9, 4
Work out the sample variance
Step 1. Work out the mean
In the formula above, µ (the Greek letter "mu") is the mean of all our values.
For this example, the data points are: 9, 2, 5, 4, 12, 7, 8, 11, 9, 3, 7, 4, 12, 5, 4, 10, 9, 6, 9, 4
The mean is:
(9+2+5+4+12+7+8+11+9+3+7+4+12+5+4+10+9+6+9+4) / 20 = 140/20 = 7
So:
µ.
SAMPLING MEANDEFINITIONThe term sampling mean is a stati.docxanhlodge
SAMPLING MEAN:
DEFINITION:
The term sampling mean is a statistical term used to describe the properties of statistical distributions. In statistical terms, the sample meanfrom a group of observations is an estimate of the population mean. Given a sample of size n, consider n independent random variables X1, X2... Xn, each corresponding to one randomly selected observation. Each of these variables has the distribution of the population, with mean and standard deviation. The sample mean is defined to be
WHAT IT IS USED FOR:
It is also used to measure central tendency of the numbers in a database. It can also be said that it is nothing more than a balance point between the number and the low numbers.
HOW TO CALCULATE IT:
To calculate this, just add up all the numbers, then divide by how many numbers there are.
Example: what is the mean of 2, 7, and 9?
Add the numbers: 2 + 7 + 9 = 18
Divide by how many numbers (i.e., we added 3 numbers): 18 ÷ 3 = 6
So the Mean is 6
SAMPLE VARIANCE:
DEFINITION:
The sample variance, s2, is used to calculate how varied a sample is. A sample is a select number of items taken from a population. For example, if you are measuring American people’s weights, it wouldn’t be feasible (from either a time or a monetary standpoint) for you to measure the weights of every person in the population. The solution is to take a sample of the population, say 1000 people, and use that sample size to estimate the actual weights of the whole population.
WHAT IT IS USED FOR:
The sample variance helps you to figure out the spread out in the data you have collected or are going to analyze. In statistical terminology, it can be defined as the average of the squared differences from the mean.
HOW TO CALCULATE IT:
Given below are steps of how a sample variance is calculated:
· Determine the mean
· Then for each number: subtract the Mean and square the result
· Then work out the mean of those squared differences.
To work out the mean, add up all the values then divide by the number of data points.
First add up all the values from the previous step.
But how do we say "add them all up" in mathematics? We use the Roman letter Sigma: Σ
The handy Sigma Notation says to sum up as many terms as we want.
· Next we need to divide by the number of data points, which is simply done by multiplying by "1/N":
Statistically it can be stated by the following:
·
· This value is the variance
EXAMPLE:
Sam has 20 Rose Bushes.
The number of flowers on each bush is
9, 2, 5, 4, 12, 7, 8, 11, 9, 3, 7, 4, 12, 5, 4, 10, 9, 6, 9, 4
Work out the sample variance
Step 1. Work out the mean
In the formula above, μ (the Greek letter "mu") is the mean of all our values.
For this example, the data points are: 9, 2, 5, 4, 12, 7, 8, 11, 9, 3, 7, 4, 12, 5, 4, 10, 9, 6, 9, 4
The mean is:
(9+2+5+4+12+7+8+11+9+3+7+4+12+5+4+10+9+6+9+4) / 20 = 140/20 = 7
So:
μ = 7
Step 2. Then for each number: subtract the Mean and square the result
This is t.
SAMPLING MEANDEFINITIONThe term sampling mean is a stati.docxagnesdcarey33086
SAMPLING MEAN:
DEFINITION:
The term sampling mean is a statistical term used to describe the properties of statistical distributions. In statistical terms, the sample meanfrom a group of observations is an estimate of the population mean. Given a sample of size n, consider n independent random variables X1, X2... Xn, each corresponding to one randomly selected observation. Each of these variables has the distribution of the population, with mean and standard deviation. The sample mean is defined to be
WHAT IT IS USED FOR:
It is also used to measure central tendency of the numbers in a database. It can also be said that it is nothing more than a balance point between the number and the low numbers.
HOW TO CALCULATE IT:
To calculate this, just add up all the numbers, then divide by how many numbers there are.
Example: what is the mean of 2, 7, and 9?
Add the numbers: 2 + 7 + 9 = 18
Divide by how many numbers (i.e., we added 3 numbers): 18 ÷ 3 = 6
So the Mean is 6
SAMPLE VARIANCE:
DEFINITION:
The sample variance, s2, is used to calculate how varied a sample is. A sample is a select number of items taken from a population. For example, if you are measuring American people’s weights, it wouldn’t be feasible (from either a time or a monetary standpoint) for you to measure the weights of every person in the population. The solution is to take a sample of the population, say 1000 people, and use that sample size to estimate the actual weights of the whole population.
WHAT IT IS USED FOR:
The sample variance helps you to figure out the spread out in the data you have collected or are going to analyze. In statistical terminology, it can be defined as the average of the squared differences from the mean.
HOW TO CALCULATE IT:
Given below are steps of how a sample variance is calculated:
· Determine the mean
· Then for each number: subtract the Mean and square the result
· Then work out the mean of those squared differences.
To work out the mean, add up all the values then divide by the number of data points.
First add up all the values from the previous step.
But how do we say "add them all up" in mathematics? We use the Roman letter Sigma: Σ
The handy Sigma Notation says to sum up as many terms as we want.
· Next we need to divide by the number of data points, which is simply done by multiplying by "1/N":
Statistically it can be stated by the following:
·
· This value is the variance
EXAMPLE:
Sam has 20 Rose Bushes.
The number of flowers on each bush is
9, 2, 5, 4, 12, 7, 8, 11, 9, 3, 7, 4, 12, 5, 4, 10, 9, 6, 9, 4
Work out the sample variance
Step 1. Work out the mean
In the formula above, μ (the Greek letter "mu") is the mean of all our values.
For this example, the data points are: 9, 2, 5, 4, 12, 7, 8, 11, 9, 3, 7, 4, 12, 5, 4, 10, 9, 6, 9, 4
The mean is:
(9+2+5+4+12+7+8+11+9+3+7+4+12+5+4+10+9+6+9+4) / 20 = 140/20 = 7
So:
μ = 7
Step 2. Then for each number: subtract the Mean and square the result
This is t.
35878 Topic Discussion5Number of Pages 1 (Double Spaced).docxrhetttrevannion
35878 Topic: Discussion5
Number of Pages: 1 (Double Spaced)
Number of sources: 1
Writing Style: APA
Type of document: Essay
Academic Level:Master
Category: Psychology
Language Style: English (U.S.)
Order Instructions: Attached
I will attach the instruction
Please follow them carefully
General Business Page 9
Unit 4
Due Wed 12/12
800-1,000 words / these will be turned into slides and added to your key assignment.
Study the following document: Methods for Managing Differences. Assume this communication strategy has been recommended by your employer for mediation when working with potential and existing business clients and partners.
Consider that there are basically two distinct types of cultures. One type is more cooperative, and the other is more competitive. It has been discovered that there are some conflicts occurring between some of the key players who need to come to agreement on specific critical areas of the deal for it to move forward. The top management would really like this deal to happen.
Imagine being in this situation, and create the scenario as you go through the process using the methods approach from above.
· Describe the steps you would take and any considerations along the way.
· How would you use the recommended method when working with individuals who exhibit a generally competitive culture?
· How would you use the recommended method when working with individuals who exhibit a generally cooperative culture?
· Would this cultural factor change the way you apply this method for managing differences? Why or why not? Explain.
Create Section 4 of your Key Assignment presentation: Global Negotiations. Refer to Unit 1 Discussion Board 2 for a description of this section. Submit a draft of your entire presentation for your instructor to review.
Discussion 2: Discuss, elaborate and give example on the topic below. Please use only the reference I attach. Please be careful with grammar and spelling. No running head Please.
Author: Jackson, S.L. (2017). Statistics Plain and Simple (4th ed.): Cengage Learning
Topic
Review this week’s course materials and learning activities, and reflect on your learning so far this week. Respond to one or more of the following prompts in one to two paragraphs:
1. Provide citation and reference to the material(s) you discuss. Describe what you found interesting regarding this topic, and why.
2. Describe how you will apply that learning in your daily life, including your work life.
3. Describe what may be unclear to you, and what you would like to learn.
Reference:
Module 9: The Single-Sample z Test
The z Test: What It Is and What It Does
The Sampling Distribution
The Standard Error of the Mean
Calculations for the One-Tailed z Test
Interpreting the One-Tailed z Test
Calculations for the Two-Tailed z Test
Interpreting the Two-Tailed z Test
Statistical Power
Assumptions and Appropriate Use of the z Test
Confidence Intervals Based on the z Distribution
Review of Key Term.
Read| The latest issue of The Challenger is here! We are thrilled to announce that our school paper has qualified for the NATIONAL SCHOOLS PRESS CONFERENCE (NSPC) 2024. Thank you for your unwavering support and trust. Dive into the stories that made us stand out!
Instructions for Submissions thorugh G- Classroom.pptxJheel Barad
This presentation provides a briefing on how to upload submissions and documents in Google Classroom. It was prepared as part of an orientation for new Sainik School in-service teacher trainees. As a training officer, my goal is to ensure that you are comfortable and proficient with this essential tool for managing assignments and fostering student engagement.
The French Revolution, which began in 1789, was a period of radical social and political upheaval in France. It marked the decline of absolute monarchies, the rise of secular and democratic republics, and the eventual rise of Napoleon Bonaparte. This revolutionary period is crucial in understanding the transition from feudalism to modernity in Europe.
For more information, visit-www.vavaclasses.com
We all have good and bad thoughts from time to time and situation to situation. We are bombarded daily with spiraling thoughts(both negative and positive) creating all-consuming feel , making us difficult to manage with associated suffering. Good thoughts are like our Mob Signal (Positive thought) amidst noise(negative thought) in the atmosphere. Negative thoughts like noise outweigh positive thoughts. These thoughts often create unwanted confusion, trouble, stress and frustration in our mind as well as chaos in our physical world. Negative thoughts are also known as “distorted thinking”.
2024.06.01 Introducing a competency framework for languag learning materials ...Sandy Millin
http://sandymillin.wordpress.com/iateflwebinar2024
Published classroom materials form the basis of syllabuses, drive teacher professional development, and have a potentially huge influence on learners, teachers and education systems. All teachers also create their own materials, whether a few sentences on a blackboard, a highly-structured fully-realised online course, or anything in between. Despite this, the knowledge and skills needed to create effective language learning materials are rarely part of teacher training, and are mostly learnt by trial and error.
Knowledge and skills frameworks, generally called competency frameworks, for ELT teachers, trainers and managers have existed for a few years now. However, until I created one for my MA dissertation, there wasn’t one drawing together what we need to know and do to be able to effectively produce language learning materials.
This webinar will introduce you to my framework, highlighting the key competencies I identified from my research. It will also show how anybody involved in language teaching (any language, not just English!), teacher training, managing schools or developing language learning materials can benefit from using the framework.
This is a presentation by Dada Robert in a Your Skill Boost masterclass organised by the Excellence Foundation for South Sudan (EFSS) on Saturday, the 25th and Sunday, the 26th of May 2024.
He discussed the concept of quality improvement, emphasizing its applicability to various aspects of life, including personal, project, and program improvements. He defined quality as doing the right thing at the right time in the right way to achieve the best possible results and discussed the concept of the "gap" between what we know and what we do, and how this gap represents the areas we need to improve. He explained the scientific approach to quality improvement, which involves systematic performance analysis, testing and learning, and implementing change ideas. He also highlighted the importance of client focus and a team approach to quality improvement.
How to Make a Field invisible in Odoo 17Celine George
It is possible to hide or invisible some fields in odoo. Commonly using “invisible” attribute in the field definition to invisible the fields. This slide will show how to make a field invisible in odoo 17.
How to Split Bills in the Odoo 17 POS ModuleCeline George
Bills have a main role in point of sale procedure. It will help to track sales, handling payments and giving receipts to customers. Bill splitting also has an important role in POS. For example, If some friends come together for dinner and if they want to divide the bill then it is possible by POS bill splitting. This slide will show how to split bills in odoo 17 POS.
Operation “Blue Star” is the only event in the history of Independent India where the state went into war with its own people. Even after about 40 years it is not clear if it was culmination of states anger over people of the region, a political game of power or start of dictatorial chapter in the democratic setup.
The people of Punjab felt alienated from main stream due to denial of their just demands during a long democratic struggle since independence. As it happen all over the word, it led to militant struggle with great loss of lives of military, police and civilian personnel. Killing of Indira Gandhi and massacre of innocent Sikhs in Delhi and other India cities was also associated with this movement.
Students, digital devices and success - Andreas Schleicher - 27 May 2024..pptxEduSkills OECD
Andreas Schleicher presents at the OECD webinar ‘Digital devices in schools: detrimental distraction or secret to success?’ on 27 May 2024. The presentation was based on findings from PISA 2022 results and the webinar helped launch the PISA in Focus ‘Managing screen time: How to protect and equip students against distraction’ https://www.oecd-ilibrary.org/education/managing-screen-time_7c225af4-en and the OECD Education Policy Perspective ‘Students, digital devices and success’ can be found here - https://oe.cd/il/5yV
Ethnobotany and Ethnopharmacology:
Ethnobotany in herbal drug evaluation,
Impact of Ethnobotany in traditional medicine,
New development in herbals,
Bio-prospecting tools for drug discovery,
Role of Ethnopharmacology in drug evaluation,
Reverse Pharmacology.
2. INTRODUCTION
Our life is surrounded by numbers. Marks
you scored, runs you made, your height, your
weight. All these numbers are nothing but
data. Here we will learn what is data and how
to organise and represent this data in forms
of graphs and charts. We will also come
across the concept of probability. Let us get
started.
3. DATA AND IT’S TYPES
First is raw data which is an initial collection of
information. This information has not yet been
organized.
second type of data is Discrete data which is recorded in
whole numbers, like the number of children in a school or
number of tigers in a zoo. It cannot be in decimals
or fractions.
the third type is Continuous data. Continuous data need not be in
whole numbers, it can be in decimals. Examples are the
temperature in a city for a week, your percentage of marks for the
last exam etc.
Any bit of information that is expressed in a value or
numerical number is data. For example, the marks you
scored.
4. FREQUENCY AND IT’S TYPES
The frequency of any value is the number of times that value
appears in a data set.
To understand it we will first take an example:-
We go around and ask a group of five friends their favourite
colour. The answers are Blue, Green, Blue, Red, and Red. So
from the above examples of colours, we can say two children
like the colour blue, so its frequency is two. So to make
meaning of the raw data, we must organize. And finding out the
frequency of the data values is how this organisation is done.
5. FREQUENCY DISTRIBUTION
Many times it is not easy or feasible to find the frequency of data
from a very large dataset. So to make sense of the data we make a
frequency table and graphs. Let us take the example of the heights
of ten students in centimetres they are 139, 145, 150, 145, 136, 150,
152, 144, 138, 138
This frequency table will help us make better sense of the data
given
6. TYPES OF FRQUENCY DISTRIBUTIONS
There 5 types of Frequency distributions which is :
Grouped frequency distribution.
Ungrouped frequency distribution.
Cumulative frequency distribution.
Relative frequency distribution.
Relative cumulative frequency distribution.
7. GROUPED FREQUENCY:
These are the numbers of
newspapers sold at a local shop
over the last 10 days: 22, 20, 18, 23,
20, 25, 22, 20, 18, 20 Let us count
how many of each number there is:
Papers Sold Frequency
18 2
19 0
20 4
21 0
22 2
23 1
24 0
25 1
It is also possible to group the
values. Here they are grouped in 5s:
Papers Sold Frequency
15-19 2
20-24 7
25-29 1
Grouped frequency is the
frequency where several numbers
are grouped together. Grouped
frequency distribution helps to
organize the data more clearly. It
is more useful when the scores
have multiple values.
8. Ungrouped frequency
Let the test scores of all 20 students be
as follows:
23, 26, 11, 18, 09, 21, 23, 30, 22, 11, 21,
20, 11, 13, 23, 11, 29, 25, 26, 26
Marks obtained in the test No. of
students (Frequency)
09 1
11 4
13 1
18 1
20 1
21 2
22 1
23 3
25 1
26 3
29 1
30 1
Total 20
It is just the opposite of grouped
frequency.
9. Cumulative frequency
distribution
Here’s a simple example:
You get paid $250 for a
week of work. The second
week you get paid $300 and
the third week, $350. Your
cumulative amount for week
2 is $550 ($300 for week 2
and $250 for week 1). Your
cumulative amount for week
3 is $900 ($350 for week 3,
$300 for week 2 and $250
for week 1).
The sum of the class and all
classes below it in a
frequency distribution. All
that means is you’re adding
up a value and all of the
values that came before it.
10. Relative frequency
distribution
This relative frequency
distribution table shows how
people’s heights are
distributed.
Note that in the right column,
the frequencies (counts) have
been turned into relative
frequencies (percent's). How
you do this:
Count the total number of
items. In this chart the total is
40.
Divide the count (the
frequency) by the total
number. For example, 1/40 =
.025 or 3/40 = .075.
In this we don’t want to
know the counts. We want
to know the percentages. In
other words, what
percentage of people used
a particular form of
contraception?
11. cumulative relative
frequency distribution of
a quantitative variable
The relationship between
cumulative frequency and
relative cumulative
frequency is:
Cumulative frequency =
𝑪𝒖𝒎𝒖𝒍𝒂𝒕𝒊𝒗𝒆 𝒇𝒓𝒆𝒒𝒖𝒆𝒏𝒄𝒚
𝑺𝒂𝒎𝒑𝒍𝒆 𝒔𝒊𝒛𝒆
It is a summary of
frequency proportion below
a given level.
12. WHY ARE FREQUENCY
DISTRIBUTIONS IMPORTANT ?
It has great importance in statistics. Also, a
well-structured frequency distribution makes
possible a detailed analysis of the structure
of the population with respect to given
characteristics. Therefore, the groups into
which the population break down can be
determined.
13. Chance and probability
Let us explain both these
concepts with an example.
You have gathered your
friends to come and play a
friendly board game. It is your
turn to roll the dice. You really
need a six to win the whole
game. Is there any way
to guarantee that you will roll
a six? Of course, there isn’t.
What are the chances you will
roll a six? Well if you apply the
basic logic you will realize you
have a one in six chance of
rolling a six.
Do you ever leave anything to
‘chance’? Like perhaps leave out a
chapter from your revision
because it ‘probably’ won’t come
in an exam? These terms ‘chance’
and ‘probability‘ can actually be
expressed in mathematical terms.
Come let us take a closer look at
probability and the probability
formula.
14. AN EXAMPLE
You have gathered your friends to come and play a friendly
board game. It is your turn to roll the dice. You really need a six
to win the whole game. Is there any way to guarantee that you
will roll a six? Of course, there isn’t. What are the chances you
will roll a six?
Well if you apply the basic logic you will realize you have a one
in six chance of rolling a six.
Now based on the above example let us look at some concepts
of probability. Probability can simply be said to be the chance
of something happening, or not happening. So the chance of
an occurrence of a somewhat likely event is what we call
probability. In the example given above the chance of rolling a
six was one is six. That was its probability.
15. CONCEPT RELATED TO
PROBABILITY
First is Random experiment
Second is Sample space
Third is an Event
Fourth is Equally likely Events
Fifth is Occurrence of an Event
16. RANDOM EXPERIMENT
A process which results in some well-defined
outcome is known as an experiment. Here you
rolling the dice was the random experiment, since
the outcome was not sure. The outcome here is 1, 2,
3, 4, 5, or 6. It cannot be predicted in advance,
making the rolling of dice a random experiment.
17. SAMPLE SPACE
Let us now change our example. Say you are now tossing an
ordinary coin. Every time you toss it either land on heads or on
tails. Every time the coin gets tossed there is a 50% chance of
heads and 50% chance of tails. Both events are equally likely,
i.e. they have an equal chance of happening. This is what we
call Equally likely events.
A particular event will be said to occur if this event E is a part
of the Sample space S, and such an event E actually happens.
So in the above experiment, if you actually roll a six, the event
will have occurred. A particular event will be said to occur if
this event E is a part of the Sample space S, and such an event
E actually happens. So in the above experiment, if you actually
roll a six, the event will have occurred.
18. THE FORMULA
Now that we have seen the concepts related to probability, let
us see how it is actually calculated. To see what are the
chances that an event will occur is what probability is. Now it is
important to remember that we can only
calculate mathematical probability of a random experiment. The
equation of probability is as follows:
P = Number of desirable events ÷ Total number of outcomes
Using this formula let us calculate the probability of the above
example. Here the desirable event is that your dice lands on a
six, so there is only one desirable event. And the
total number of possible results, i.e. the sample space, is six.
So we can calculate the probability, using the probability
formula as, P = 1/6
19. Arithmetic mean
In general language arithmetic
mean is same as the average
of data. It is the
representative value of the
group of data. Suppose we are
given ‘ n ‘ number of data and
we need to compute the
arithmetic mean, all that we
need to do is just sum up all
the numbers and divide it by
the total numbers. Let us
understand this with an
Suppose the principal of your
school asks your class teacher
that how was the score of your
class this time? What do you
think is the teacher going to do?
Do you think that the teacher is
going to actually read out the
individual score of all the
students? NO!!! What the teacher
does is, the teacher will tell the
average score of the class
instead of saying the individual
score. So the principal gets an
idea regarding the performance
of the students.
20. FORMULA TO CALCULATE MEDIAN
There are two sisters, with different heights. The height of the
younger sister is 128 cm and height of the elder sister us
150cm. So what if you want to know the average height of the
two sisters? What if you are asked to find out the mean of the
heights? As their total height is divided into two equal parts,
So 139 cm is the average height of the sisters. Here 150 > 139
> 128. Also, the average value also lies in between the
minimum value and the maximum value.
Formula for Arithmetic Mean
Mean =Sum of all observations
Number of observations
21. Median and mode The median number varies
according to the total
number being odd or even.
Initially let us assume the
number as the odd number.
Now if we have numbers like
12, 15, 21, 27, 35. So here we
can say that the midpoint
here is 21,
The number of students in your
classroom, the money of money your
parents earns, are all important numbers.
But how can you get the information of
the number of students in your school .
This is where median and mode comes is
useful. So let us now study median and
mode in detail. To define the median in
one sentence we can say that the median
gives us the midpoint of the data. What do
you mean by the midpoint? Suppose you
have ‘ n ‘ number of data, then arrange
these numbers in ascending or
descending order. Just pick the midpoint
from the particular series. The very first
thing to be done with raw data is to
arrange them in ascending or descending
order. In Layman’s terms:
Median = the middle number