Downloaded 31 times


![26
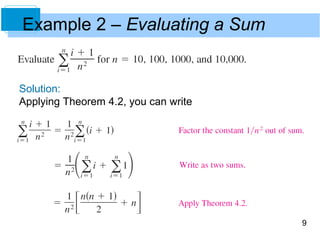
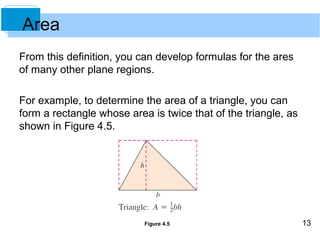
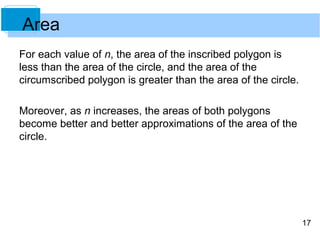
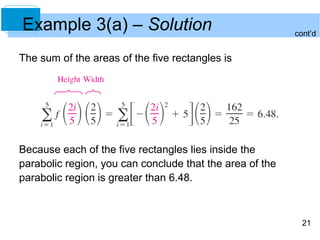
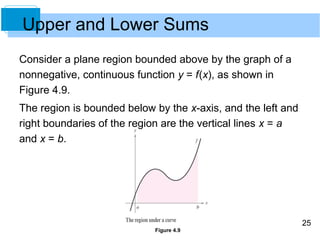
To approximate the area of the region, begin by subdividing
the interval [a, b] into n subintervals, each of width
as shown in Figure 4.10.
Figure 4.10
Upper and Lower Sums](https://image.slidesharecdn.com/larcalc10ch04sec2-140831021804-phpapp02/85/Lar-calc10-ch04_sec2-26-320.jpg)
![31
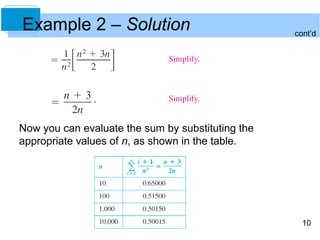
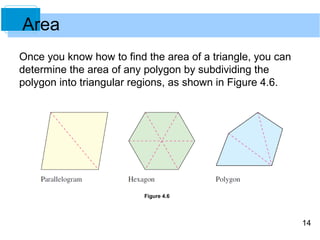
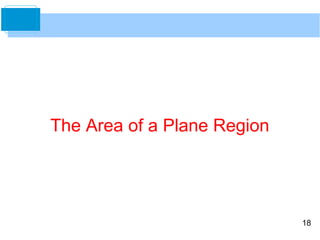
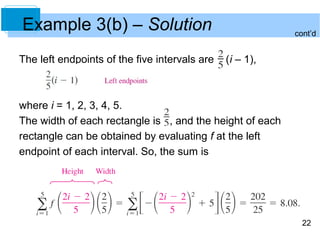
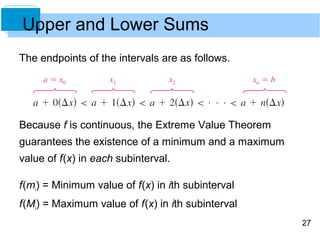
Example 4 – Finding Upper and Lower Sums for a Region
Find the upper and lower sums for the region bounded by
the graph of f(x) = x2 and the x-axis between x = 0 and
x = 2
Solution:
To begin, partition the interval [0, 2] into n subintervals,
each of width](https://image.slidesharecdn.com/larcalc10ch04sec2-140831021804-phpapp02/85/Lar-calc10-ch04_sec2-31-320.jpg)
![33
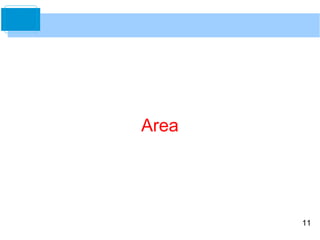
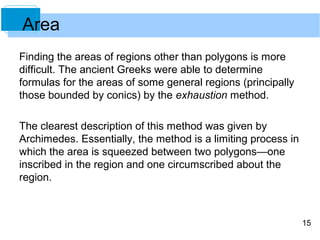
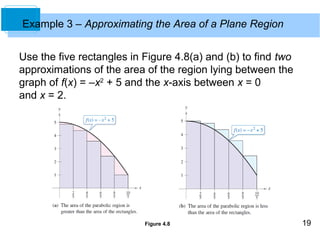
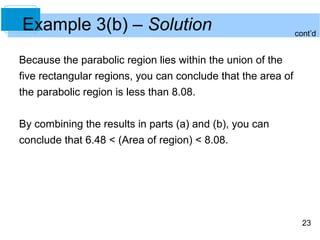
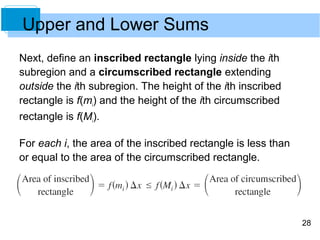
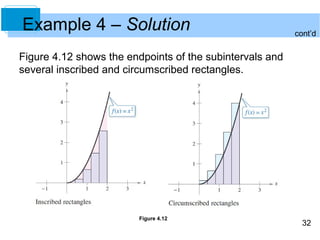
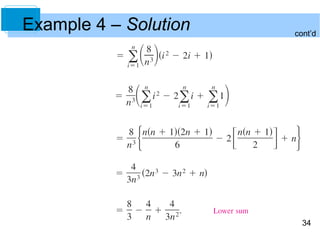
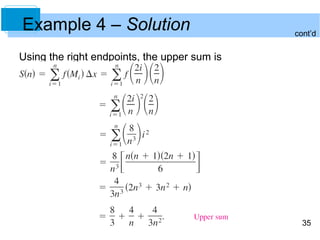
Example 4 – Solution
Because f is increasing on the interval [0, 2], the minimum
value on each subinterval occurs at the left endpoint, and
the maximum value occurs at the right endpoint.
Using the left endpoints, the lower sum is
cont’d](https://image.slidesharecdn.com/larcalc10ch04sec2-140831021804-phpapp02/85/Lar-calc10-ch04_sec2-33-320.jpg)
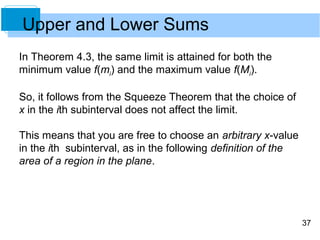
![36
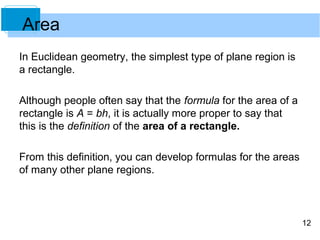
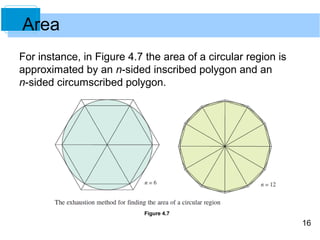
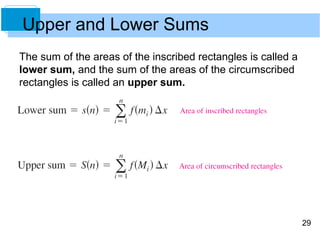
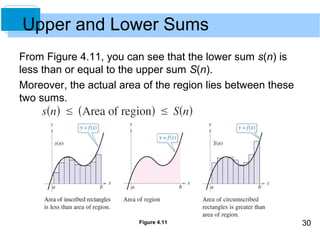
Upper and Lower Sums
The next theorem shows that the equivalence of the limits (as
n ∞) of the upper and lower sums is not mere coincidence.
It is true for all functions that are continuous and nonnegative
on the closed interval [a, b].](https://image.slidesharecdn.com/larcalc10ch04sec2-140831021804-phpapp02/85/Lar-calc10-ch04_sec2-36-320.jpg)
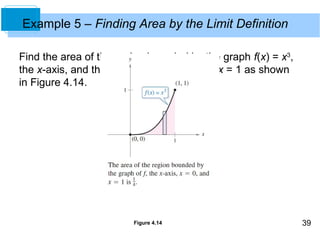
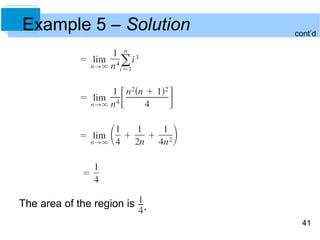
![40
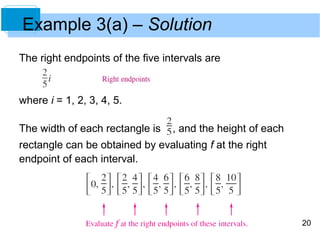
Example 5 – Solution
Begin by noting that f is continuous and nonnegative on the
interval [0, 1]. Next, partition the interval [0, 1] into
n subintervals, each of width Δx = 1/n.
According to the definition of area, you can choose any
x-value in the ith subinterval.
For this example, the right endpoints ci = i/n are convenient.](https://image.slidesharecdn.com/larcalc10ch04sec2-140831021804-phpapp02/85/Lar-calc10-ch04_sec2-40-320.jpg)

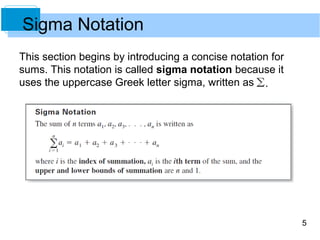
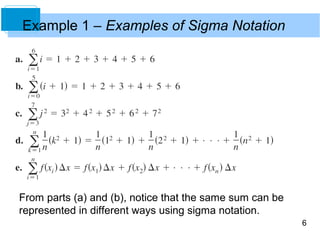
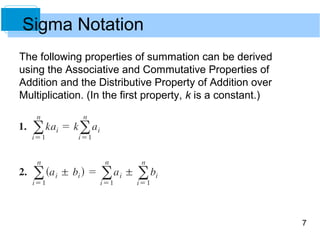
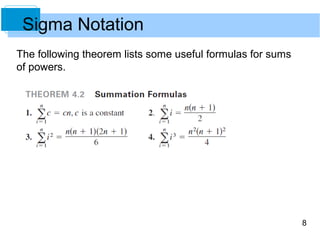
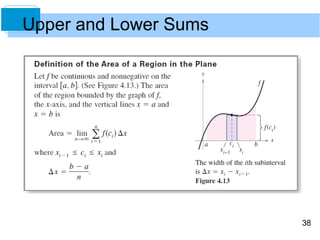
The document discusses methods for approximating and calculating the area of plane regions. It introduces sigma notation for writing sums and explores using rectangles to approximate the area of a region bounded by a graph and the x-axis. Upper and lower sums are defined by using maximum and minimum heights of a function over subintervals, and the area is defined as the limit of the Riemann sums as the subintervals approach zero width. Examples demonstrate finding upper and lower sums and calculating the exact area of a region using limits.