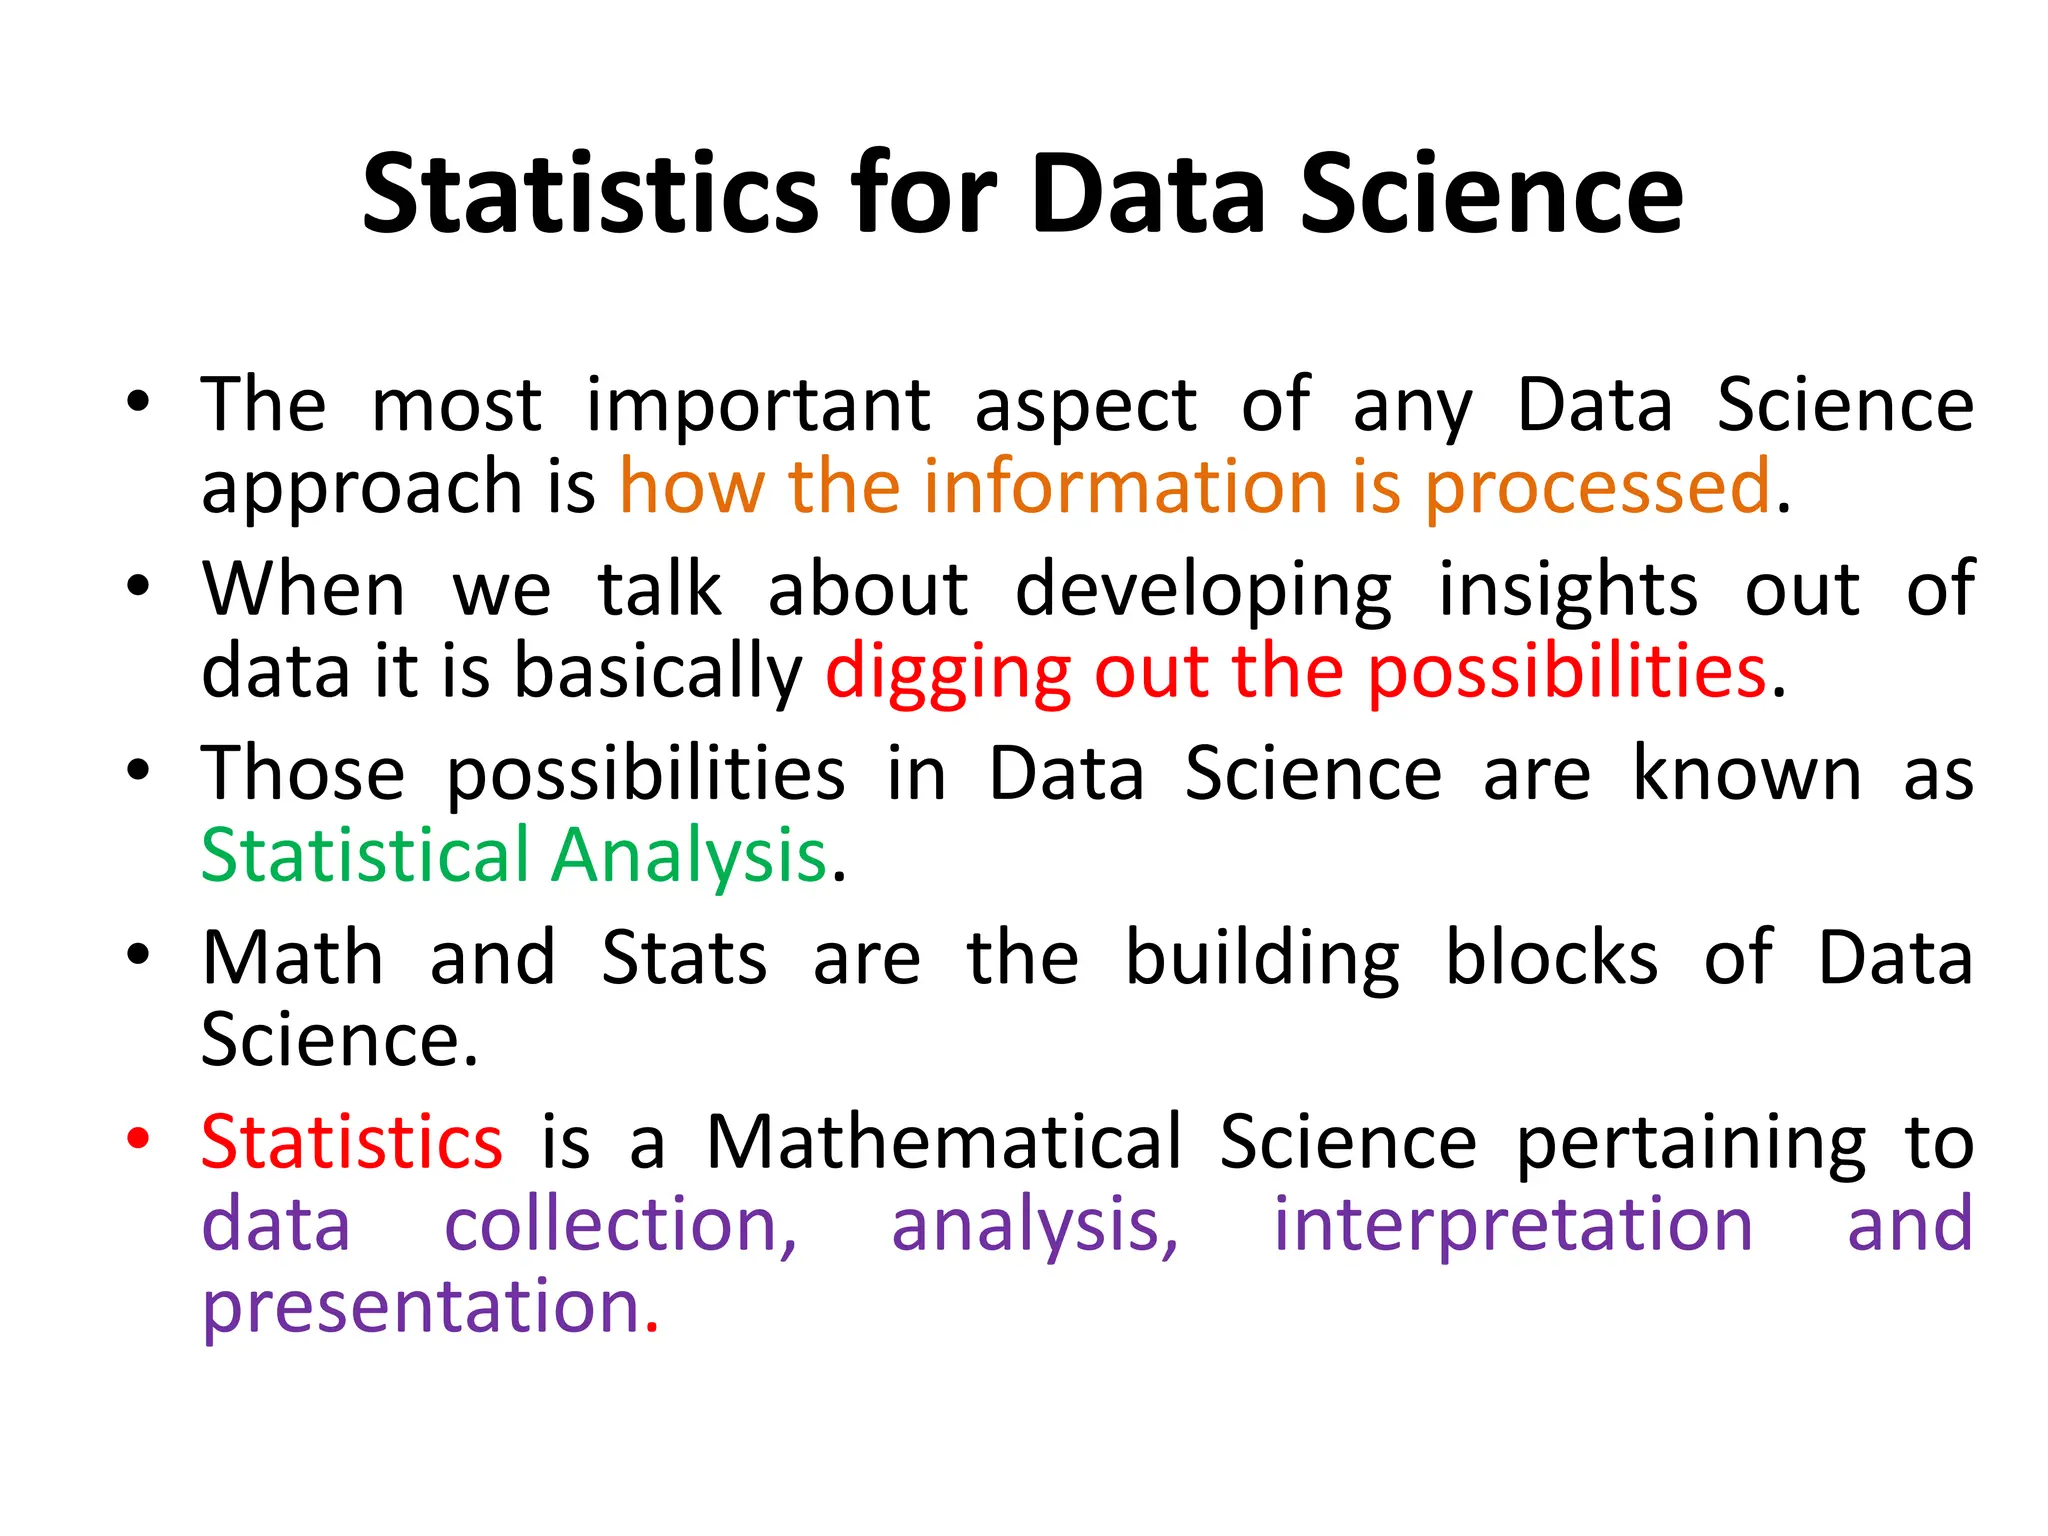
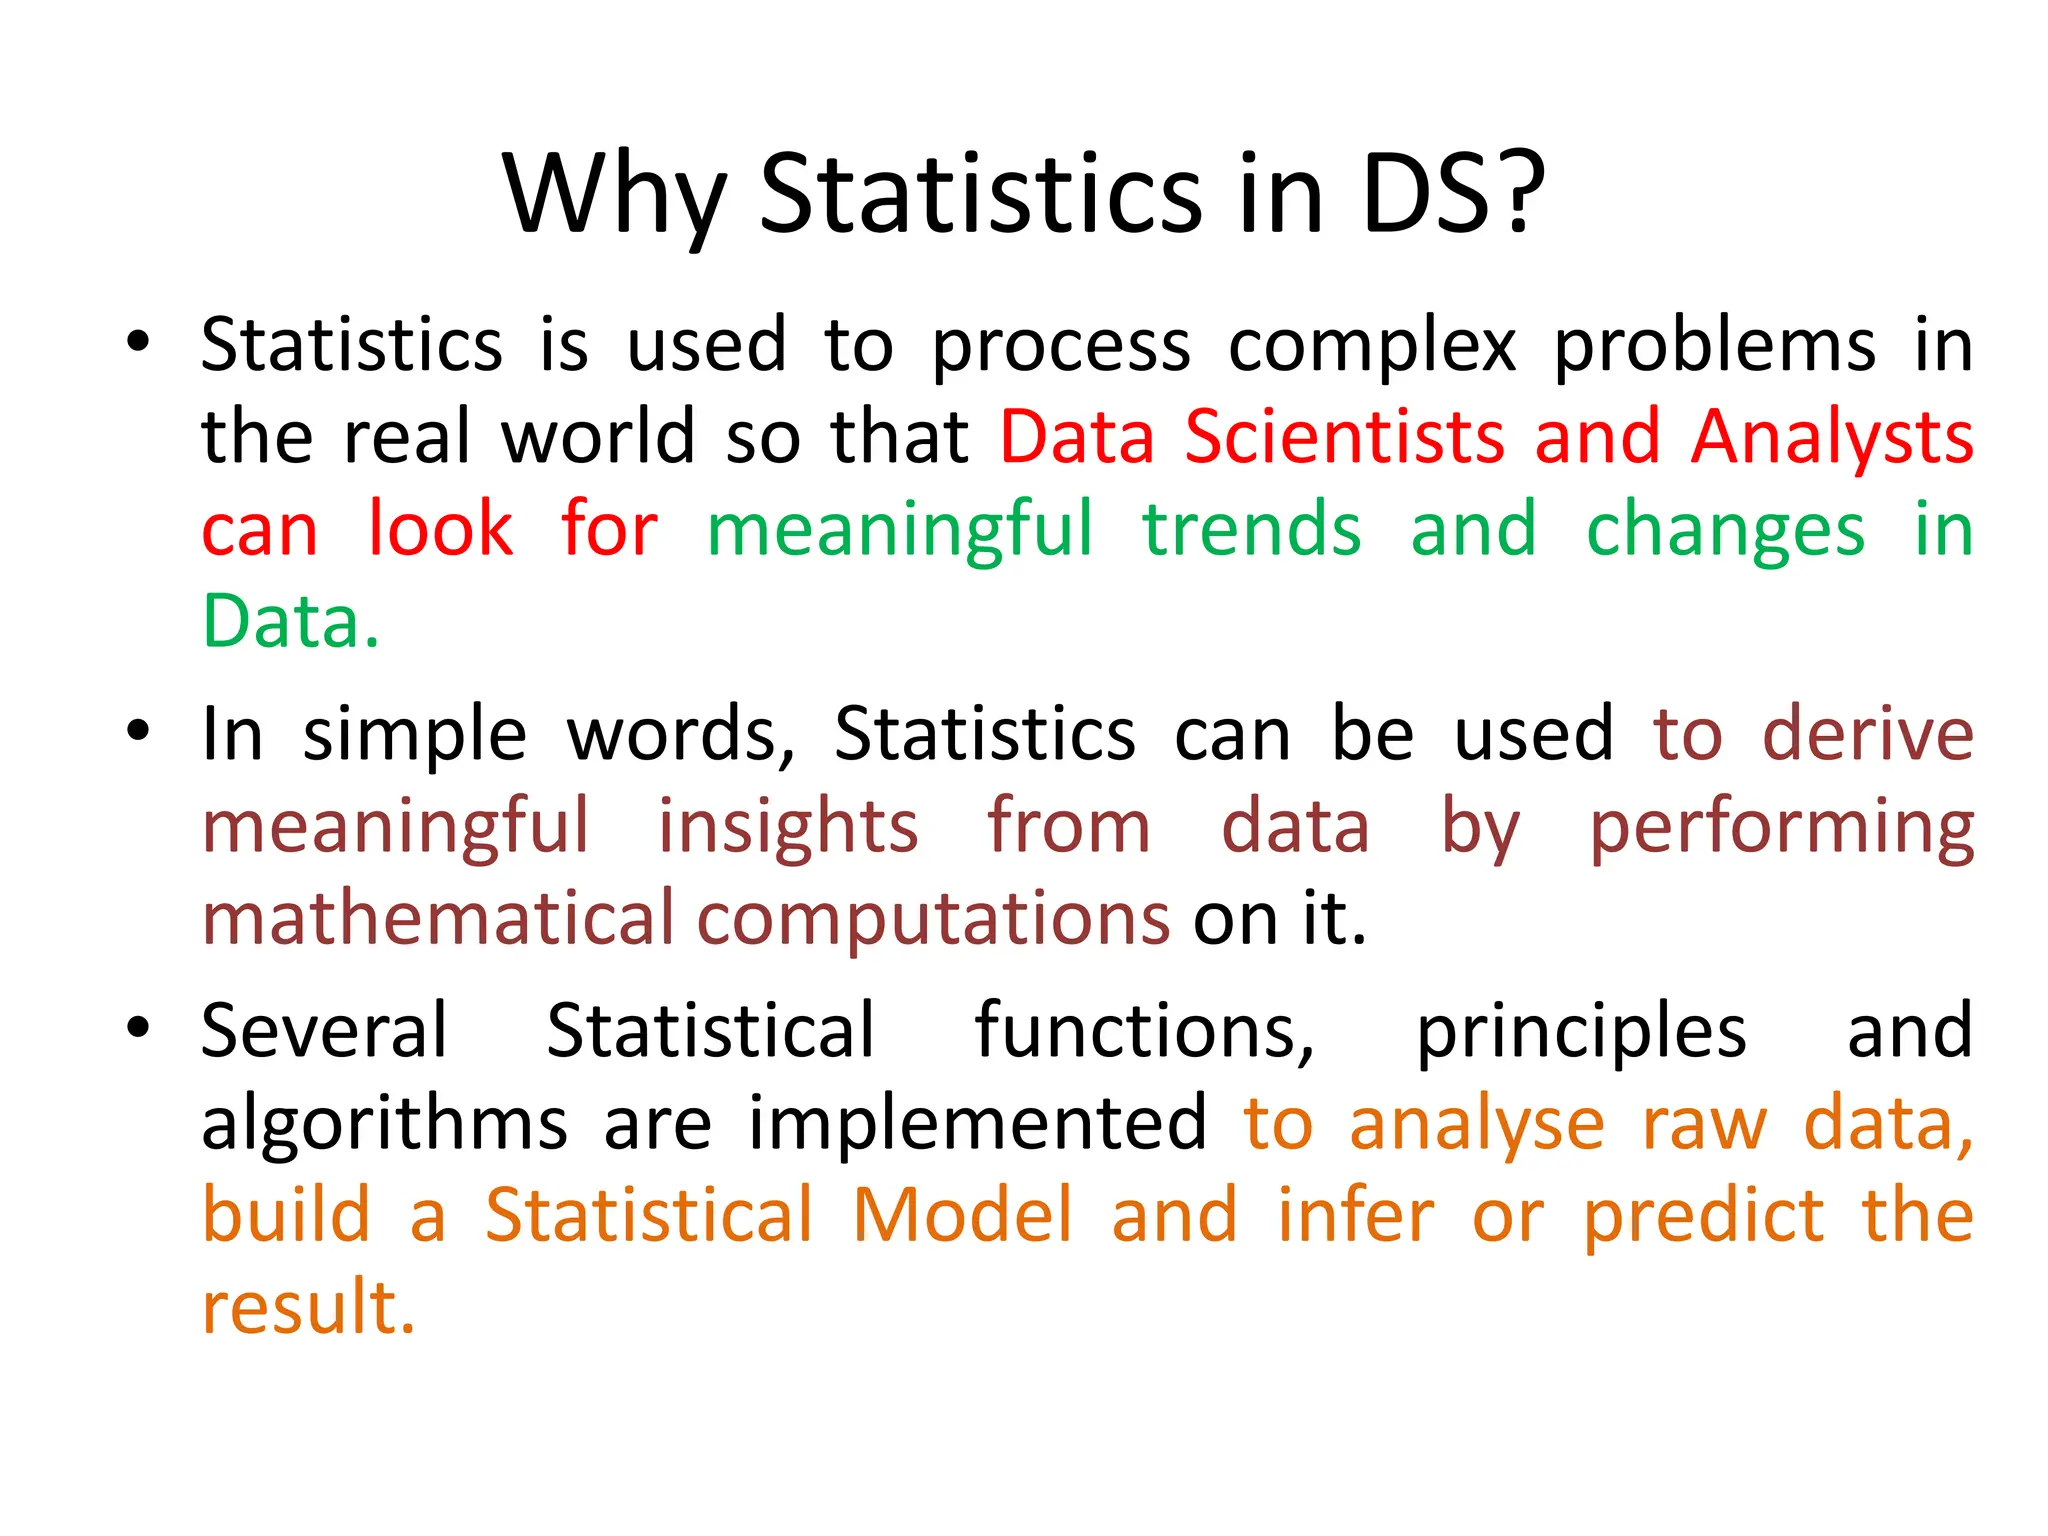
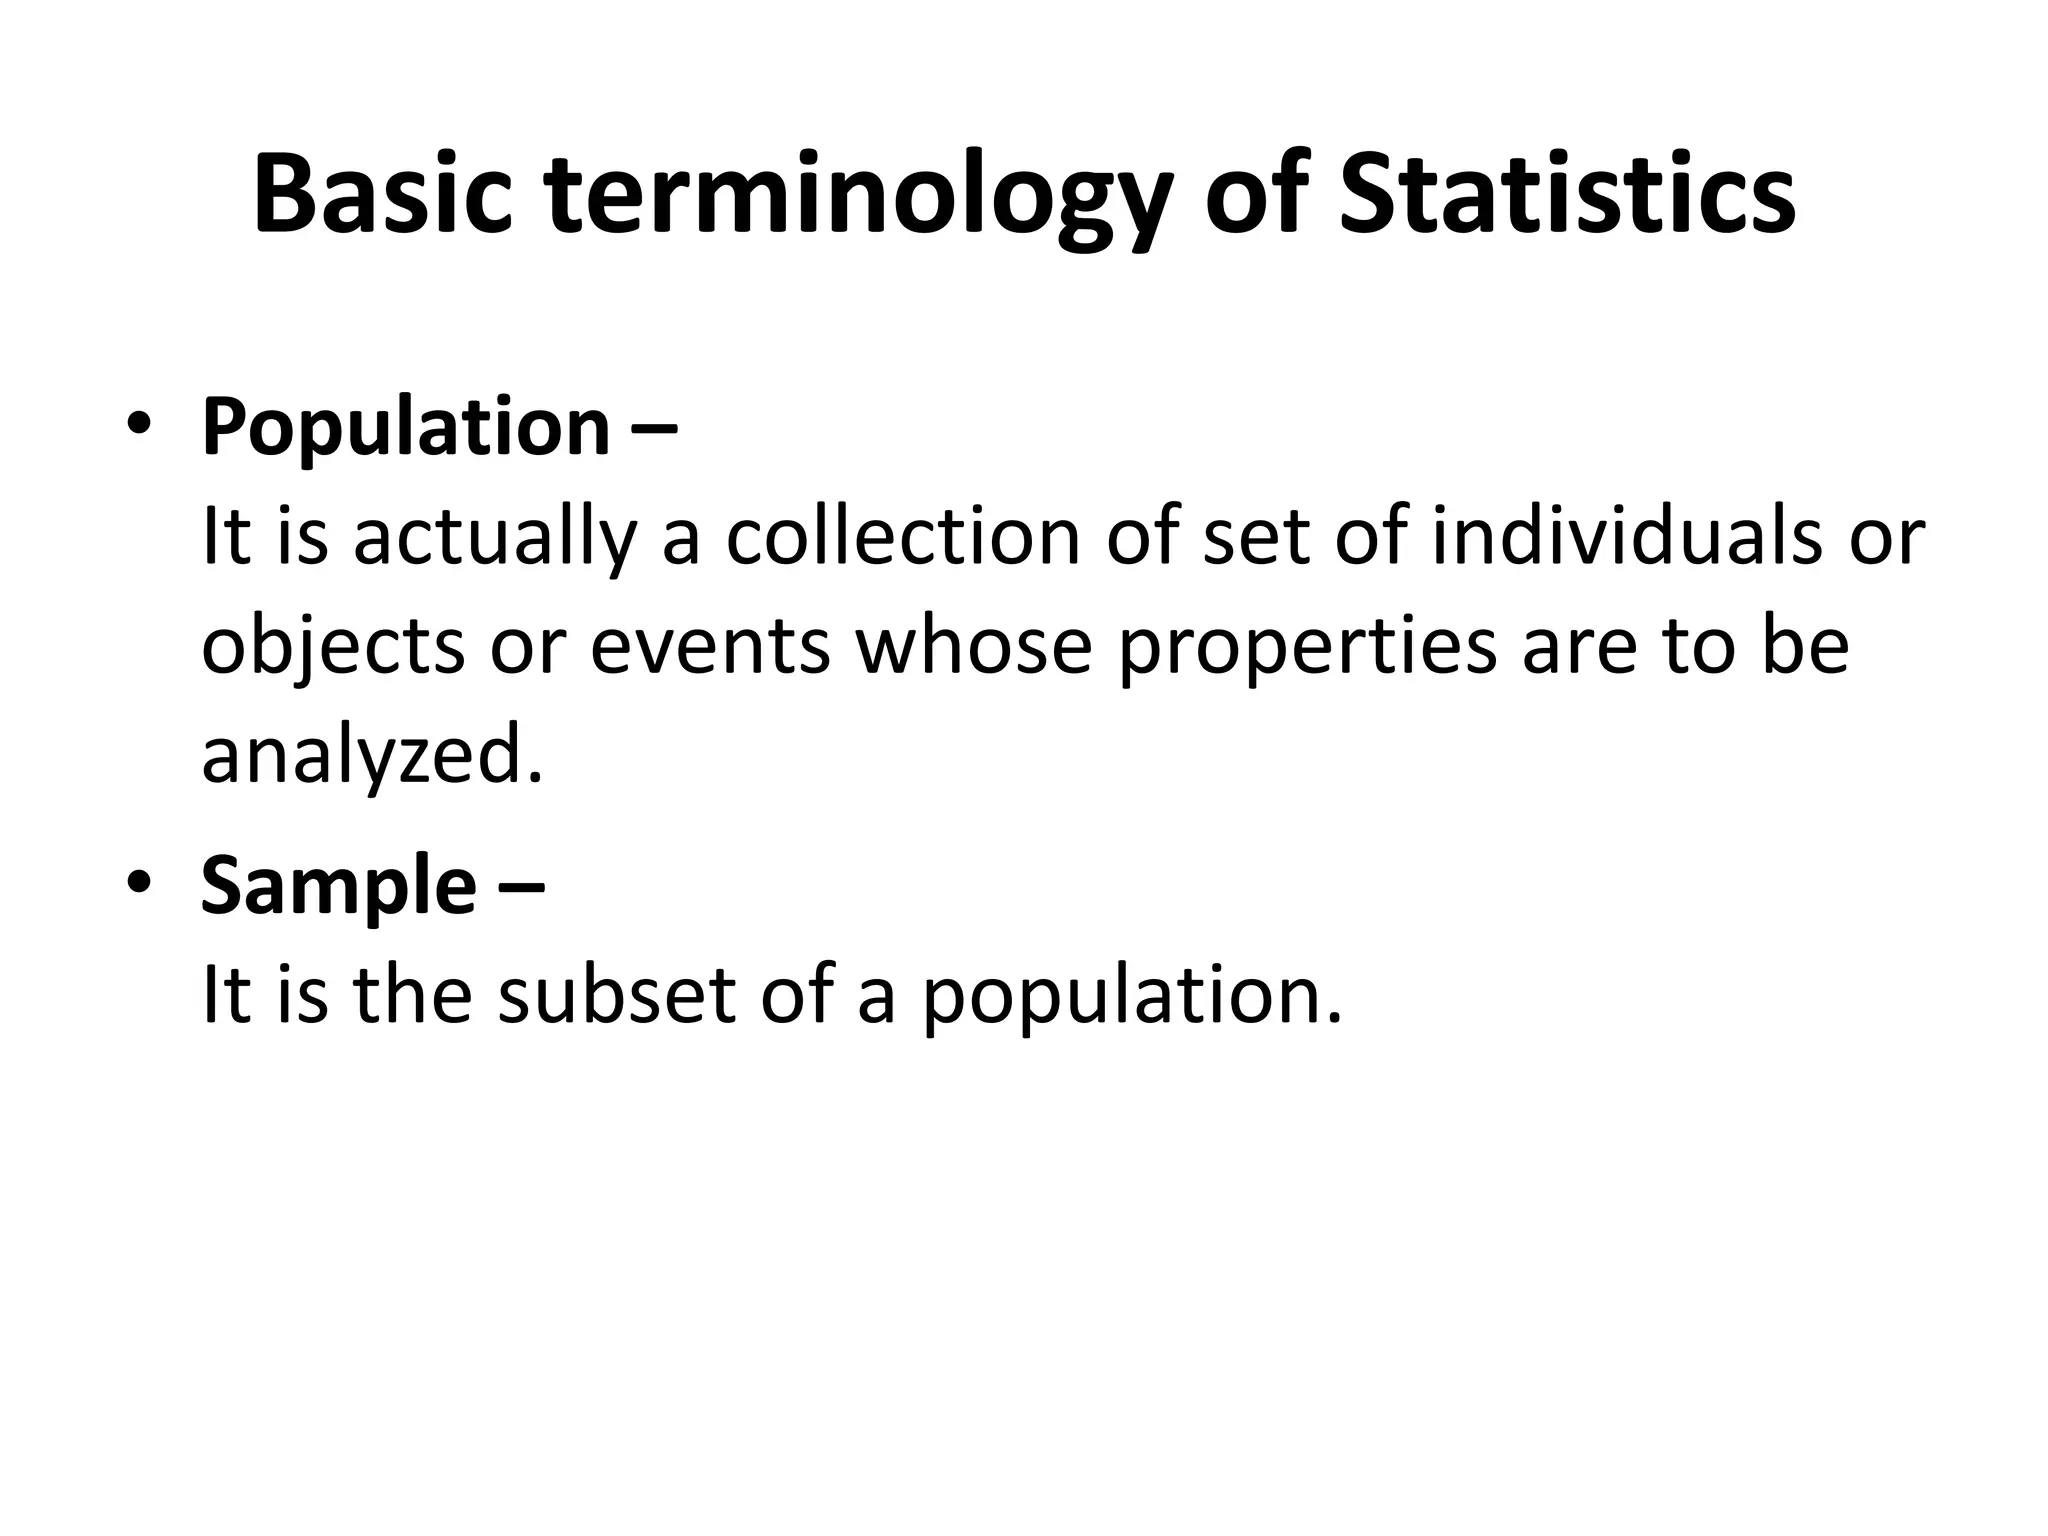
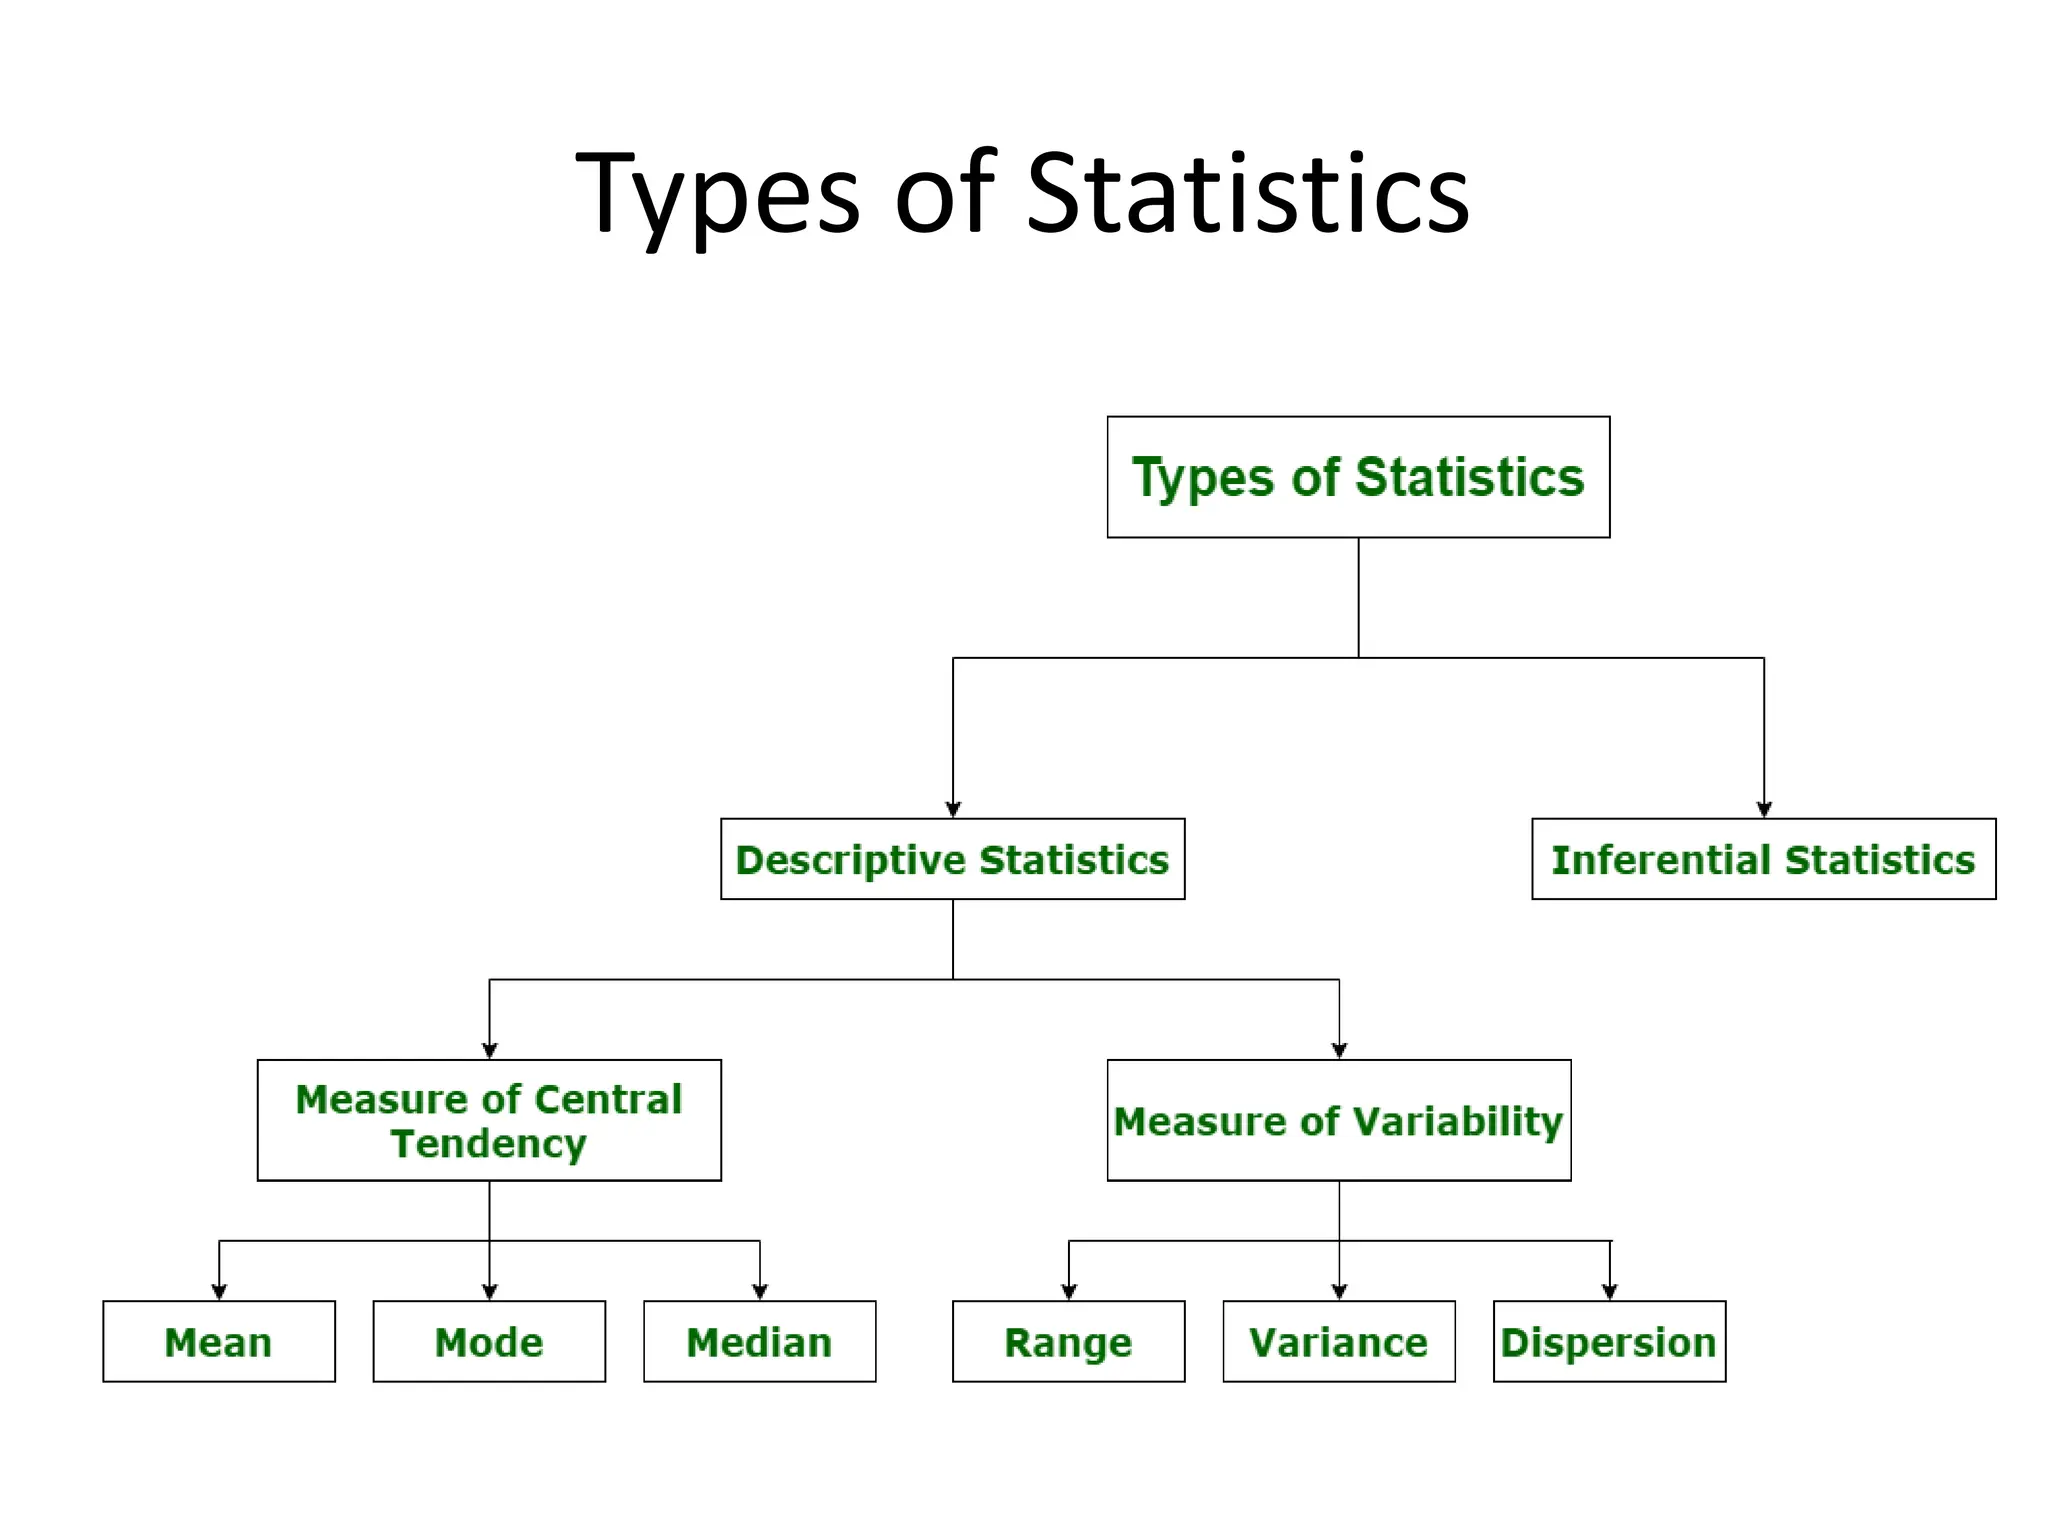
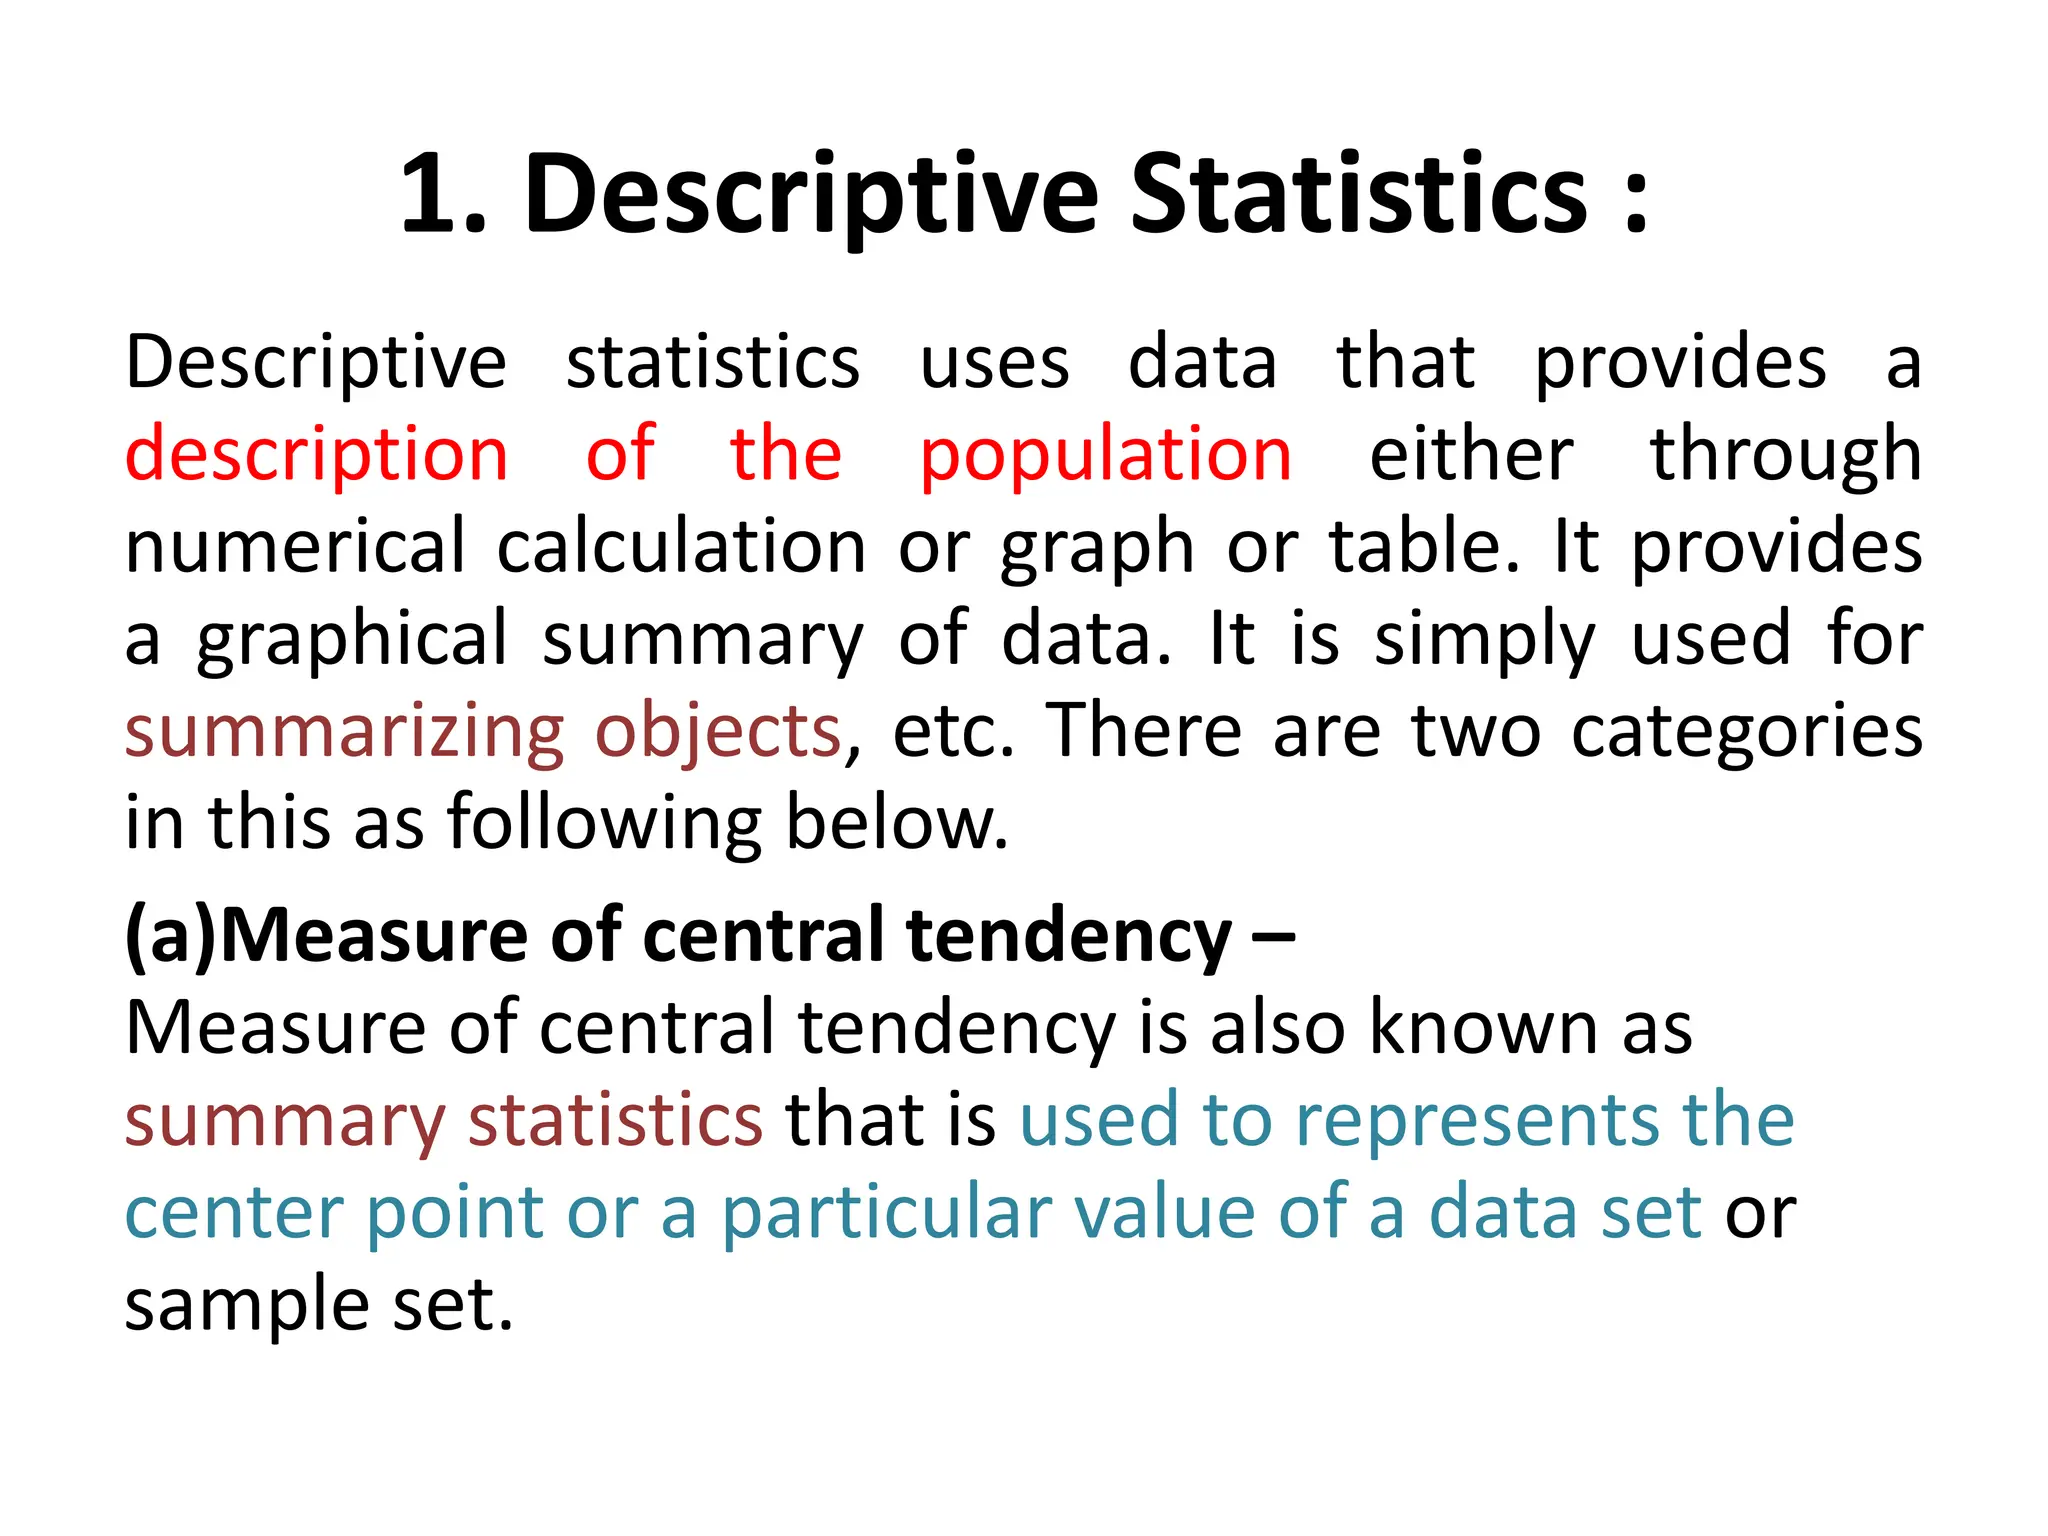
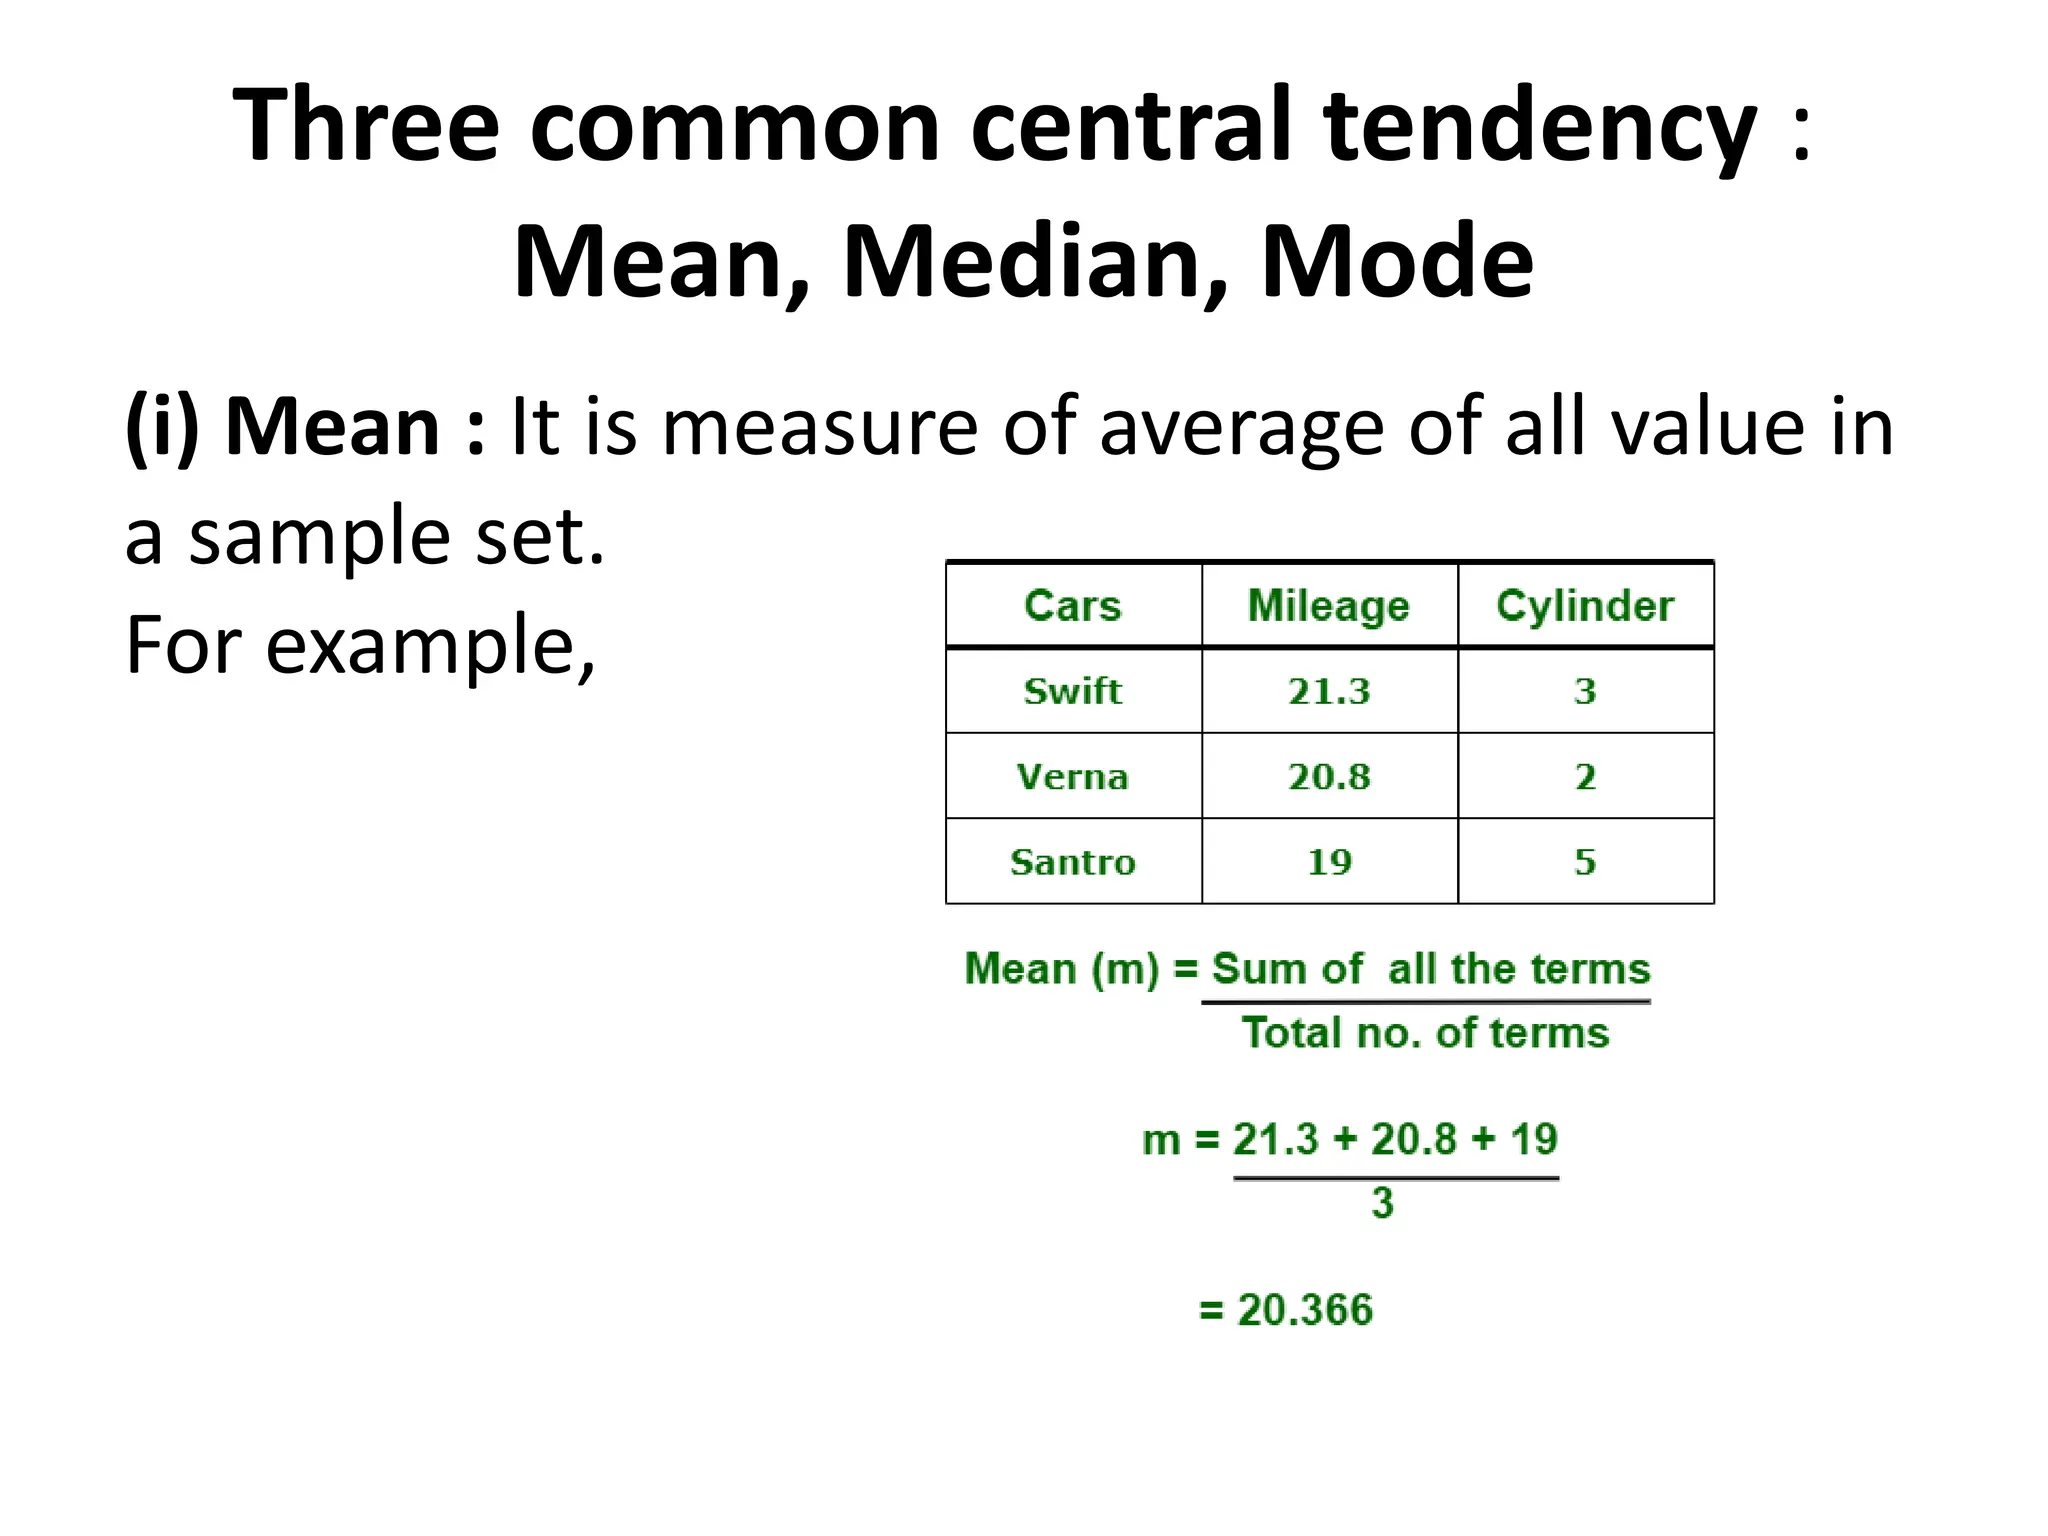
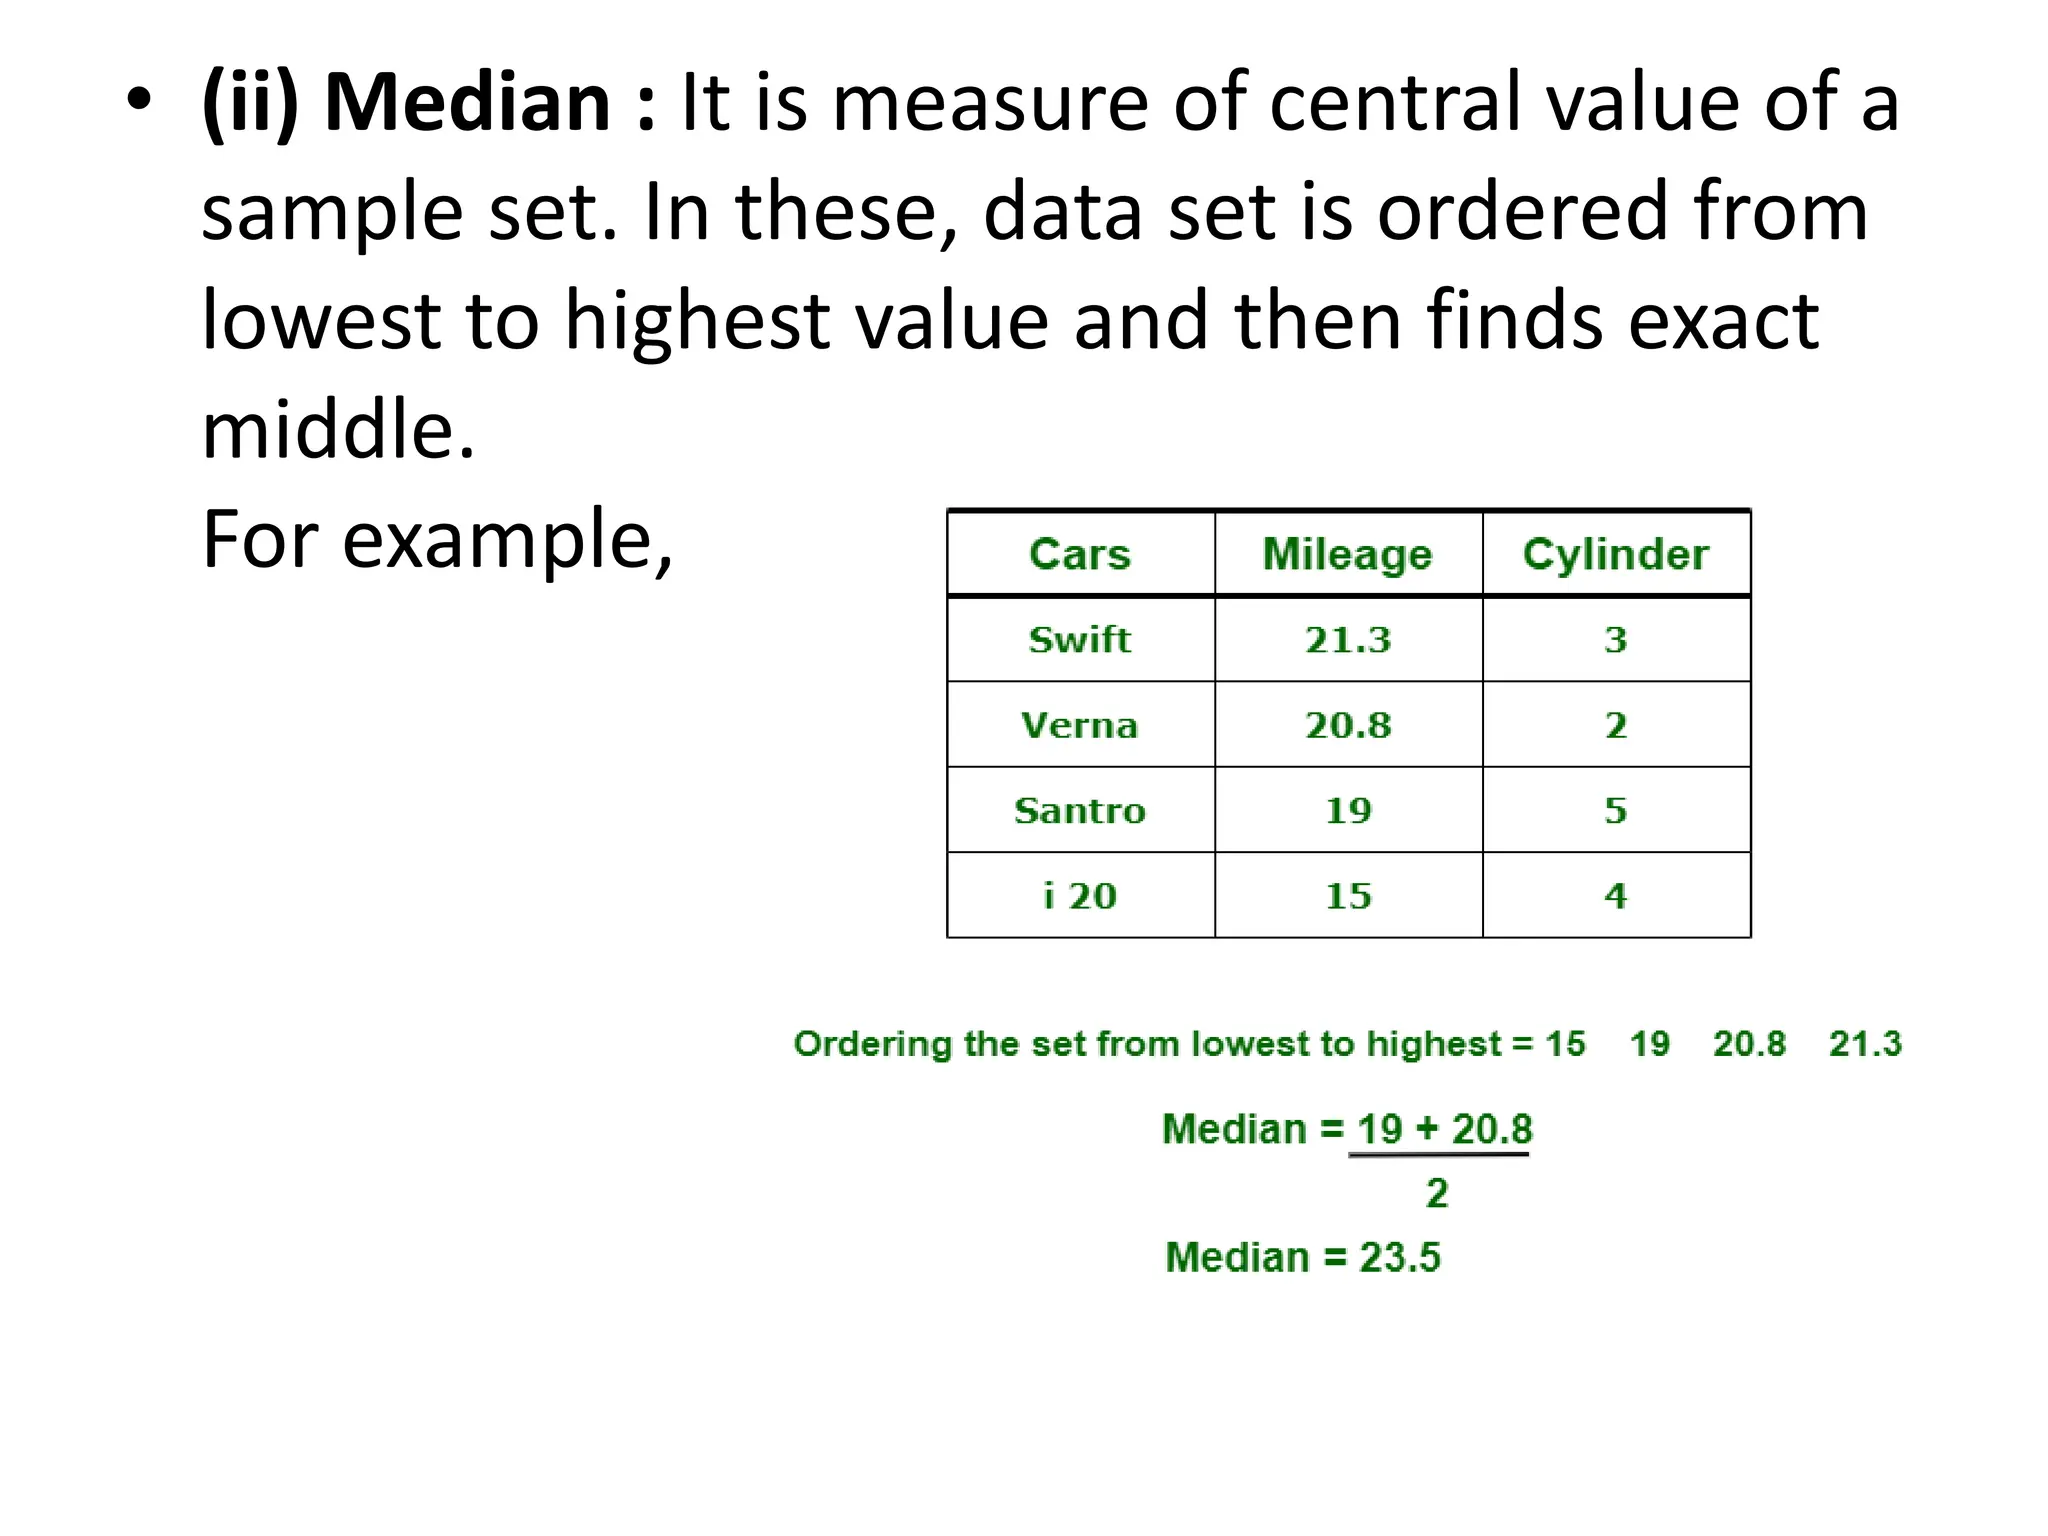
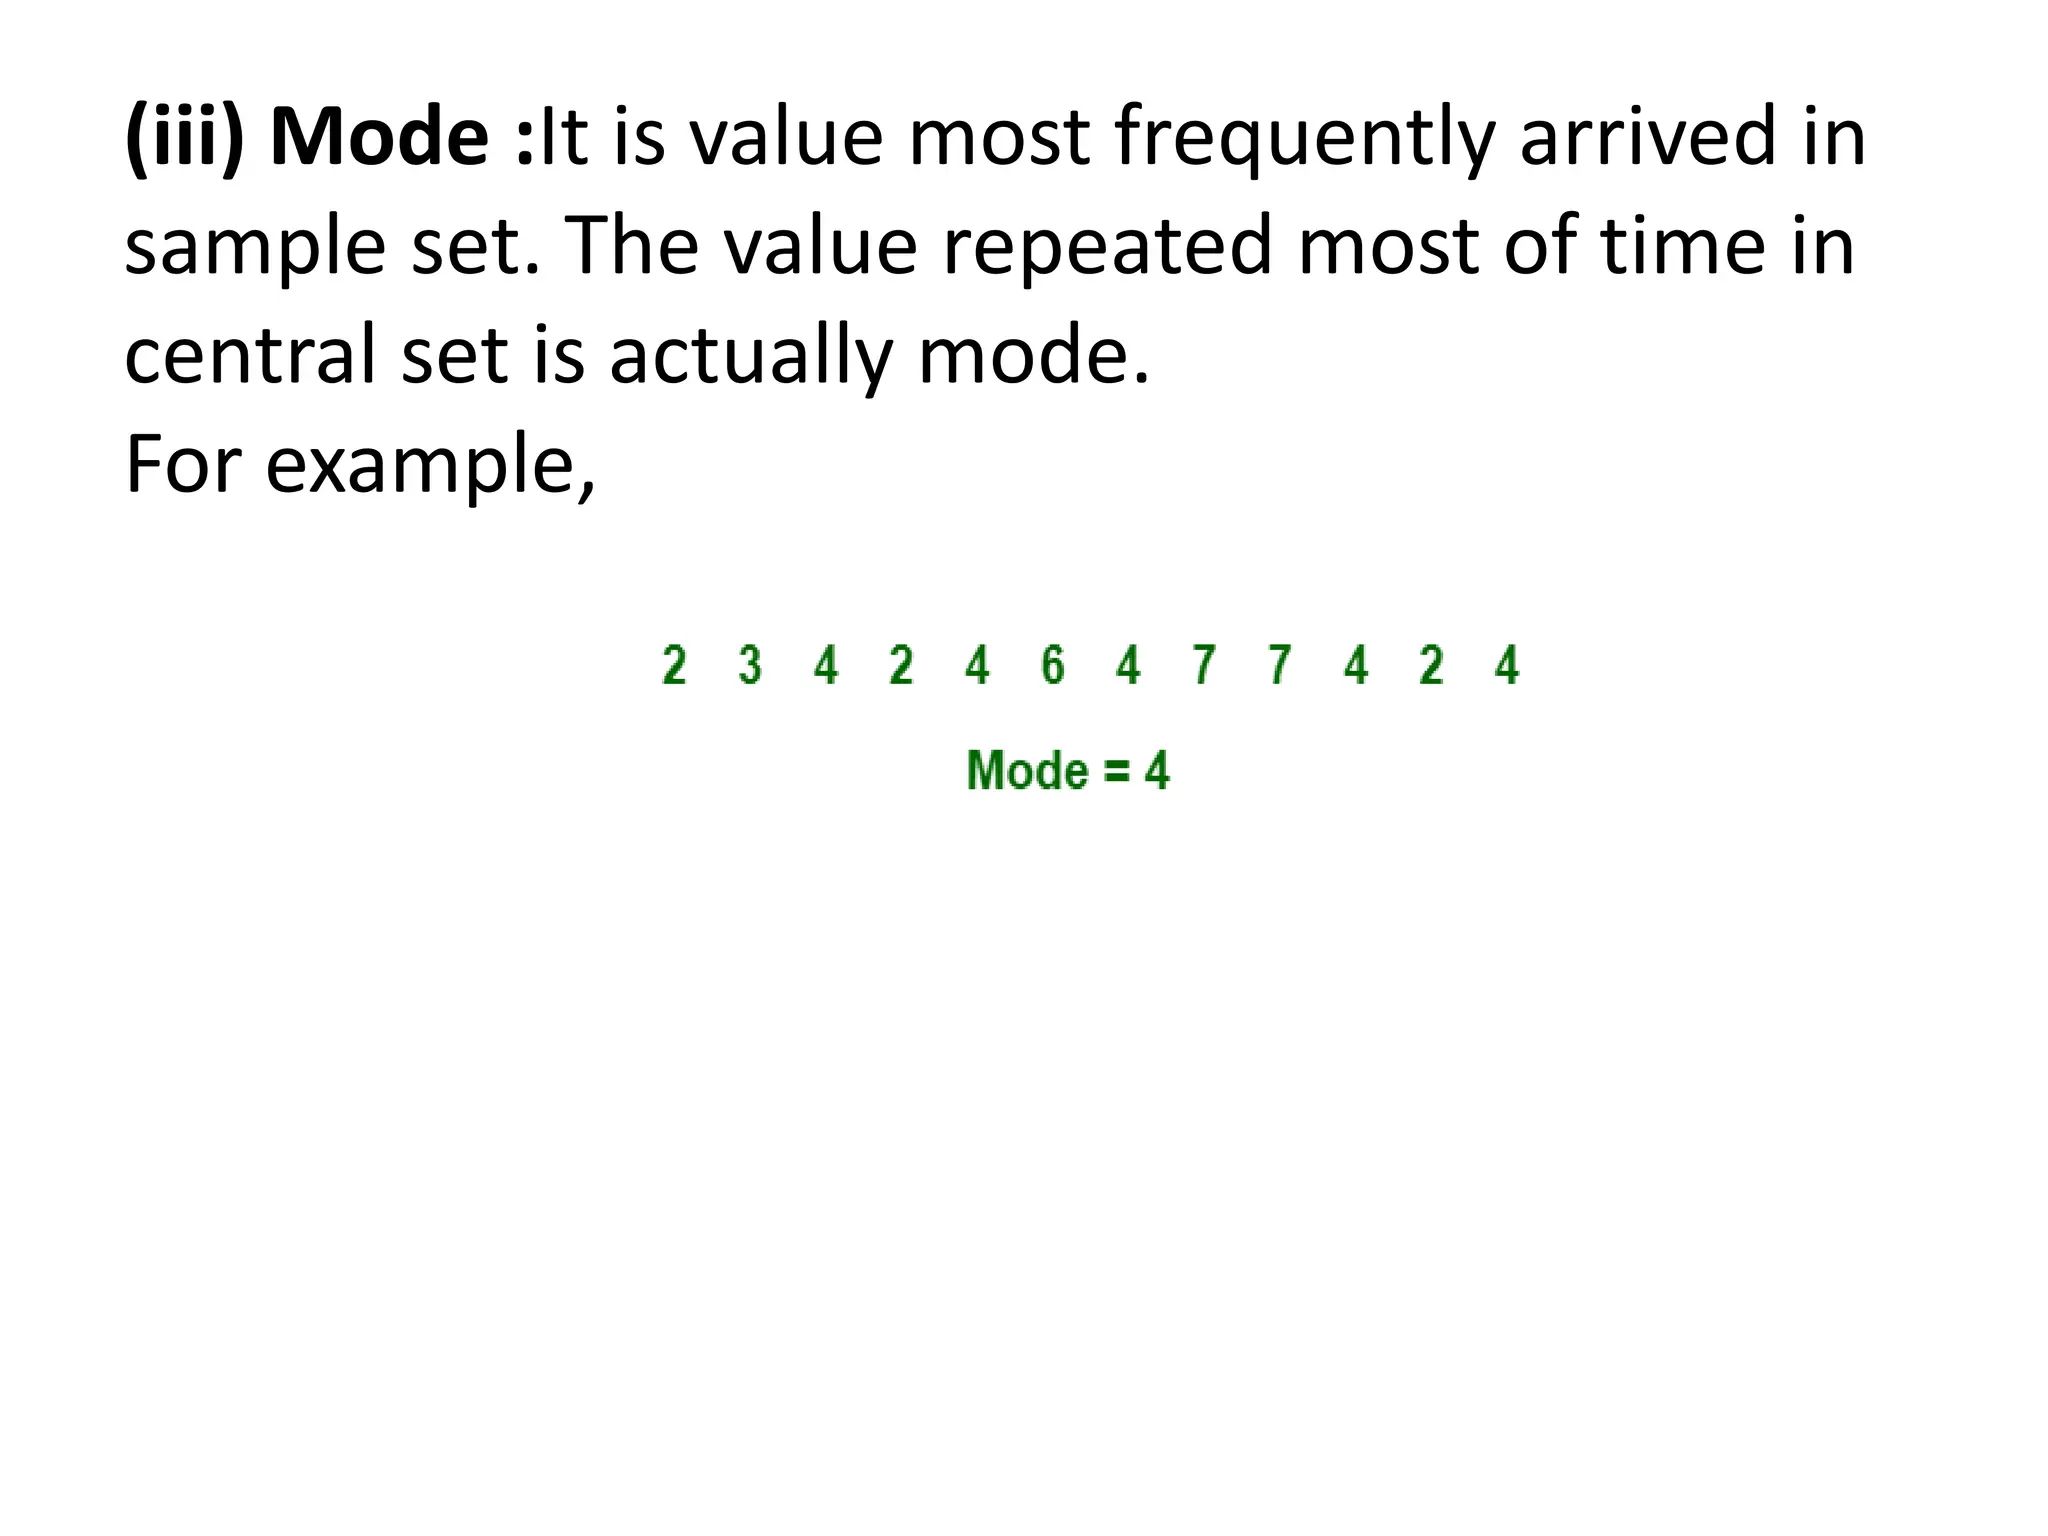
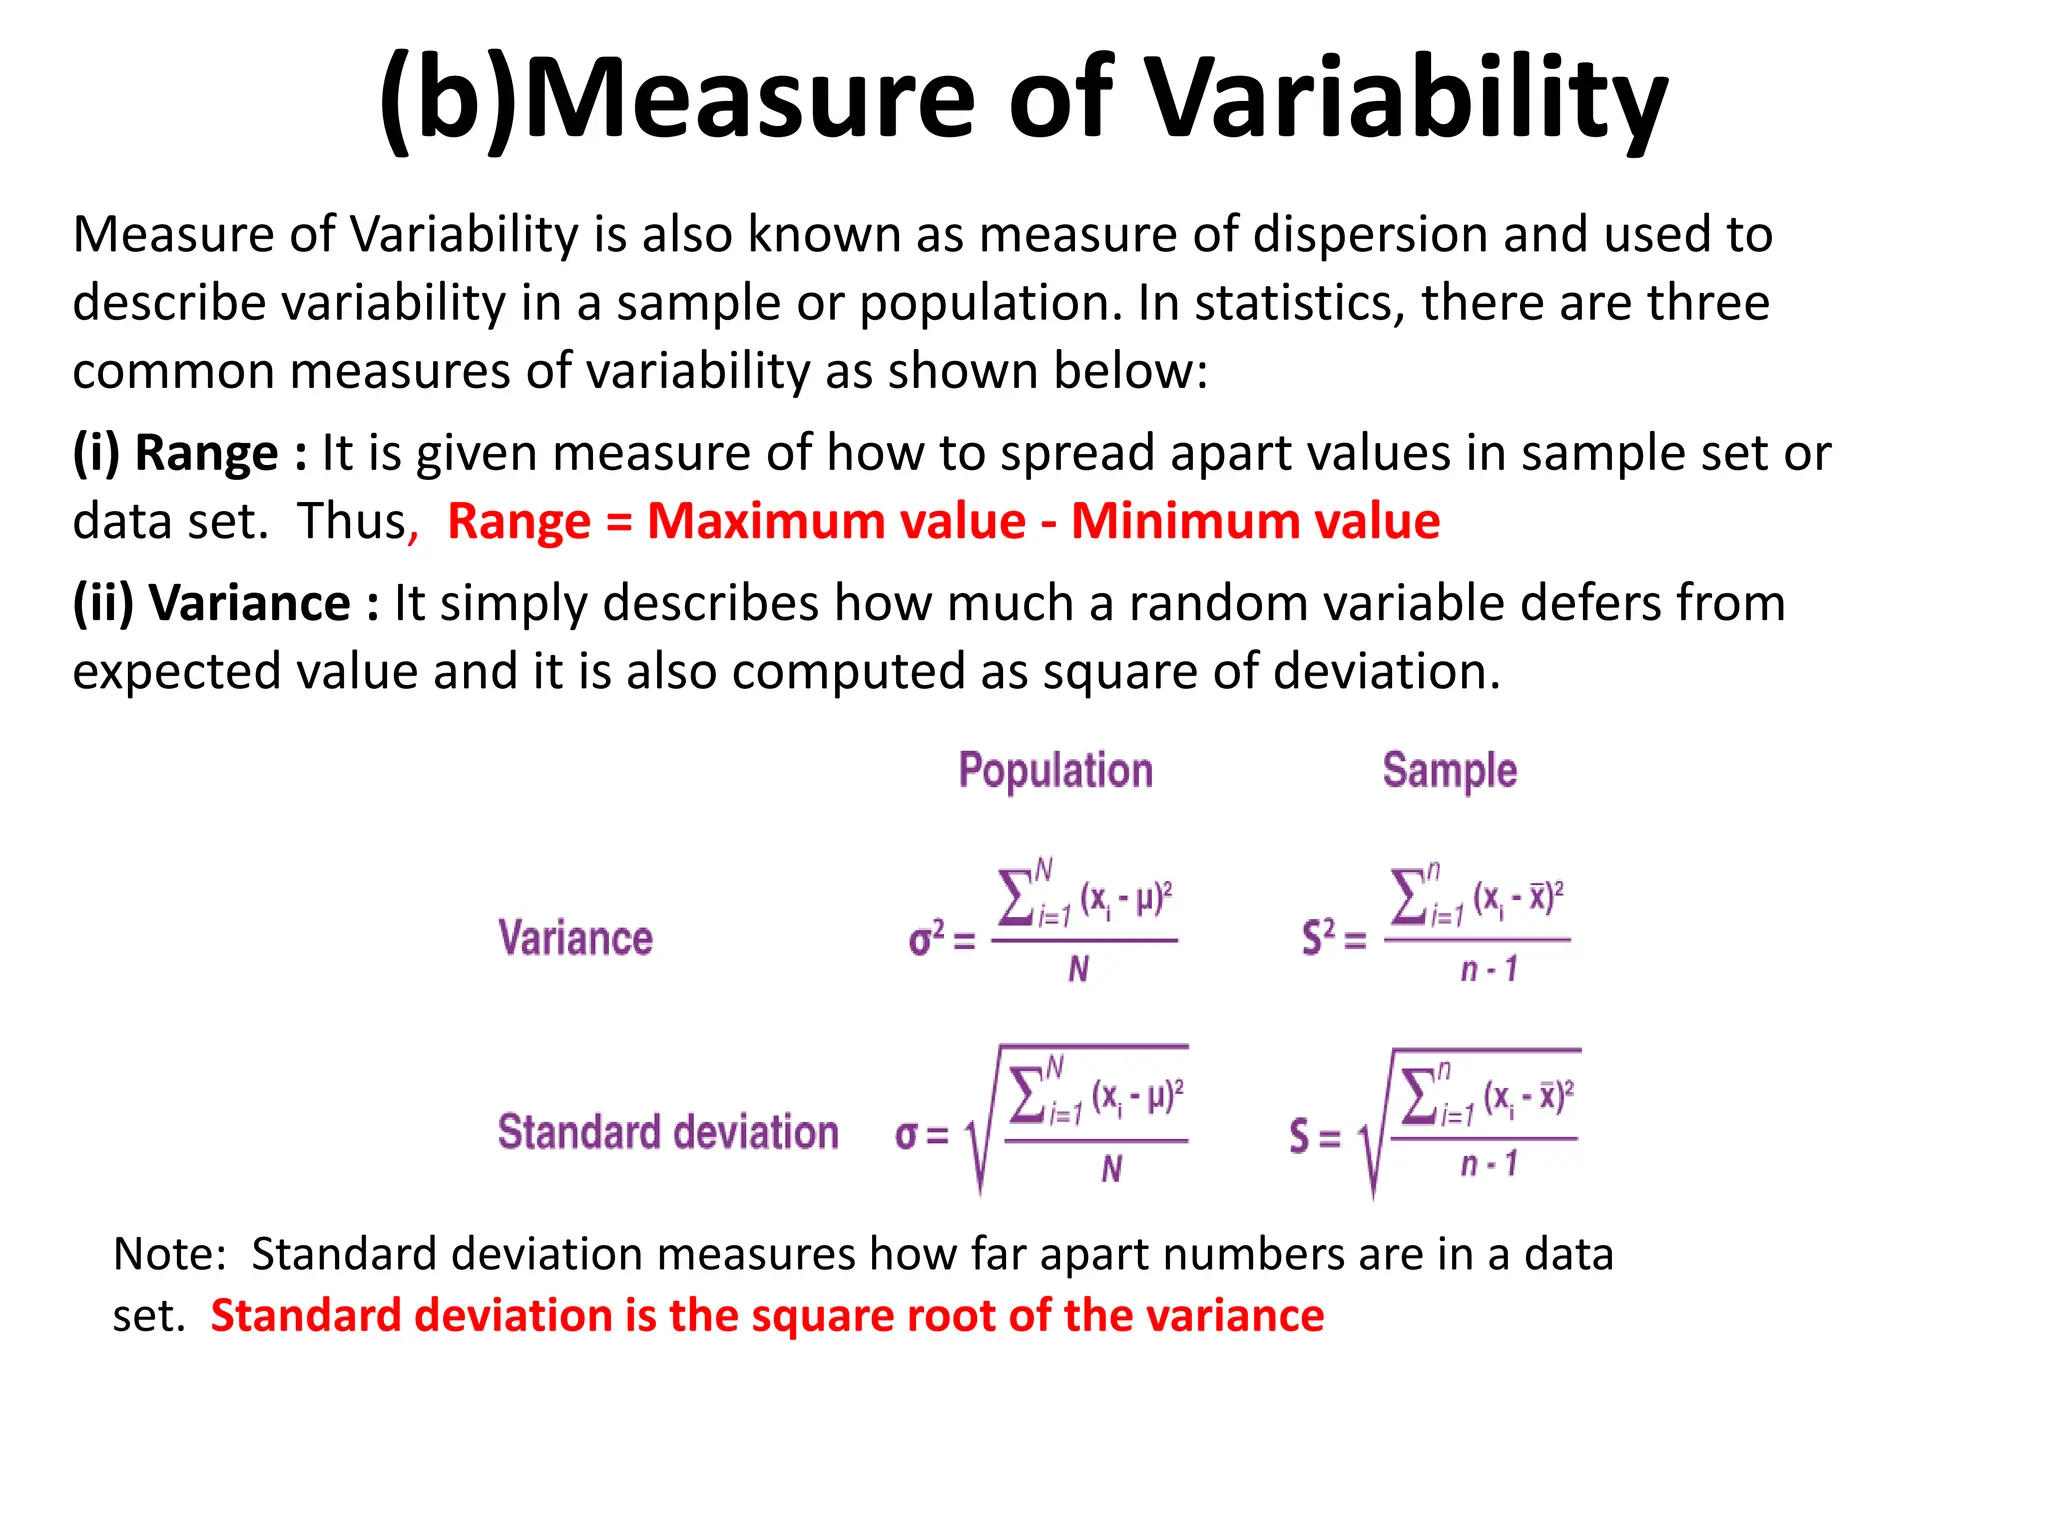
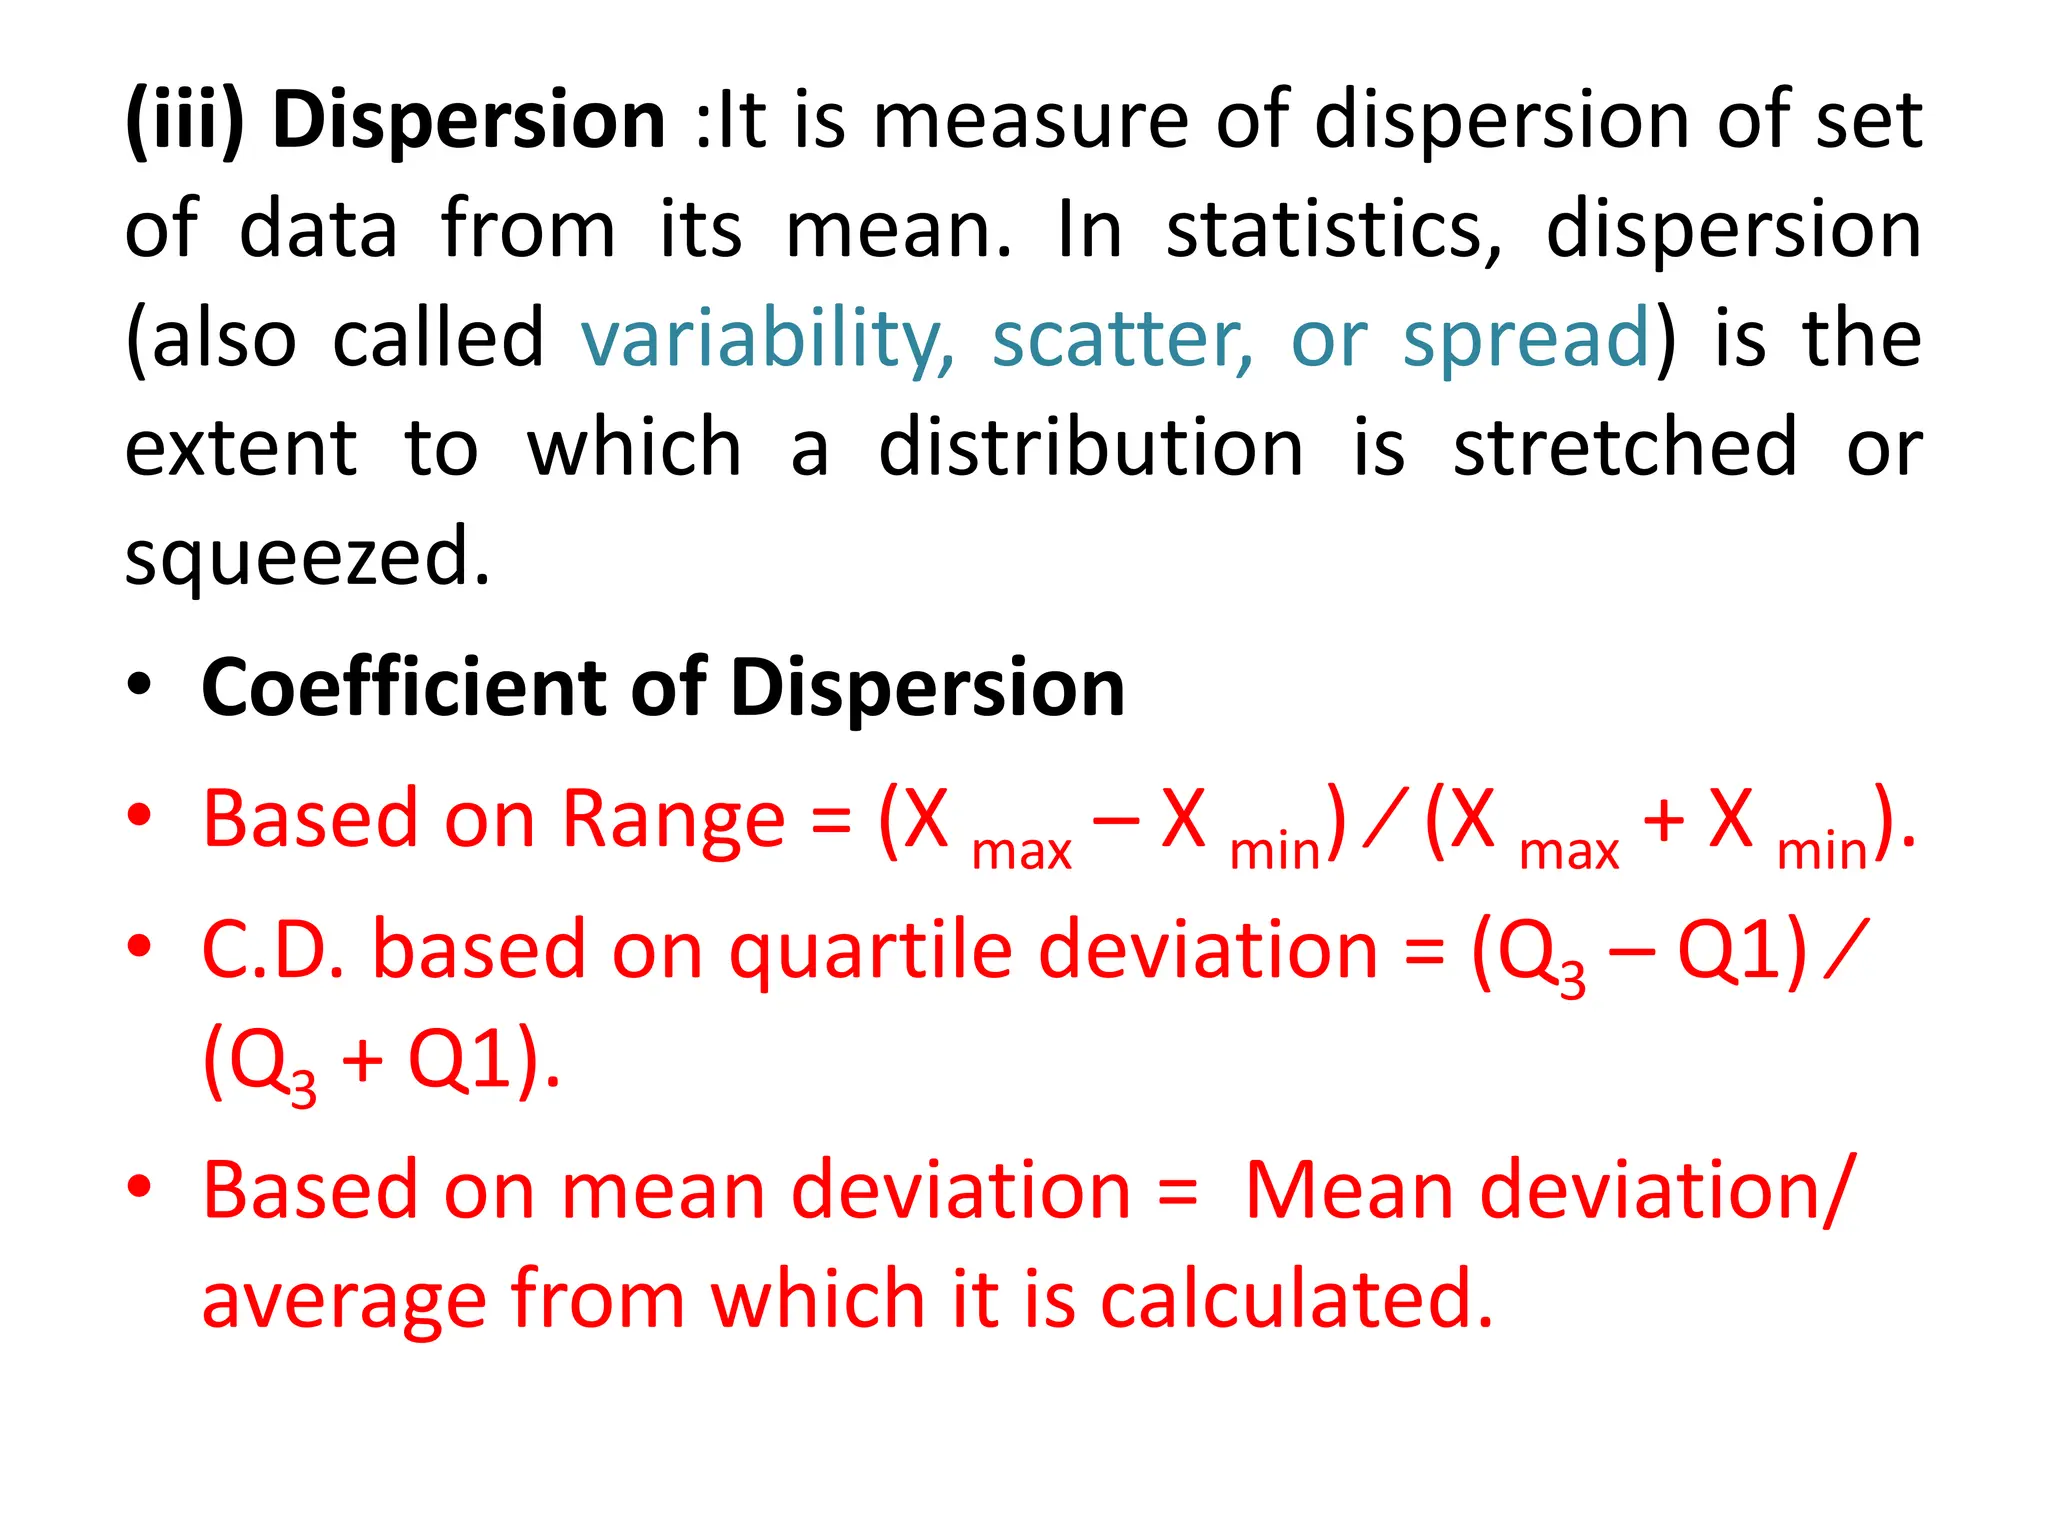
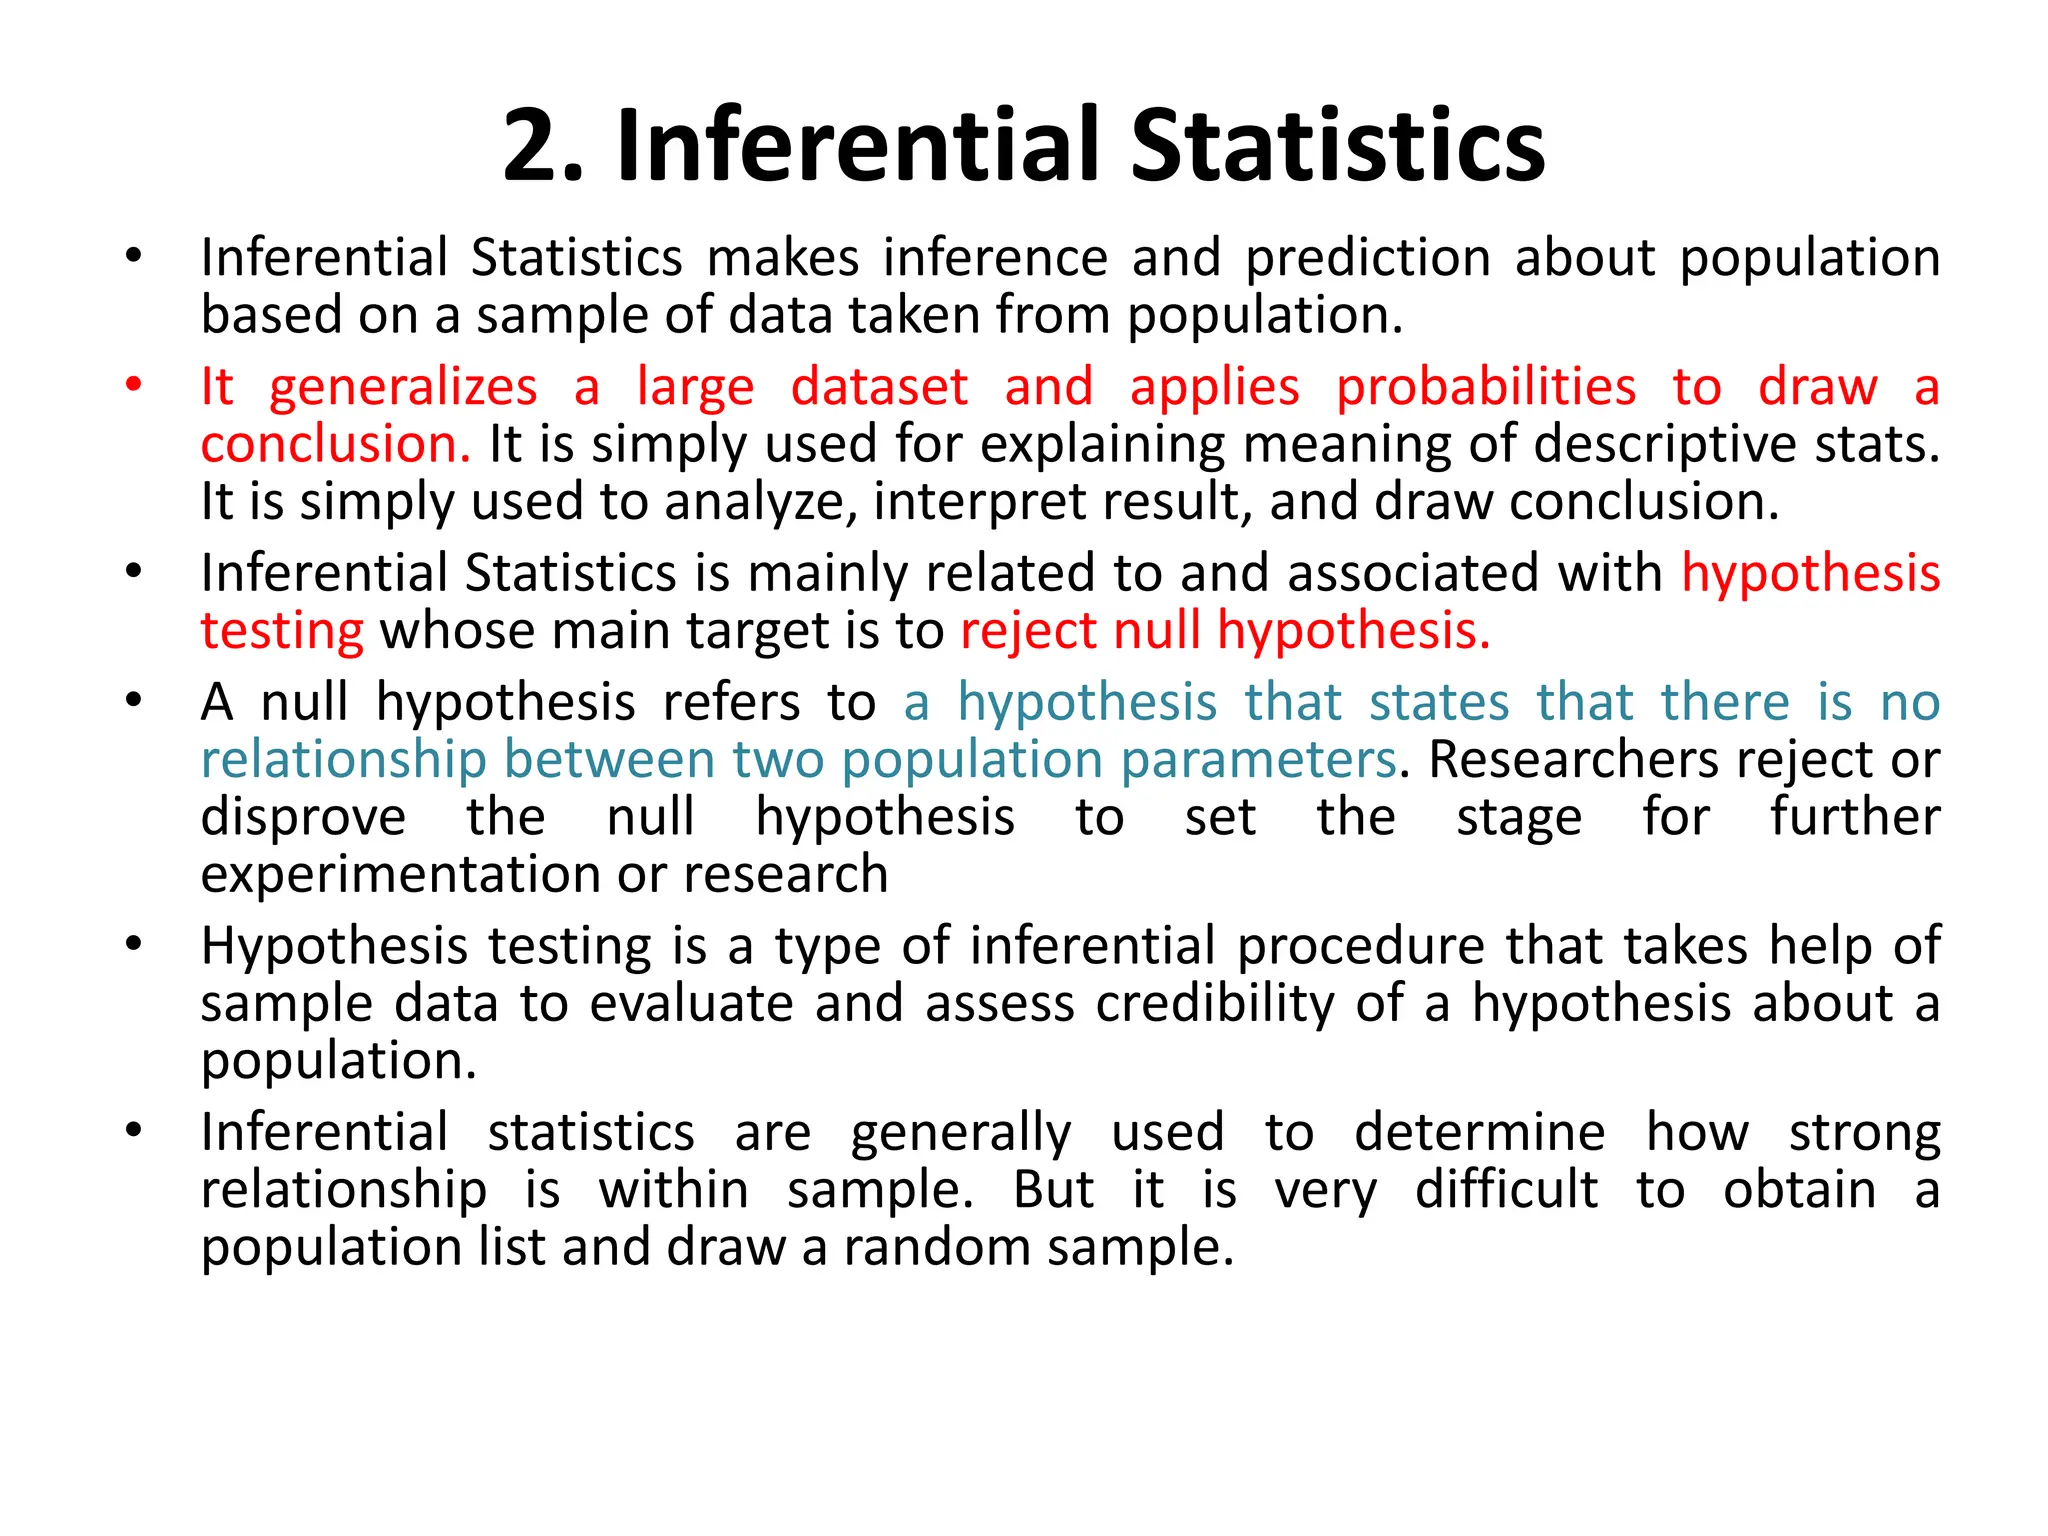
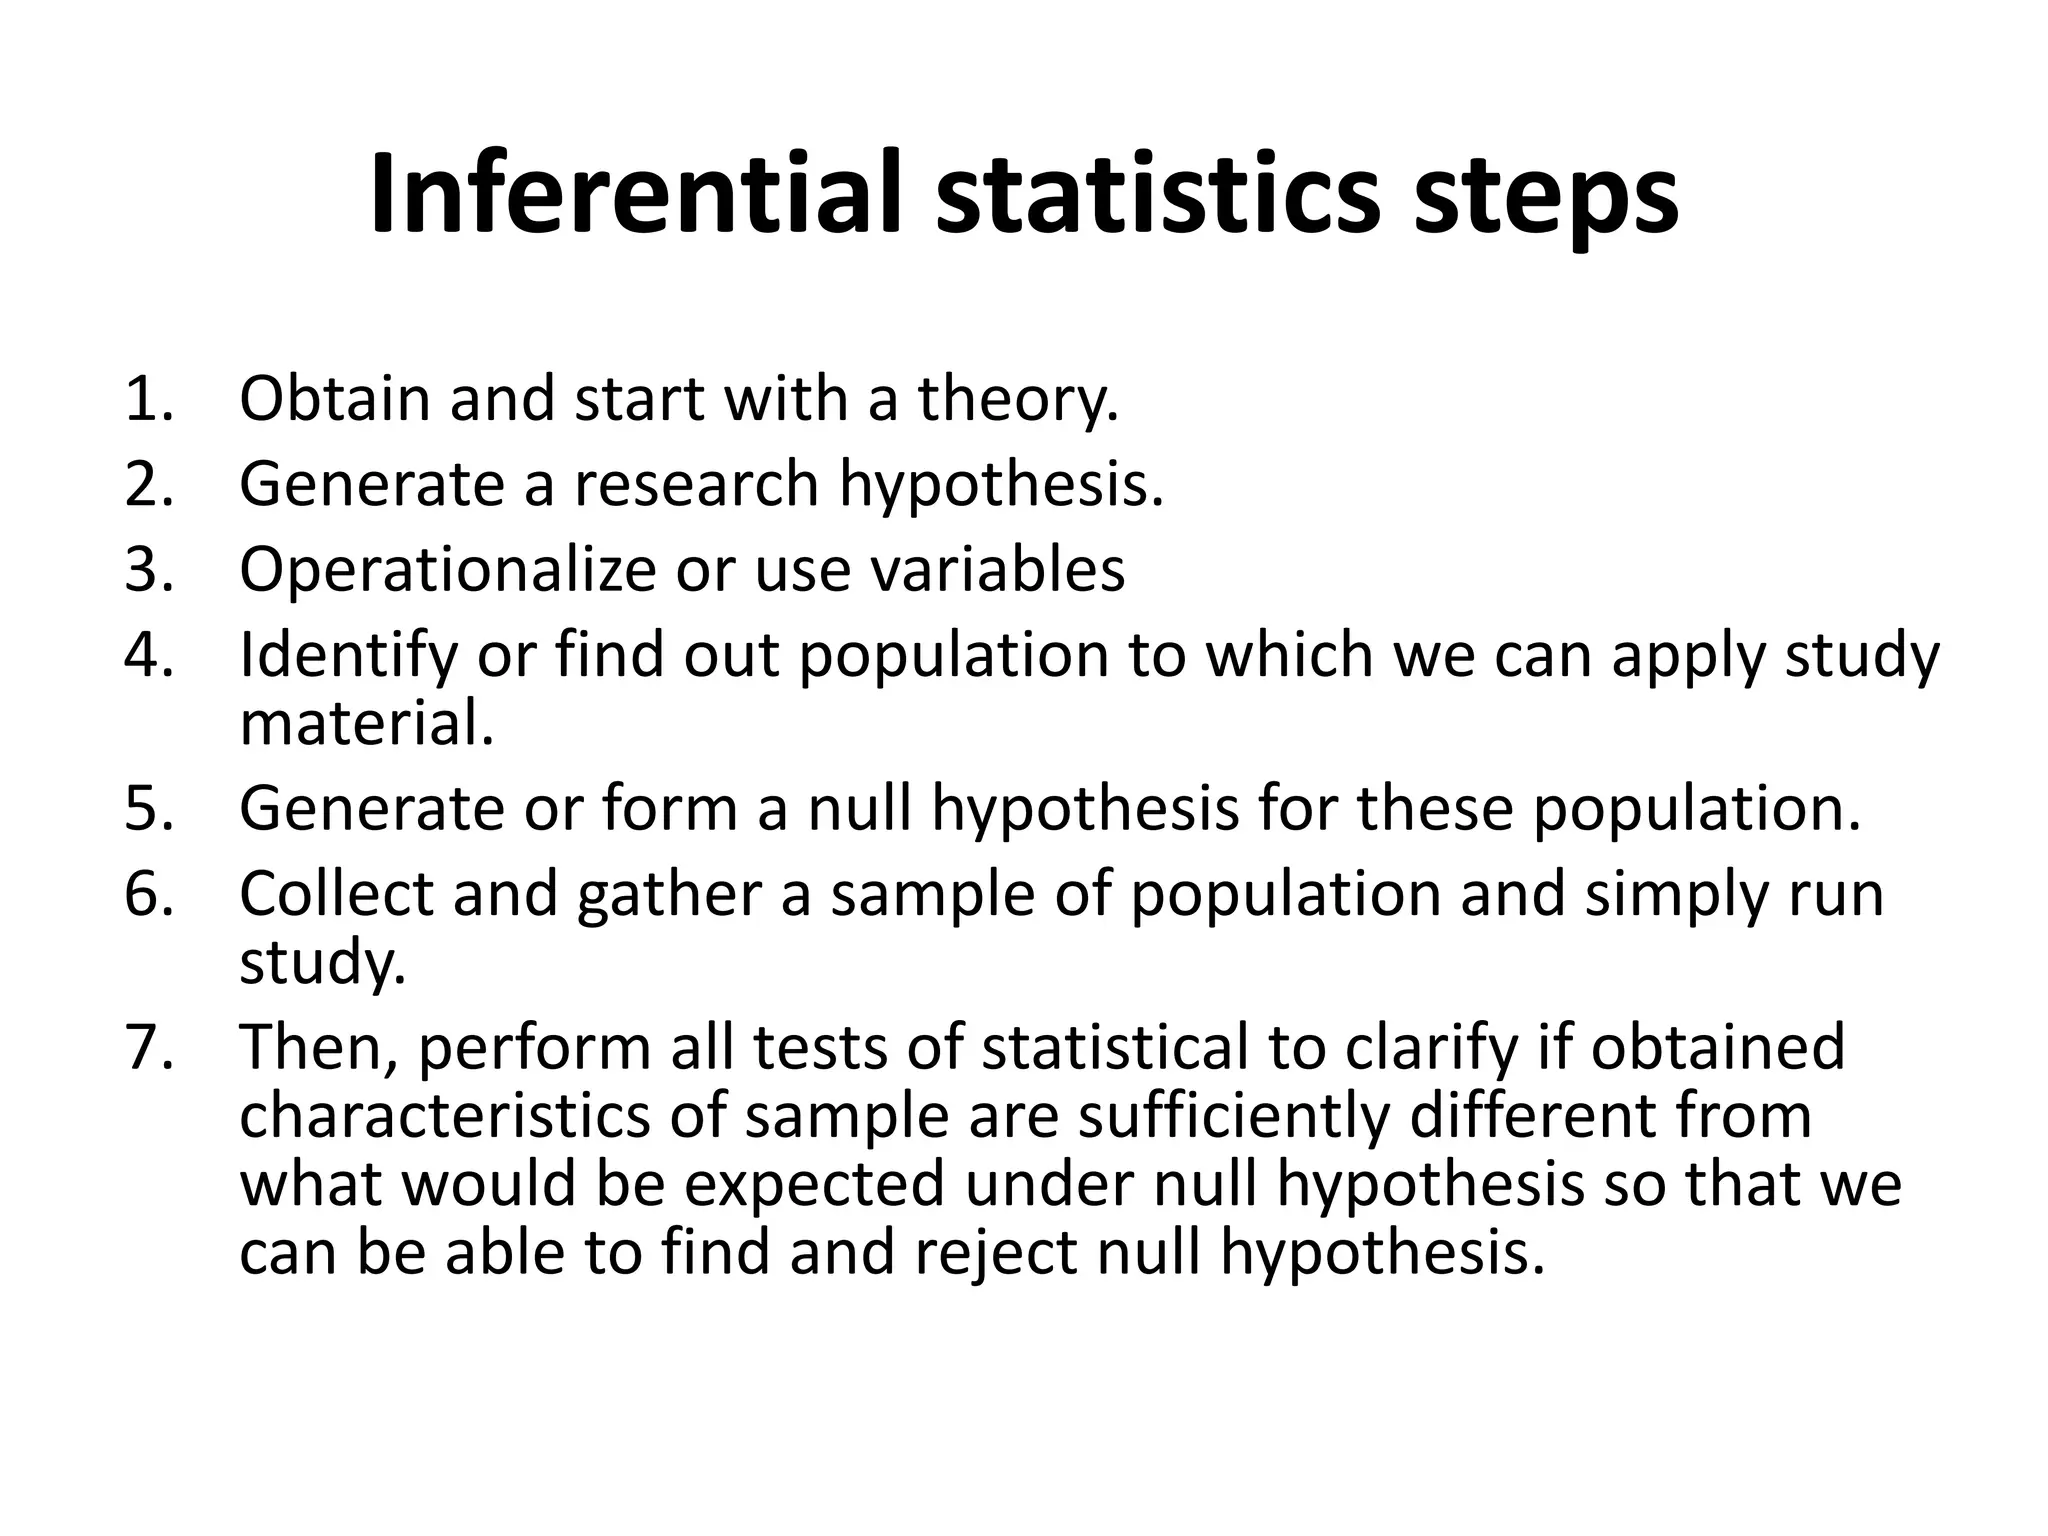
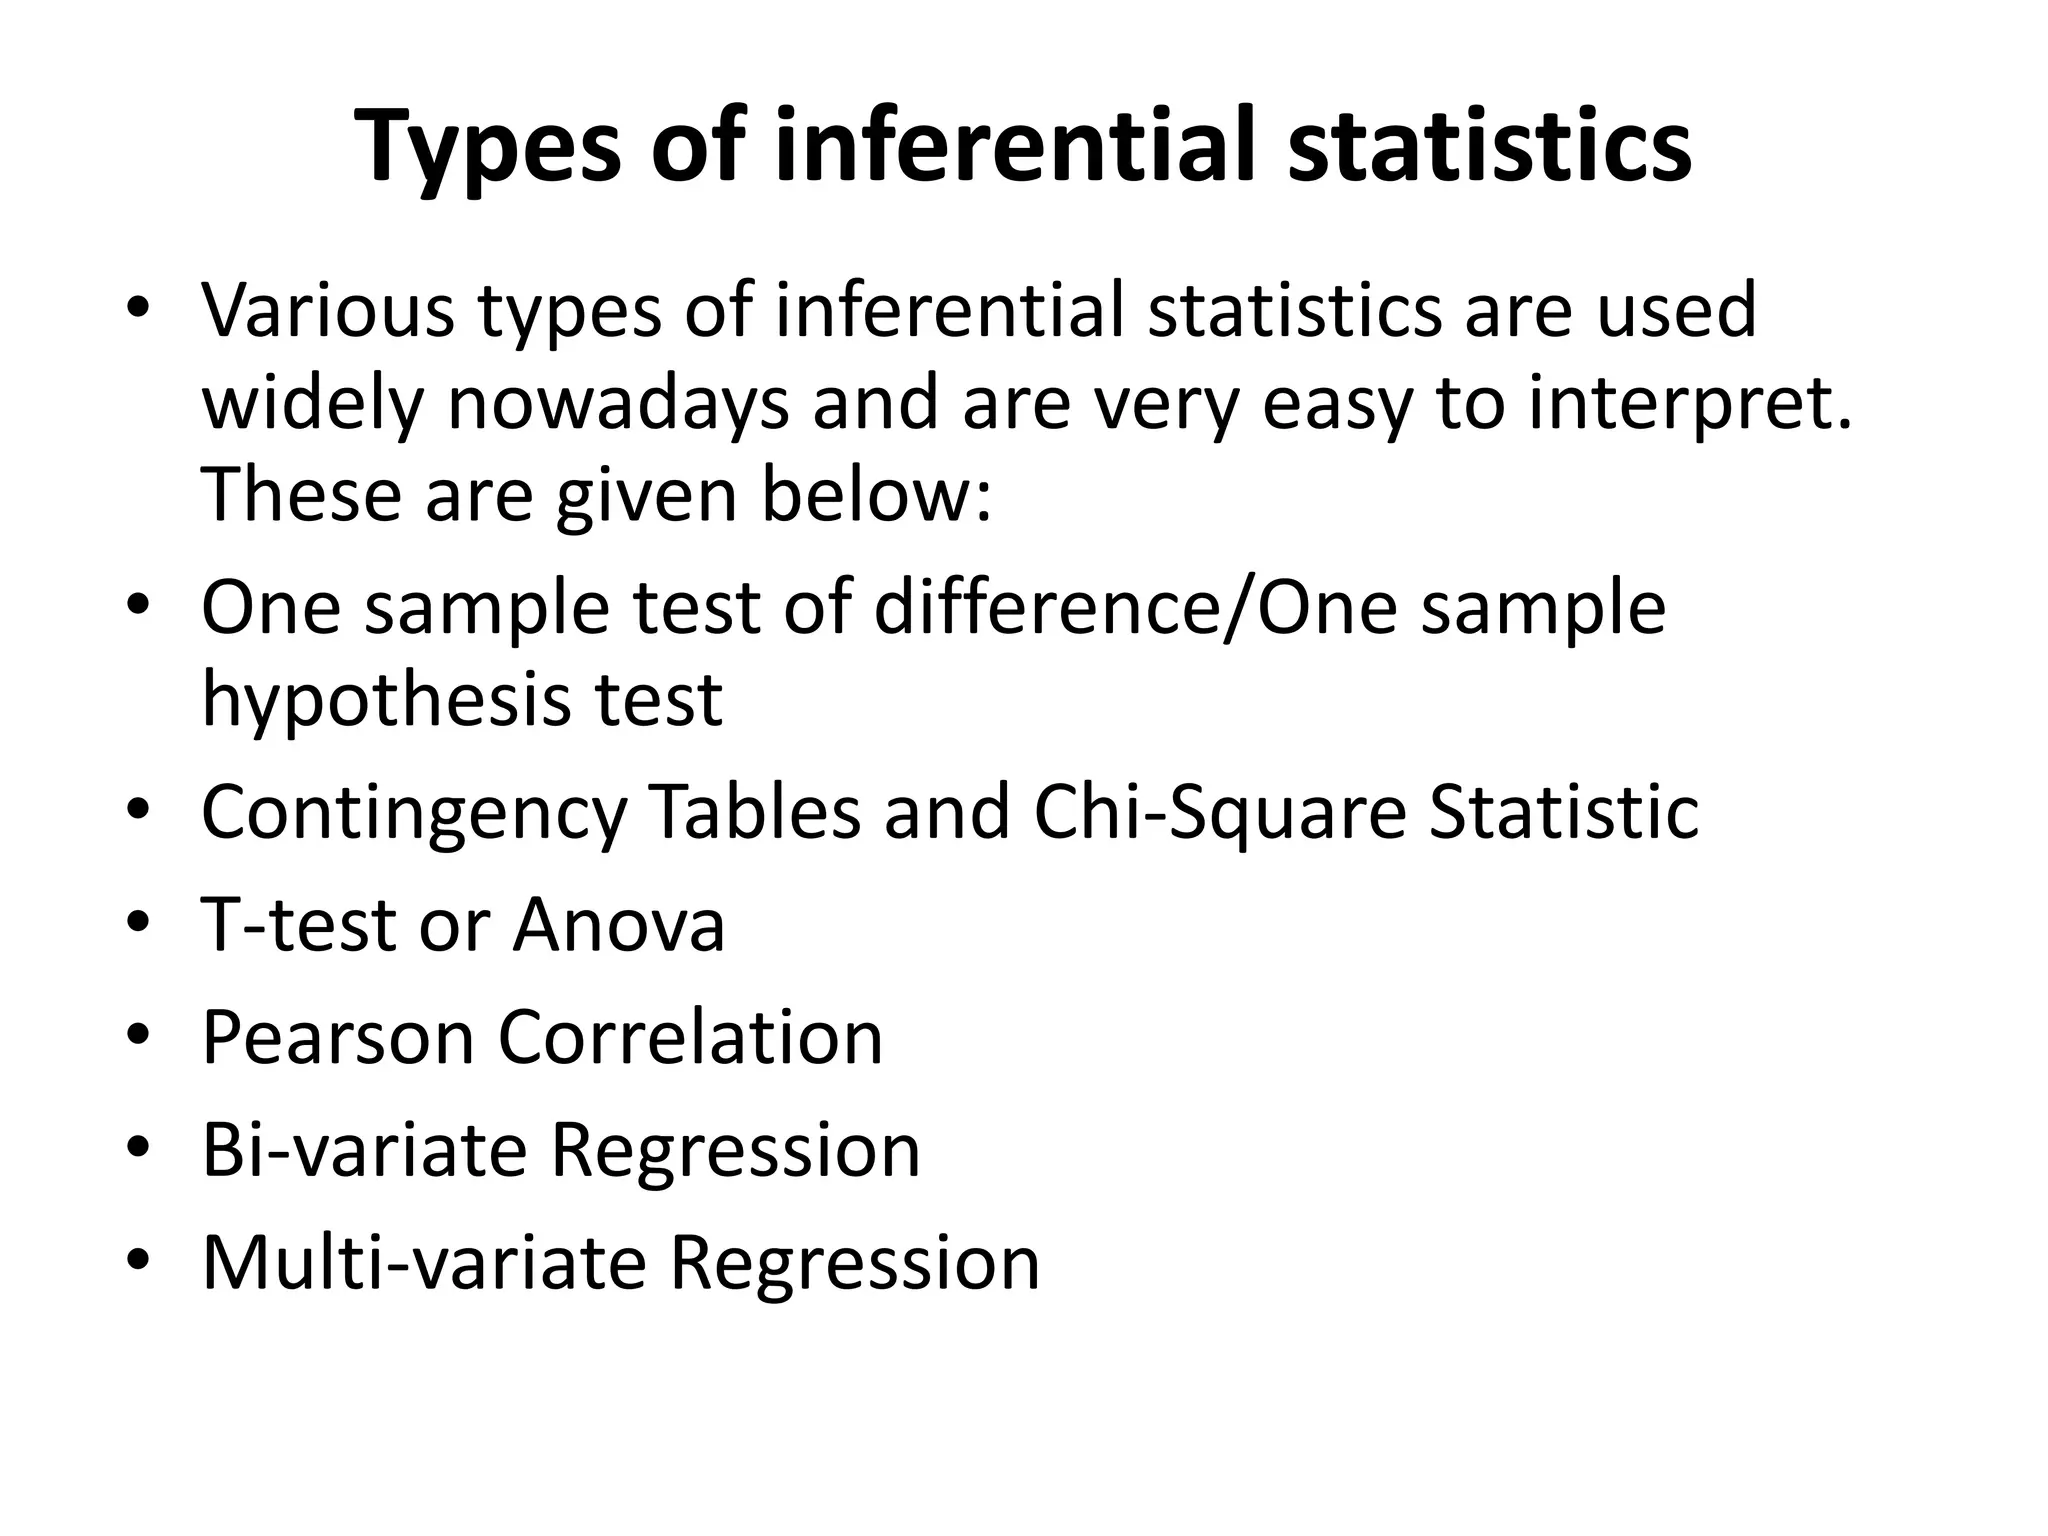
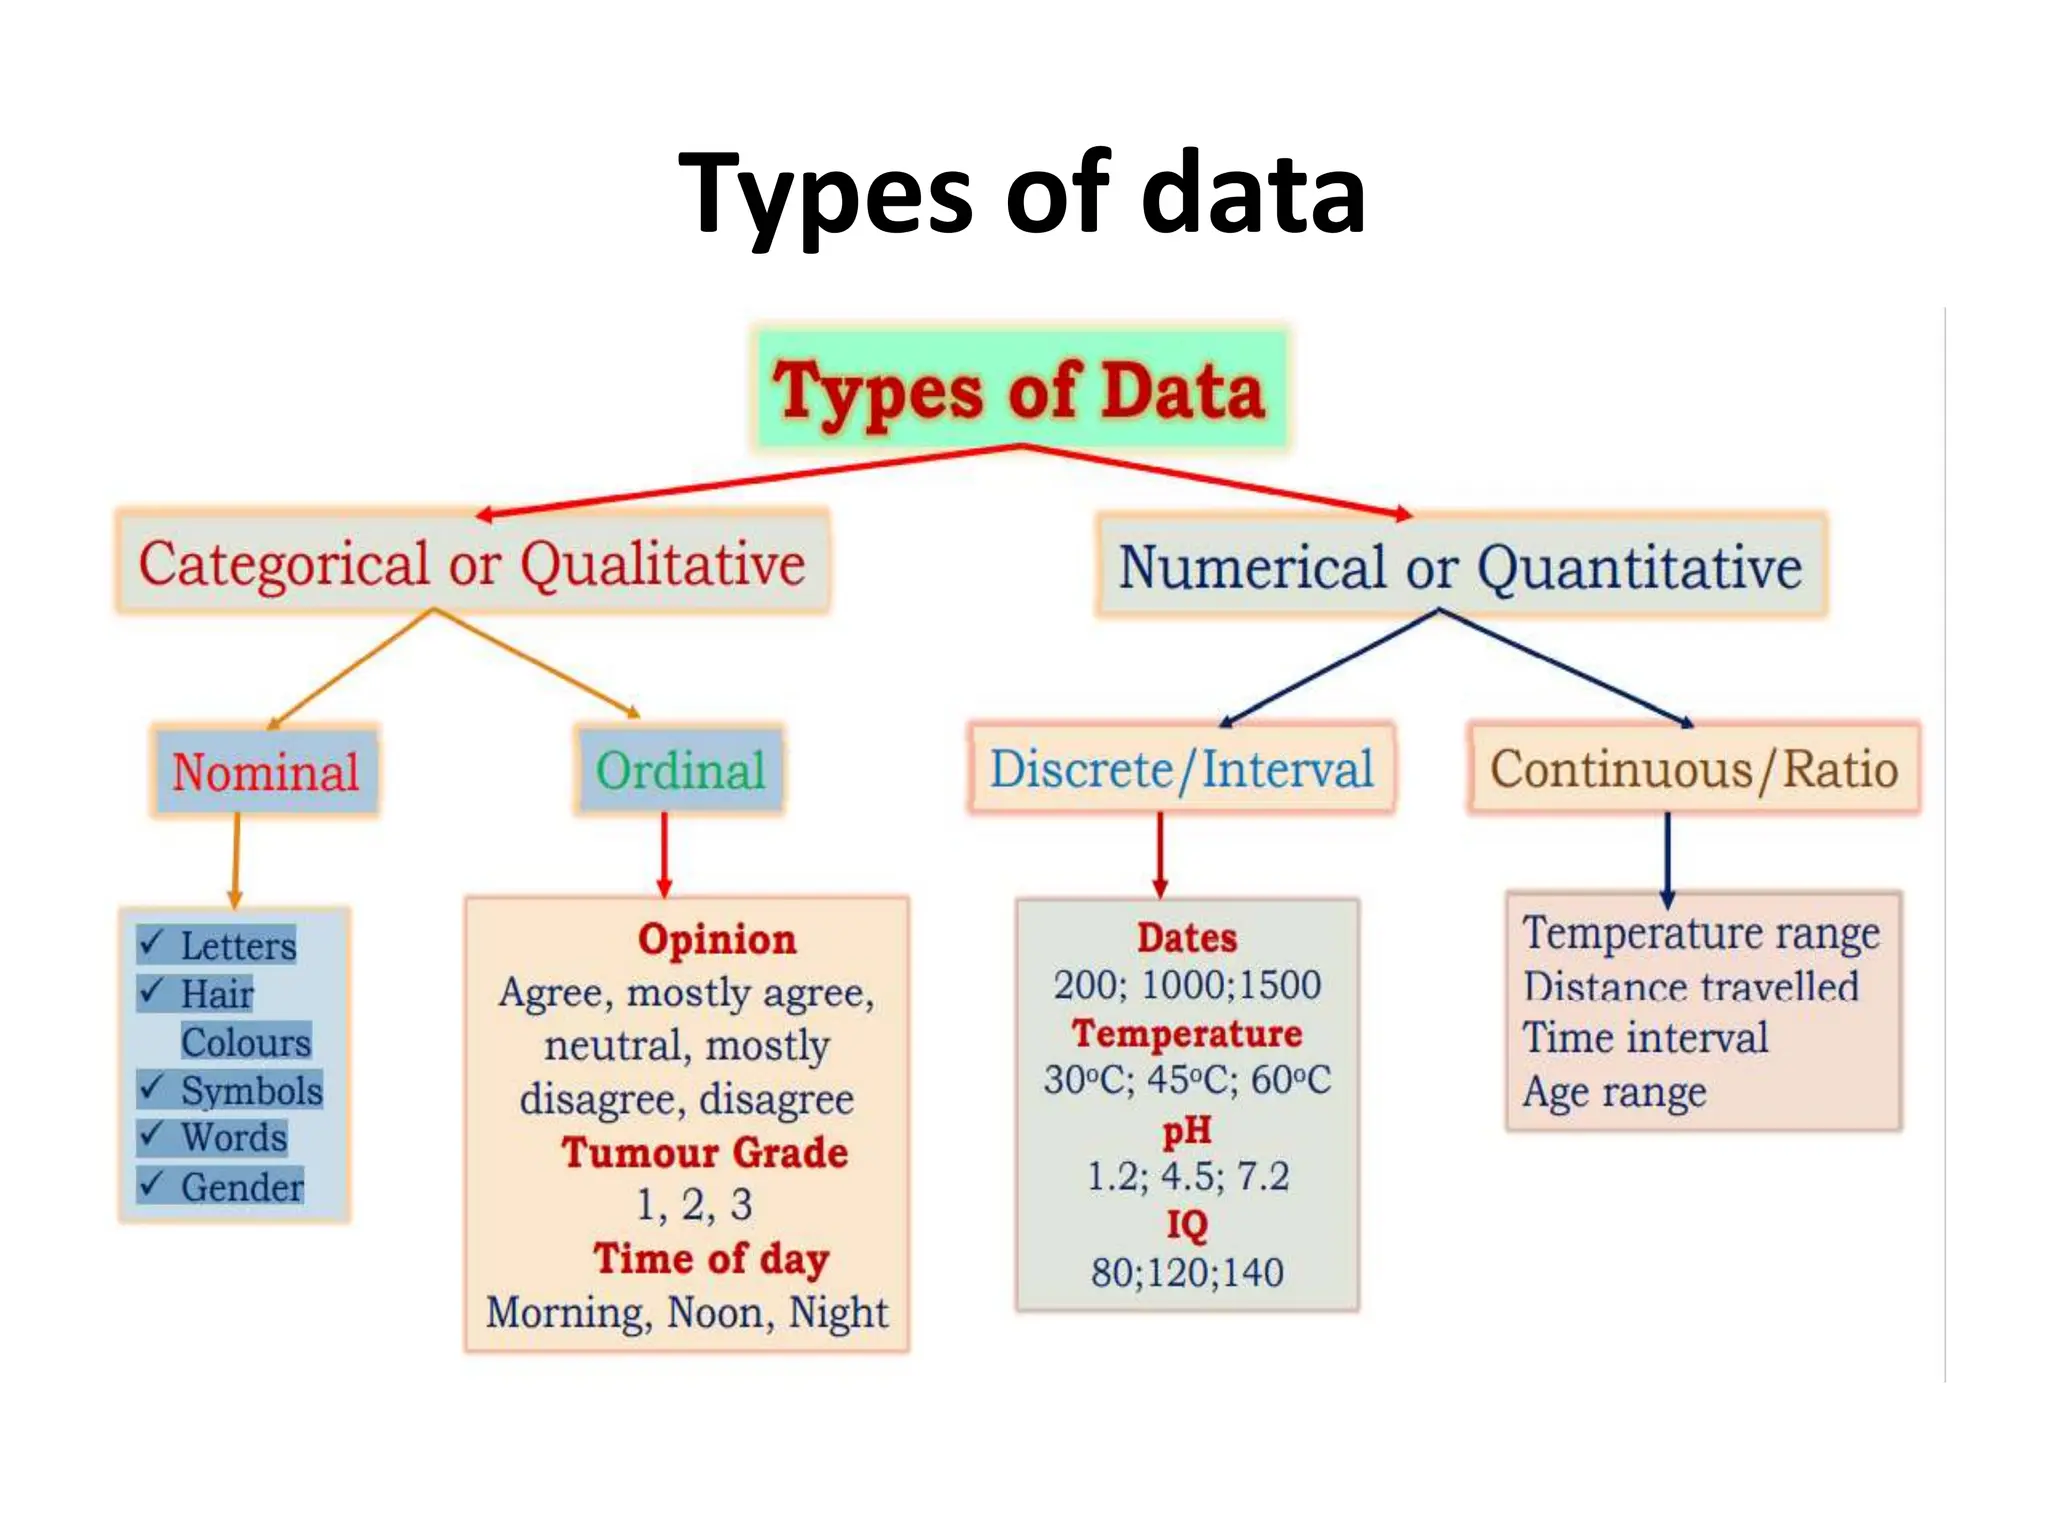
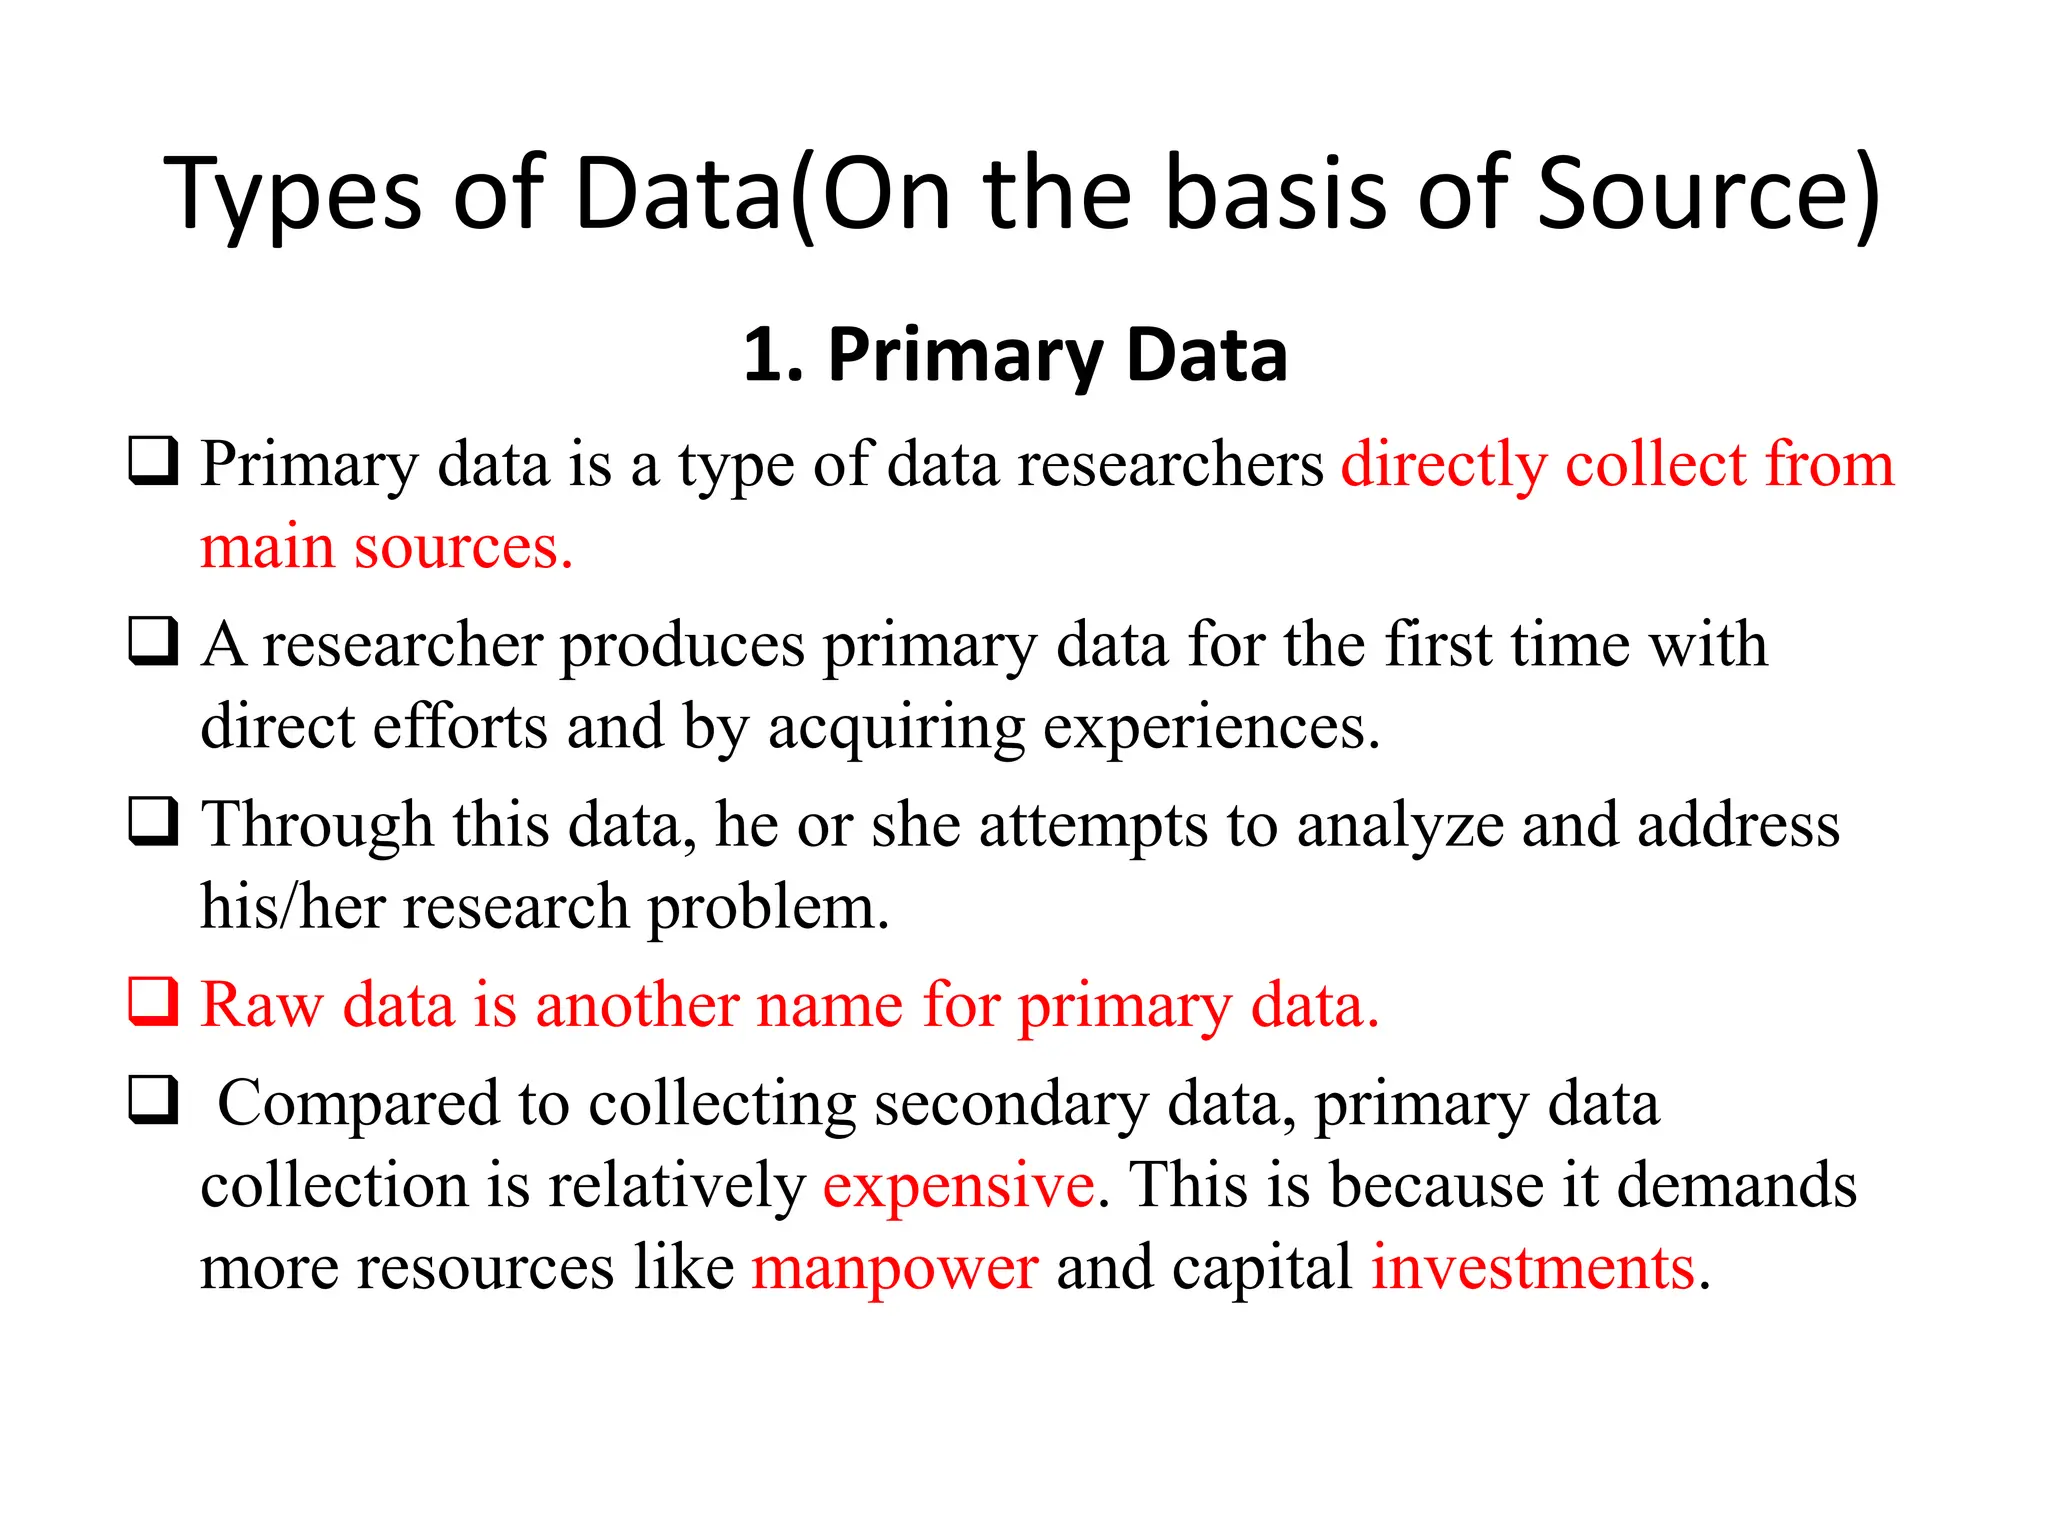
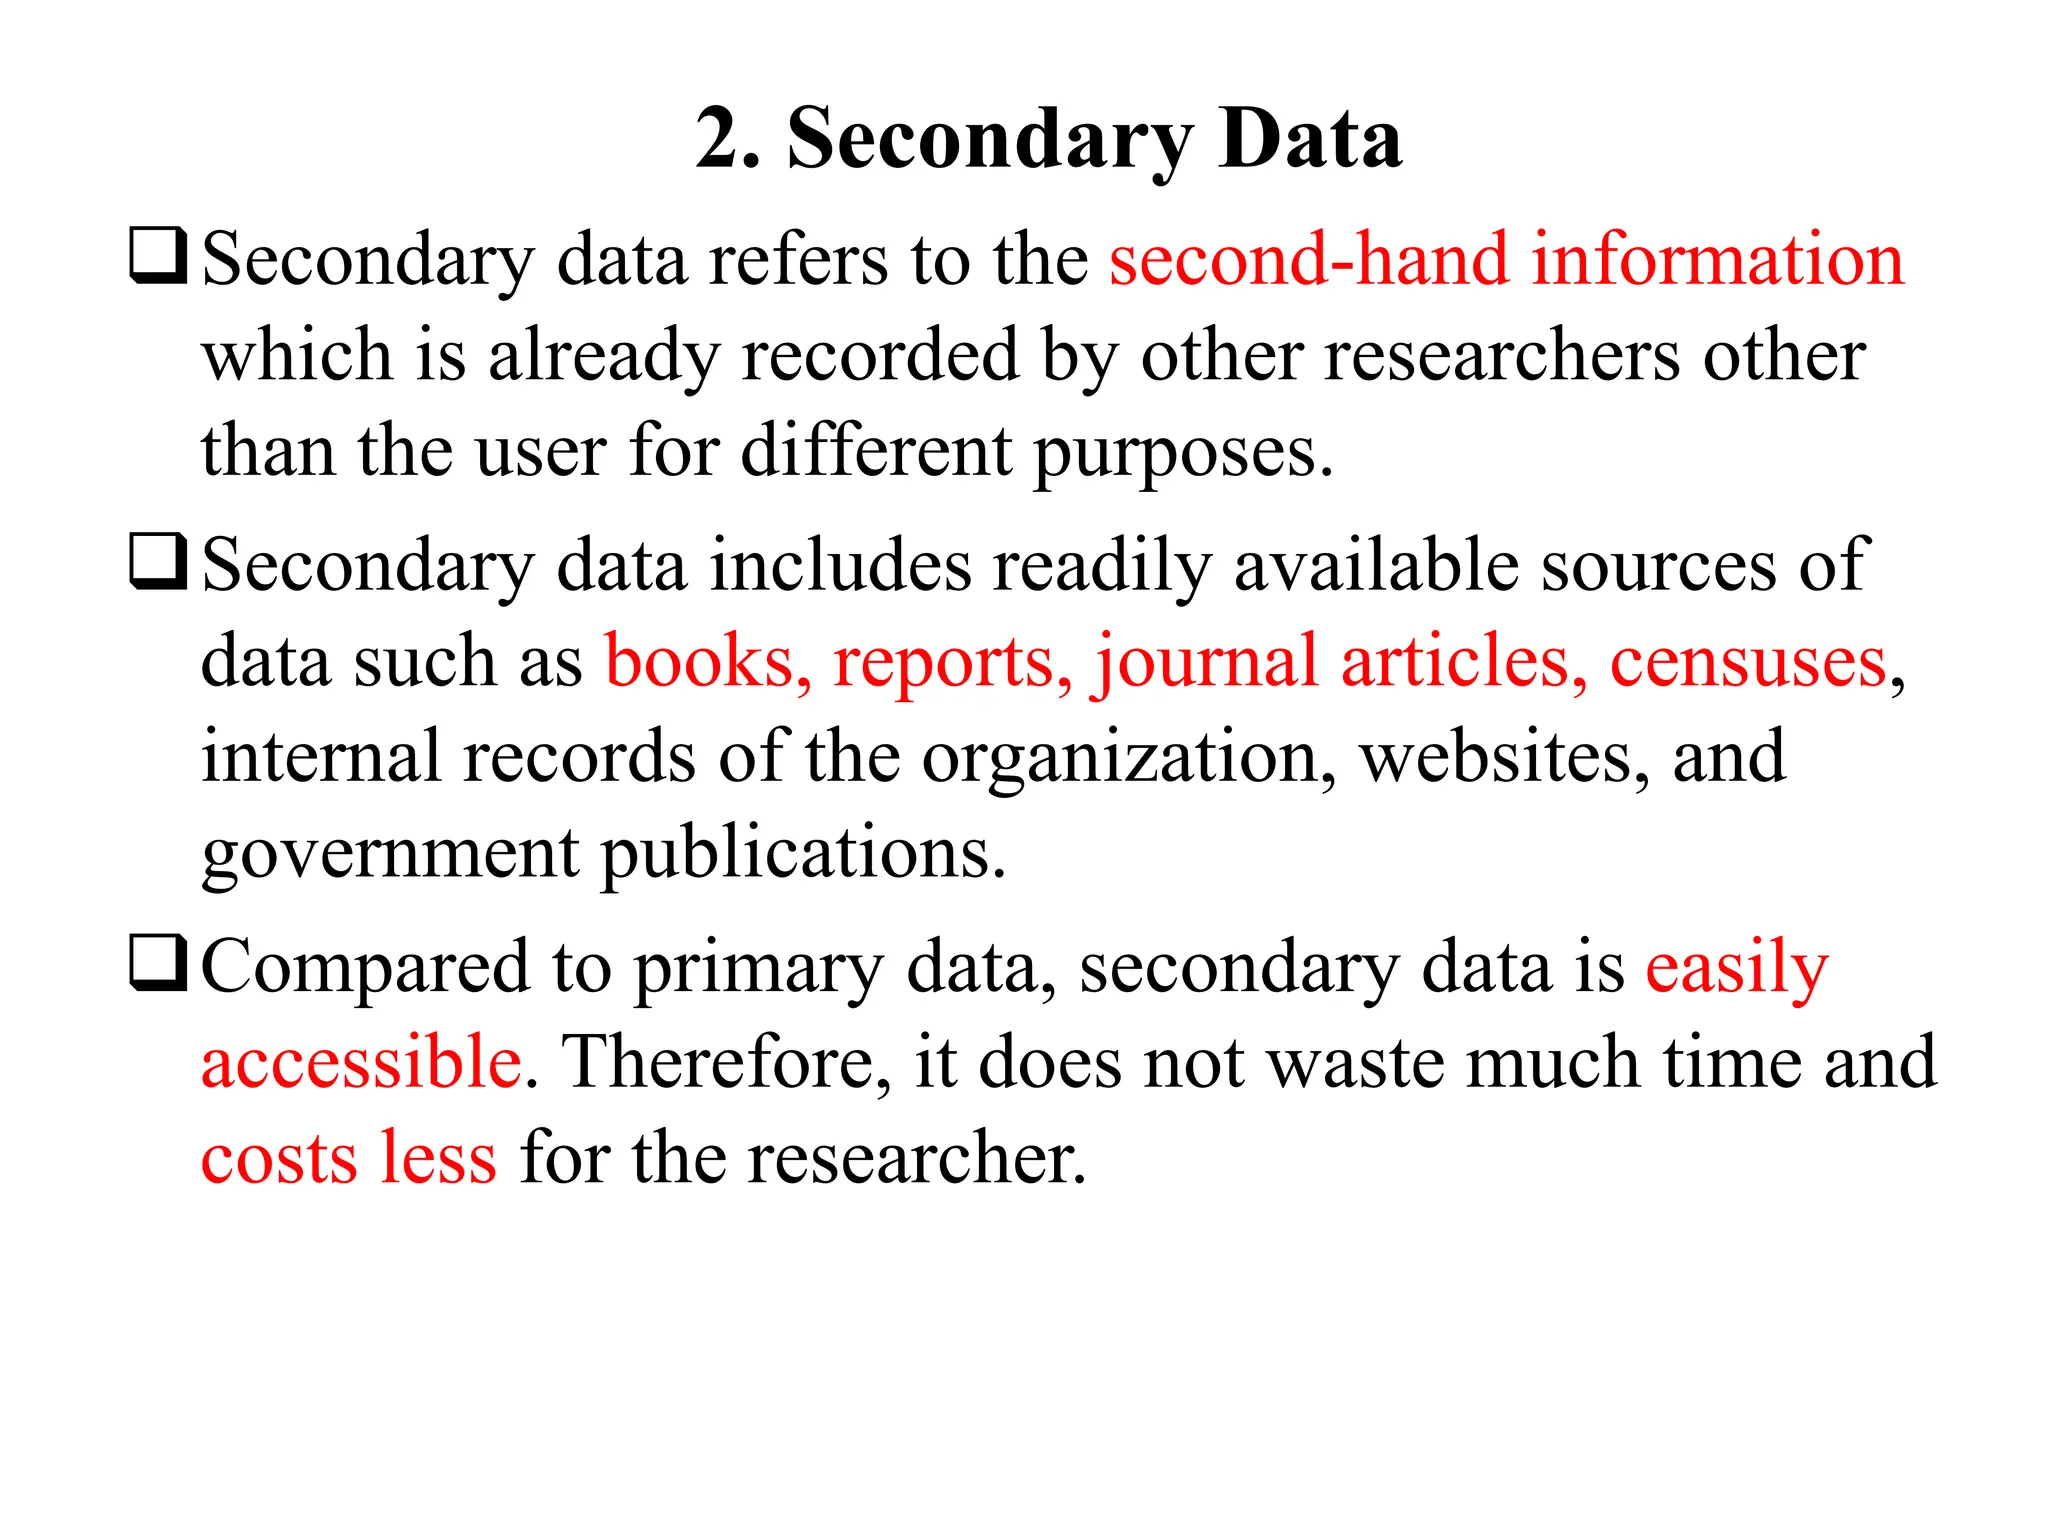
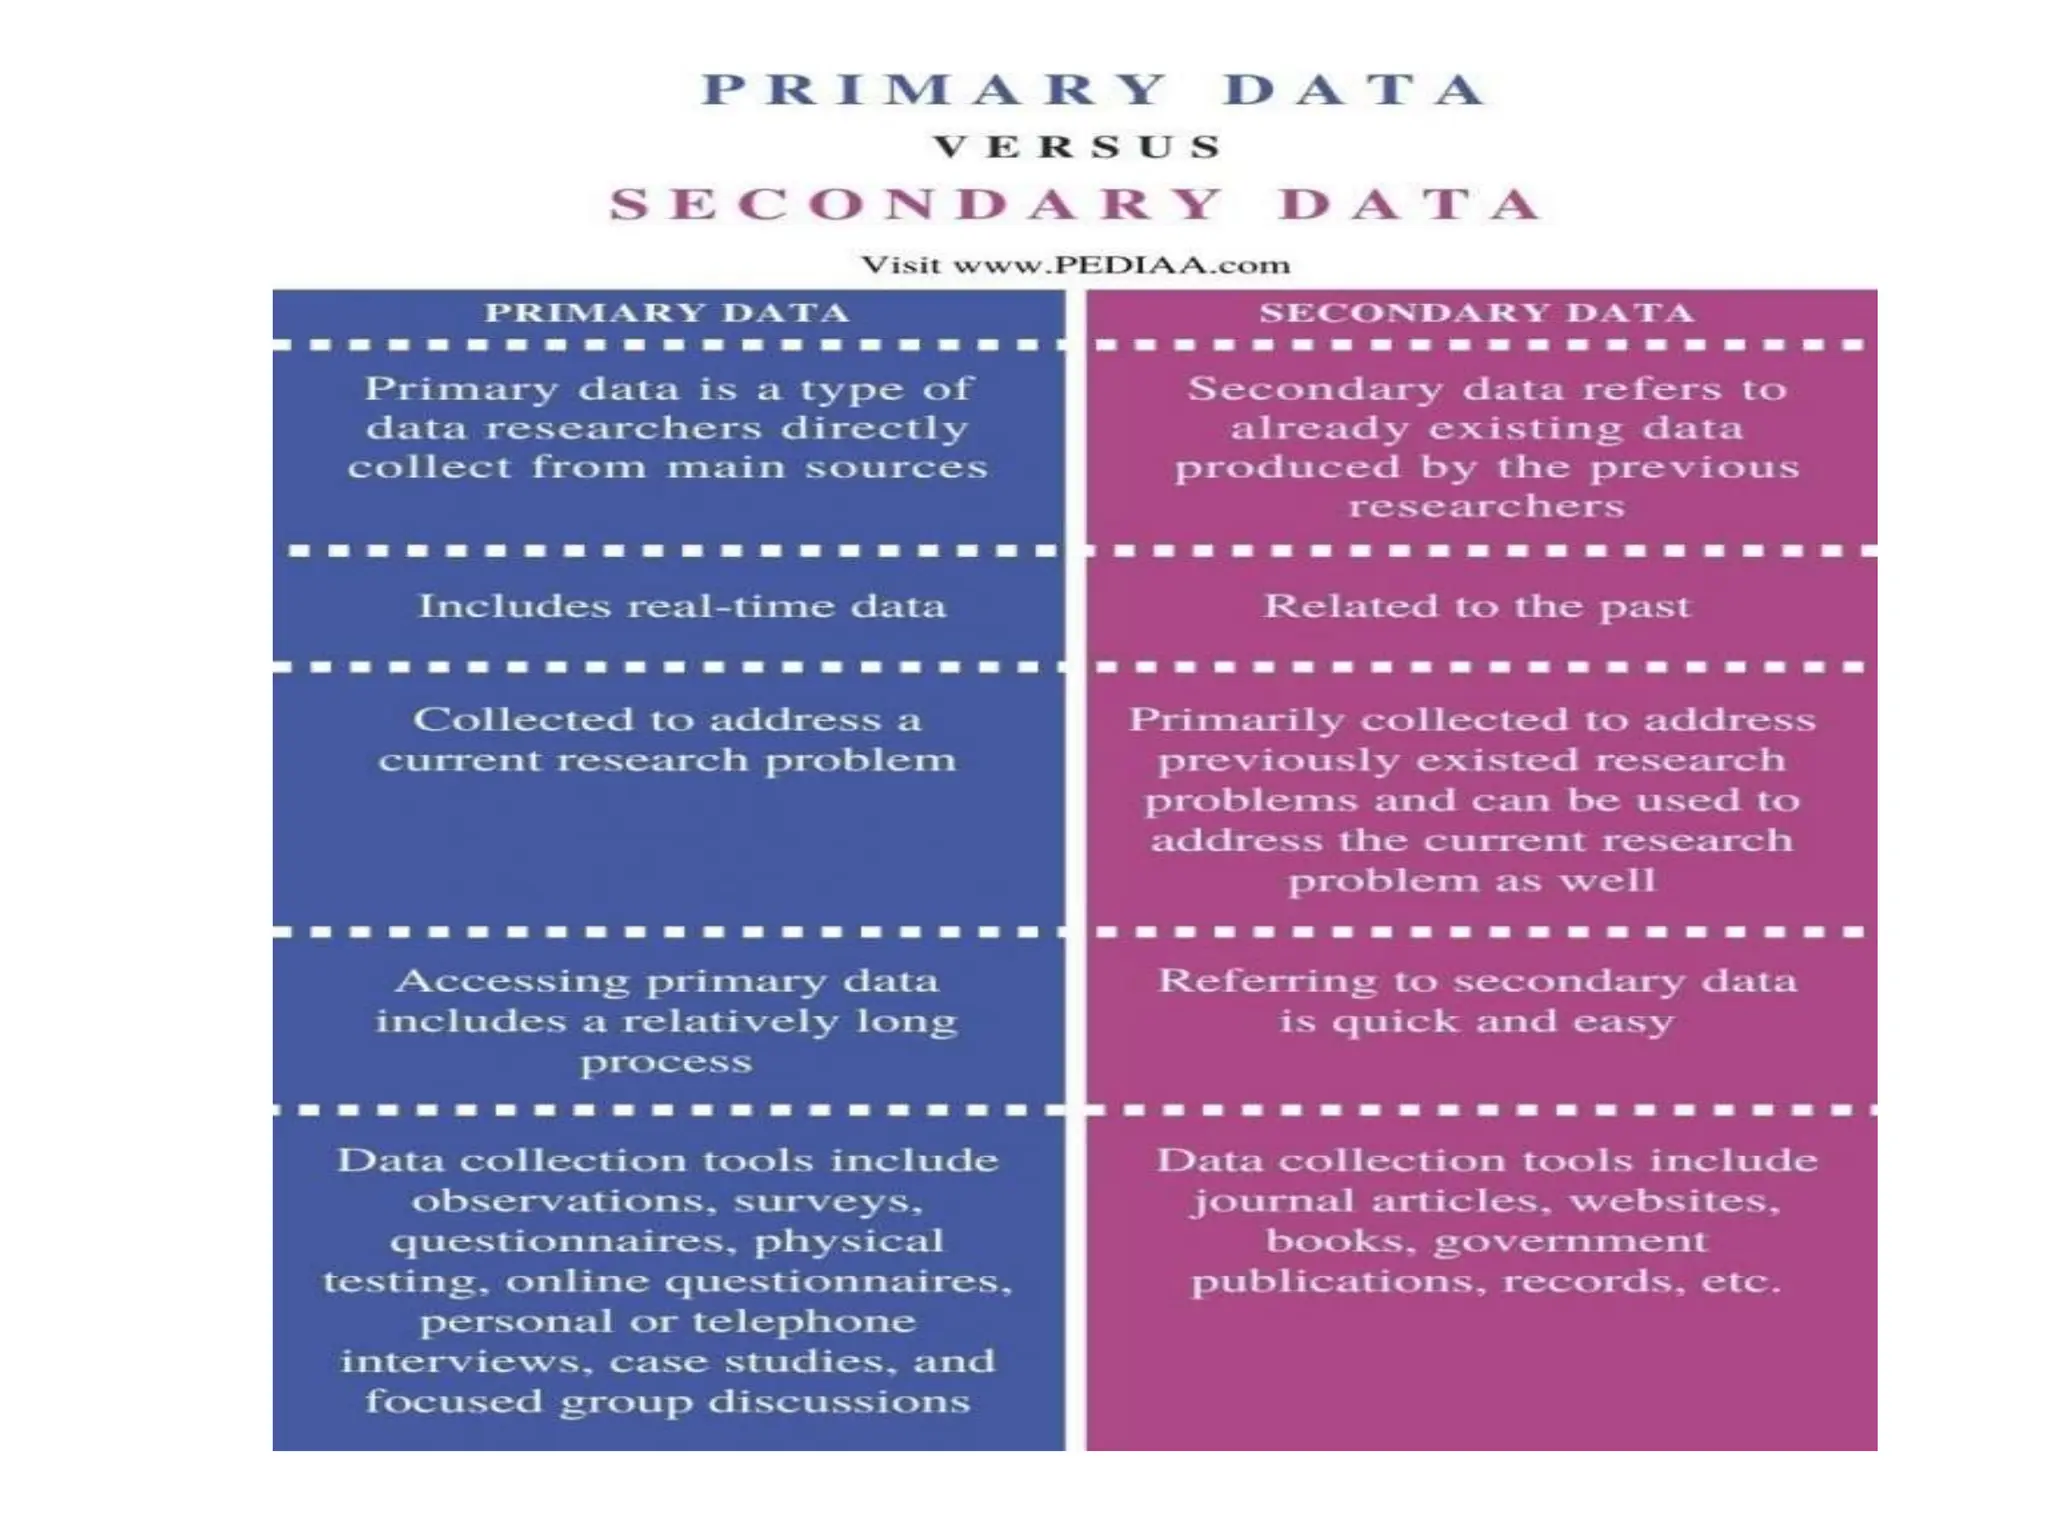
Introduction to Data Science
BCAT-212
Unit-II
Statistics for Data Science
• The most important aspect of any Data Science
approach is how the information is processed.
• When we talk about developing insights out of
data it is basically digging out the possibilities.
• Those possibilities in Data Science are known as
Statistical Analysis.
• Math and Stats are the building blocks of Data
Science.
• Statistics is a Mathematical Science pertaining to
data collection, analysis, interpretation and
presentation.
Why Statistics in DS?
• Statistics is used to process complex problems in
the real world so that Data Scientists and Analysts
can look for meaningful trends and changes in
Data.
• In simple words, Statistics can be used to derive
meaningful insights from data by performing
mathematical computations on it.
• Several Statistical functions, principles and
algorithms are implemented to analyse raw data,
build a Statistical Model and infer or predict the
result.
Basic terminology of Statistics
• Population –
It is actually a collection of set of individuals or
objects or events whose properties are to be
analyzed.
• Sample –
It is the subset of a population.
Types of Statistics
1. Descriptive Statistics :
Descriptive statistics uses data that provides a
description of the population either through
numerical calculation or graph or table. It provides
a graphical summary of data. It is simply used for
summarizing objects, etc. There are two categories
in this as following below.
(a)Measure of central tendency –
Measure of central tendency is also known as
summary statistics that is used to represents the
center point or a particular value of a data set or
sample set.
Three common central tendency :
Mean, Median, Mode
(i) Mean : It is measure of average of all value in
a sample set.
For example,
• (ii) Median : It is measure of central value of a
sample set. In these, data set is ordered from
lowest to highest value and then finds exact
middle.
For example,
(iii) Mode :It is value most frequently arrived in
sample set. The value repeated most of time in
central set is actually mode.
For example,
(b)Measure of Variability
Measure of Variability is also known as measure of dispersion and used to
describe variability in a sample or population. In statistics, there are three
common measures of variability as shown below:
(i) Range : It is given measure of how to spread apart values in sample set or
data set. Thus, Range = Maximum value - Minimum value
(ii) Variance : It simply describes how much a random variable defers from
expected value and it is also computed as square of deviation.
Note: Standard deviation measures how far apart numbers are in a data
set. Standard deviation is the square root of the variance
(iii) Dispersion :It is measure of dispersion of set
of data from its mean. In statistics, dispersion
(also called variability, scatter, or spread) is the
extent to which a distribution is stretched or
squeezed.
• Coefficient of Dispersion
• Based on Range = (X max – X min) ⁄ (X max + X min).
• C.D. based on quartile deviation = (Q3 – Q1) ⁄
(Q3 + Q1).
• Based on mean deviation = Mean deviation/
average from which it is calculated.
2. Inferential Statistics
• Inferential Statistics makes inference and prediction about population
based on a sample of data taken from population.
• It generalizes a large dataset and applies probabilities to draw a
conclusion. It is simply used for explaining meaning of descriptive stats.
It is simply used to analyze, interpret result, and draw conclusion.
• Inferential Statistics is mainly related to and associated with hypothesis
testing whose main target is to reject null hypothesis.
• A null hypothesis refers to a hypothesis that states that there is no
relationship between two population parameters. Researchers reject or
disprove the null hypothesis to set the stage for further
experimentation or research
• Hypothesis testing is a type of inferential procedure that takes help of
sample data to evaluate and assess credibility of a hypothesis about a
population.
• Inferential statistics are generally used to determine how strong
relationship is within sample. But it is very difficult to obtain a
population list and draw a random sample.
Inferential statistics steps
1. Obtain and start with a theory.
2. Generate a research hypothesis.
3. Operationalize or use variables
4. Identify or find out population to which we can apply study
material.
5. Generate or form a null hypothesis for these population.
6. Collect and gather a sample of population and simply run
study.
7. Then, perform all tests of statistical to clarify if obtained
characteristics of sample are sufficiently different from
what would be expected under null hypothesis so that we
can be able to find and reject null hypothesis.
Types of inferential statistics
• Various types of inferential statistics are used
widely nowadays and are very easy to interpret.
These are given below:
• One sample test of difference/One sample
hypothesis test
• Contingency Tables and Chi-Square Statistic
• T-test or Anova
• Pearson Correlation
• Bi-variate Regression
• Multi-variate Regression
Types of data
Types of Data(On the basis of Source)
1. Primary Data
 Primary data is a type of data researchers directly collect from
main sources.
 A researcher produces primary data for the first time with
direct efforts and by acquiring experiences.
 Through this data, he or she attempts to analyze and address
his/her research problem.
 Raw data is another name for primary data.
 Compared to collecting secondary data, primary data
collection is relatively expensive. This is because it demands
more resources like manpower and capital investments.
2. Secondary Data
Secondary data refers to the second-hand information
which is already recorded by other researchers other
than the user for different purposes.
Secondary data includes readily available sources of
data such as books, reports, journal articles, censuses,
internal records of the organization, websites, and
government publications.
Compared to primary data, secondary data is easily
accessible. Therefore, it does not waste much time and
costs less for the researcher.
IDS-Unit-II. bachelor of computer applicatio notes

IDS-Unit-II. bachelor of computer applicatio notes

  • 1.
    Introduction to DataScience BCAT-212 Unit-II
  • 2.
    Statistics for DataScience • The most important aspect of any Data Science approach is how the information is processed. • When we talk about developing insights out of data it is basically digging out the possibilities. • Those possibilities in Data Science are known as Statistical Analysis. • Math and Stats are the building blocks of Data Science. • Statistics is a Mathematical Science pertaining to data collection, analysis, interpretation and presentation.
  • 3.
    Why Statistics inDS? • Statistics is used to process complex problems in the real world so that Data Scientists and Analysts can look for meaningful trends and changes in Data. • In simple words, Statistics can be used to derive meaningful insights from data by performing mathematical computations on it. • Several Statistical functions, principles and algorithms are implemented to analyse raw data, build a Statistical Model and infer or predict the result.
  • 4.
    Basic terminology ofStatistics • Population – It is actually a collection of set of individuals or objects or events whose properties are to be analyzed. • Sample – It is the subset of a population.
  • 5.
  • 6.
    1. Descriptive Statistics: Descriptive statistics uses data that provides a description of the population either through numerical calculation or graph or table. It provides a graphical summary of data. It is simply used for summarizing objects, etc. There are two categories in this as following below. (a)Measure of central tendency – Measure of central tendency is also known as summary statistics that is used to represents the center point or a particular value of a data set or sample set.
  • 7.
    Three common centraltendency : Mean, Median, Mode (i) Mean : It is measure of average of all value in a sample set. For example,
  • 8.
    • (ii) Median: It is measure of central value of a sample set. In these, data set is ordered from lowest to highest value and then finds exact middle. For example,
  • 9.
    (iii) Mode :Itis value most frequently arrived in sample set. The value repeated most of time in central set is actually mode. For example,
  • 10.
    (b)Measure of Variability Measureof Variability is also known as measure of dispersion and used to describe variability in a sample or population. In statistics, there are three common measures of variability as shown below: (i) Range : It is given measure of how to spread apart values in sample set or data set. Thus, Range = Maximum value - Minimum value (ii) Variance : It simply describes how much a random variable defers from expected value and it is also computed as square of deviation. Note: Standard deviation measures how far apart numbers are in a data set. Standard deviation is the square root of the variance
  • 11.
    (iii) Dispersion :Itis measure of dispersion of set of data from its mean. In statistics, dispersion (also called variability, scatter, or spread) is the extent to which a distribution is stretched or squeezed. • Coefficient of Dispersion • Based on Range = (X max – X min) ⁄ (X max + X min). • C.D. based on quartile deviation = (Q3 – Q1) ⁄ (Q3 + Q1). • Based on mean deviation = Mean deviation/ average from which it is calculated.
  • 12.
    2. Inferential Statistics •Inferential Statistics makes inference and prediction about population based on a sample of data taken from population. • It generalizes a large dataset and applies probabilities to draw a conclusion. It is simply used for explaining meaning of descriptive stats. It is simply used to analyze, interpret result, and draw conclusion. • Inferential Statistics is mainly related to and associated with hypothesis testing whose main target is to reject null hypothesis. • A null hypothesis refers to a hypothesis that states that there is no relationship between two population parameters. Researchers reject or disprove the null hypothesis to set the stage for further experimentation or research • Hypothesis testing is a type of inferential procedure that takes help of sample data to evaluate and assess credibility of a hypothesis about a population. • Inferential statistics are generally used to determine how strong relationship is within sample. But it is very difficult to obtain a population list and draw a random sample.
  • 13.
    Inferential statistics steps 1.Obtain and start with a theory. 2. Generate a research hypothesis. 3. Operationalize or use variables 4. Identify or find out population to which we can apply study material. 5. Generate or form a null hypothesis for these population. 6. Collect and gather a sample of population and simply run study. 7. Then, perform all tests of statistical to clarify if obtained characteristics of sample are sufficiently different from what would be expected under null hypothesis so that we can be able to find and reject null hypothesis.
  • 14.
    Types of inferentialstatistics • Various types of inferential statistics are used widely nowadays and are very easy to interpret. These are given below: • One sample test of difference/One sample hypothesis test • Contingency Tables and Chi-Square Statistic • T-test or Anova • Pearson Correlation • Bi-variate Regression • Multi-variate Regression
  • 15.
  • 16.
    Types of Data(Onthe basis of Source) 1. Primary Data  Primary data is a type of data researchers directly collect from main sources.  A researcher produces primary data for the first time with direct efforts and by acquiring experiences.  Through this data, he or she attempts to analyze and address his/her research problem.  Raw data is another name for primary data.  Compared to collecting secondary data, primary data collection is relatively expensive. This is because it demands more resources like manpower and capital investments.
  • 17.
    2. Secondary Data Secondarydata refers to the second-hand information which is already recorded by other researchers other than the user for different purposes. Secondary data includes readily available sources of data such as books, reports, journal articles, censuses, internal records of the organization, websites, and government publications. Compared to primary data, secondary data is easily accessible. Therefore, it does not waste much time and costs less for the researcher.