SlideShare a Scribd company logo
1 of 18
The Current Landscape (with a Little History)
 As per Metamarket CEO Mike Driscoll’s answer:Data science, as it’s practiced, is a blend of Red-
Bull-fueled hacking and espresso-inspired statistics.
 But data science is not merely hacking and data science is not merely statistics
 Data science is the civil engineering of data. Its acolytes possess a practical knowledge of tools
and materials, coupled with a theoretical understanding of what’s possible.
 Drew Conway’s Venn diagram of data science
Population and Sample
In statistics, population is the entire set of items from which you draw data for a statistical study.
It can be a group of individuals, a set of items, etc. It makes up the data pool for a study.
It can be a group of individuals, objects, events, organizations, etc. You use populations to draw
conclusions
An example of a population would be the entire student body at a school. It would contain all the
students who study in that school at the time of data collection. Depending on the problem
statement, data from each of these students is collected. An example is the students who speak
Hindi among the students of a school.
For the above situation, it is easy to collect data. The population is small and willing to provide
data and can be contacted. The data collected will be complete and reliable.
If you had to collect the same data from a larger population, say the entire country of India, it
would be impossible to draw reliable conclusions because of geographical and accessibility
constraints, not to mention time and resource constraints. A lot of data would be missing or
might be unreliable. Furthermore, due to accessibility issues, marginalized tribes or villages
might not provide data at all, making the data biased towards certain regions or groups.
Sample
 A sample represents the group of interest from the population, which you will
use to represent the data. The sample is an unbiased subset of the population
that best represents the whole data.
 To overcome the restraints of a population, you can sometimes collect data
from a subset of your population and then consider it as the general norm. You
collect the subset information from the groups who have taken part in the study,
making the data reliable. The results obtained for different groups who took part
in the study can be extrapolated to generalize for the population.
 The process of collecting data from a small subsection of the population and
then using it to generalize over the entire set is called Sampling.
 Samples are used when :
 The population is too large to collect data.
 The data collected is not reliable.
 The population is hypothetical and is unlimited in size.
 Take the example of a study that documents the results of a new medical procedure. It is unknown
how the procedure will affect people across the globe, so a test group is used to find out how people
react to it.
A sample should generally :
 • Satisfy all different variations present in the population as well as a well-defined selection criterion.
 • Be utterly unbiased on the properties of the objects being selected.
 • Be random to choose the objects of study fairly.
Say you are looking for a job in the IT sector, so you search online for IT jobs. The first search result
would be for jobs all around the world. But you want to work in India, so you search for IT jobs in India.
This would be your population. It would be impossible to go through and apply for all positions in the
listing. So you consider the top 30 jobs you are qualified for and satisfied with and apply for those. This
is your sample.
Statistical Modeling
 statistical modeling is a process using statistical models to analyze a set of data. Statistical
models are mathematical representations of the observed data.
 Statistical modeling methods are a powerful tool in understanding the consolidated data and
making generalized predictions using this data. A statistical model could be in the form of a
mathematical equation or a visual representation of the information.
Techniques in Statistical Modeling
There are several statistical modeling techniques used during data exploration. Here are some
of the common techniques:
1. Linear Regression
Linear regression uses a linear equation to model the relationship between two variables, where
one variable is dependent and the other is independent. If one independent variable is utilized to
predict a dependent variable, it is called simple linear regression. If more than one independent
variable is used to predict a dependent variable, it’s called a multiple linear regression.
For example, depending on a person’s height, age, and gender, a linear regression model may be
used to estimate their weight.
2. Classification
Classifications groups the data into different categories to allow for a more accurate
prediction and analysis. This technique can enable effective analysis of very large data sets.
There are two major techniques under classification:
 Logistic Regression
When the dependent variable is binary, the logistic regression technique is used to model and
predict the relationship between the binary variable and one or more independent variables.
Logistic regression models are used to represent the connection between a binary outcome
variable (for example, yes/no) and one or more predictor variables. For example, depending
on age, blood pressure, and cholesterol levels, a logistic regression model may be used to
predict if a patient would have a heart attack.
Discriminant Analysis
Here, two or more groups are known as prior and new observations are grouped into known clusters
based on the measured features. The distribution of the predictor variable X is modeled separately into
each of the response classes, Bayes’ theorem is then used to calculate the probability of each response
class, based on the value of X.
Let us consider an example of where the discriminant analysis can be used.
 Consider that you are in charge of the loan department at ABC bank. The bank manager asks you to
find a better way to give loans so bad debt and defaults are reduced. You have a financial
management background, so you decide to go with discriminant analysis to understand the problem
and find a solution. The creation of a credit risk profile for existing customers by a bank’s loan
department to determine whether new loan applicants pose a credit risk is a canonical example of
dynamic financial analysis.
 Resampling
In this technique, repeated samples are drawn from the original set of data,
creating a unique sampling distribution based on actual data. It uses experimental
methods as opposed to analytical methods to create a unique sampling
distribution. Since the samples drawn are unbiased, the estimates obtained are
also unbiased.
Bootstrapping
 This takes into account the data samples that weren’t selected in the initial
sample as are placement. The process is repeated several times and the
average score is calculated for the estimation of the model performance.
Cross-Validation
The training data is divided into k number of parts. Here, k – 1 parts are considered
training sets,
and the one remaining set is used as the test set. This is repeated k number of
times and the
average of the k scores are calculated as the performance estimation.
 Non-linear Models
Here the data under observation is modeled using a non-linear combination of
model parameters and this is dependent on one or more independent variables.
The data is then fitted using a method of successive approximations.
Example: Gold price and inflation --Even if the gold prices are stable to a great
extent, they are affected by inflation, crude oil, etc. But the important one is the
impact of inflation, and at the same time, gold prices can control the inflation
instability. Therefore, a deep understanding of the relationship between inflation
and gold price is a prerequisite.
In this case, nonlinear regression analysis is employed for analyzing data. The
dependent variable is gold price, and the independent variable is inflation. The
regression analysis results revealed that inflation impacts the gold price.
 Tree-Based Methods
In a tree-based method, the predictor space is segmented into different simple
regions. The set of splitting rules can be summarized in a tree, giving it the name
decision-tree method. This can be used for both, regression and classification
problems. Bagging, boosting, and random forest algorithm are some of the
approaches used in this method.
 Decision Tree Models
Unsupervised Learning
Unsupervised learning relies on the algorithm to identify a pattern in the data. Here
the categories of data are not known. For example, in clustering, closely related
items are grouped,making it a method of unsupervised learning.
unsupervised learning is a method we use to group data when no labels are
present. Since no labels are present, unsupervised learning methods are typically
applied to build a concise representation of the data so we can derive imaginative
content from it.
For example, if we were releasing a new product, we can use unsupervised
learning methods to identify who the target market for the new product will be: this
is because there is no historical information about who the target customer is and
their demographics.
Time Series
This forecasting model can be used to predict future values based on historical
values. It is used to identify the phenomenon represented by the data and then
integrated with other data to draw predictions for the future.
Time series forecasting is a technique for the prediction of events through a
sequence of time. It predicts future events by analyzing the trends of the past, on
the assumption that future trends will hold similar to historical trends. It is used
across many fields of study in various applications including: Astronomy.
Neural Networks
Modeled loosely on the human brain, these are algorithms designed to identify
patterns in the data. Neural networks have non-linear elements that process
information, called neurons. These are arranged in layers and normally executed in
parallel. Neural networks are being increasingly used to make predictions and
classifications as they have minimal demands on assumptions and model structure
and can approximate a wide range of models
Probability Distribution
Probability distribution is mathematical function which provide the possibilities
of occurrence of various possible outcome that can occur in an experiment.
There are many types of probability distribution .Following are five probability
distribution that mostly used in data science:
 Normal distribution
 Binomial distribution
 Bernoulli distribution
 Uniform distribution
 Poisson distribution
Normal distribution
Normal distribution is most important distribution ,because it fits in many natural
phenomenon.
 For instance :height,blood pressure,IQ score,etc
 • Normal distribution is also called as guassian distribution
 In graphical form, the normal distribution appears as a "bell curve".
A normal distribution is a type of continuous probability distribution in which
most data points cluster toward the middle of the range, while the rest taper off
symmetrically toward either extreme. The middle of the range is also known as
the mean of the distribution.
Binomial Distribution
 Binomial distribution is discrete distribution.
 Binomial distribution is used to represent probability of x success in n trial
,given success probability p in each trial.
 • If the distribution satisfies the below conditions then such distribution is
called as binomial distribution:
1. There should fixed number of trial.
2. It should have only two possible outcome.
3. Events should be independent.
4. Probability of getting success and failure should remain same
Bernoulli Distribution
 Bernoulli distribution is easiest distribution among all distributions.
 It is similar to binomial distribution. The only difference is it takes only one
trial while binomial distribution considers n trial.
 It has only two possible outcome ie success vs failure.
Let’s consider random variable X with only one parameter p which represents
probability of occurrence of event.
 It’s density function is given as :
P[X=1]=p
P[X=0]=1-p
Where,
X=1 indicates event has occurred
X=0 indicates event didn’t occured
Uniform Distribution
 Distribution is said to be a uniform distribution, if all the outcomes of event
have equal probabilities.
 Uniform distribution is also called rectangular distribution.
 Expected value of uniform distribution provides us no relevant information
 Since each outcome is equally likely both mean and variance are
uninterpretable.
 It does not have predictive power
Poisson Distribution
 Poisson distribution is discrete probability distribution.
 Poisson distribution is a distribution of count ie number of times event has
occurred in given interval of time.
 Poisson distribution can be used to predict probability of number of successful
event that may occur in specific interval of time.
 Example, if a call center received 50 calls in 1 hour, then using Poisson
distribution we can predict probability of getting 20 calls in next 30 minutes.
Data science notes for ASDS calicut 2.pptx

More Related Content

Similar to Data science notes for ASDS calicut 2.pptx

Stat11t Chapter1
Stat11t Chapter1Stat11t Chapter1
Stat11t Chapter1gueste87a4f
 
Real Estate Data Set
Real Estate Data SetReal Estate Data Set
Real Estate Data SetSarah Jimenez
 
Data Presentation & Analysis.pptx
Data Presentation & Analysis.pptxData Presentation & Analysis.pptx
Data Presentation & Analysis.pptxheencomm
 
Mb0050 research methodology
Mb0050   research methodologyMb0050   research methodology
Mb0050 research methodologysmumbahelp
 
Statistical ProcessesCan descriptive statistical processes b.docx
Statistical ProcessesCan descriptive statistical processes b.docxStatistical ProcessesCan descriptive statistical processes b.docx
Statistical ProcessesCan descriptive statistical processes b.docxdarwinming1
 
Exam Short Preparation on Data Analytics
Exam Short Preparation on Data AnalyticsExam Short Preparation on Data Analytics
Exam Short Preparation on Data AnalyticsHarsh Parekh
 
Need a nonplagiarised paper and a form completed by 1006015 before.docx
Need a nonplagiarised paper and a form completed by 1006015 before.docxNeed a nonplagiarised paper and a form completed by 1006015 before.docx
Need a nonplagiarised paper and a form completed by 1006015 before.docxlea6nklmattu
 
Statistical Learning and Model Selection module 2.pptx
Statistical Learning and Model Selection module 2.pptxStatistical Learning and Model Selection module 2.pptx
Statistical Learning and Model Selection module 2.pptxnagarajan740445
 
SPSS GuideAssessing Normality, Handling Missing Data, and Calculating Scores...
SPSS GuideAssessing Normality, Handling Missing Data, and Calculating  Scores...SPSS GuideAssessing Normality, Handling Missing Data, and Calculating  Scores...
SPSS GuideAssessing Normality, Handling Missing Data, and Calculating Scores...ahmedragab433449
 
Introduction to Statistics - Basics Statistics Concepts - Day 1- 8614 - B.Ed ...
Introduction to Statistics - Basics Statistics Concepts - Day 1- 8614 - B.Ed ...Introduction to Statistics - Basics Statistics Concepts - Day 1- 8614 - B.Ed ...
Introduction to Statistics - Basics Statistics Concepts - Day 1- 8614 - B.Ed ...EqraBaig
 
Research design decisions and be competent in the process of reliable data co...
Research design decisions and be competent in the process of reliable data co...Research design decisions and be competent in the process of reliable data co...
Research design decisions and be competent in the process of reliable data co...Stats Statswork
 
Certified Specialist Business Intelligence (.docx
Certified     Specialist     Business  Intelligence     (.docxCertified     Specialist     Business  Intelligence     (.docx
Certified Specialist Business Intelligence (.docxdurantheseldine
 
Running Head Data Mining in The Cloud .docx
Running Head Data Mining in The Cloud                            .docxRunning Head Data Mining in The Cloud                            .docx
Running Head Data Mining in The Cloud .docxhealdkathaleen
 

Similar to Data science notes for ASDS calicut 2.pptx (20)

Presentation of BRM.pptx
Presentation of BRM.pptxPresentation of BRM.pptx
Presentation of BRM.pptx
 
Stat11t chapter1
Stat11t chapter1Stat11t chapter1
Stat11t chapter1
 
Stat11t Chapter1
Stat11t Chapter1Stat11t Chapter1
Stat11t Chapter1
 
Real Estate Data Set
Real Estate Data SetReal Estate Data Set
Real Estate Data Set
 
Data Analysis
Data Analysis Data Analysis
Data Analysis
 
Data Presentation & Analysis.pptx
Data Presentation & Analysis.pptxData Presentation & Analysis.pptx
Data Presentation & Analysis.pptx
 
Mb0050 research methodology
Mb0050   research methodologyMb0050   research methodology
Mb0050 research methodology
 
Statistical ProcessesCan descriptive statistical processes b.docx
Statistical ProcessesCan descriptive statistical processes b.docxStatistical ProcessesCan descriptive statistical processes b.docx
Statistical ProcessesCan descriptive statistical processes b.docx
 
Exam Short Preparation on Data Analytics
Exam Short Preparation on Data AnalyticsExam Short Preparation on Data Analytics
Exam Short Preparation on Data Analytics
 
Need a nonplagiarised paper and a form completed by 1006015 before.docx
Need a nonplagiarised paper and a form completed by 1006015 before.docxNeed a nonplagiarised paper and a form completed by 1006015 before.docx
Need a nonplagiarised paper and a form completed by 1006015 before.docx
 
Statistical Learning and Model Selection module 2.pptx
Statistical Learning and Model Selection module 2.pptxStatistical Learning and Model Selection module 2.pptx
Statistical Learning and Model Selection module 2.pptx
 
Chapter-Four.pdf
Chapter-Four.pdfChapter-Four.pdf
Chapter-Four.pdf
 
SPSS GuideAssessing Normality, Handling Missing Data, and Calculating Scores...
SPSS GuideAssessing Normality, Handling Missing Data, and Calculating  Scores...SPSS GuideAssessing Normality, Handling Missing Data, and Calculating  Scores...
SPSS GuideAssessing Normality, Handling Missing Data, and Calculating Scores...
 
Introduction to Statistics - Basics Statistics Concepts - Day 1- 8614 - B.Ed ...
Introduction to Statistics - Basics Statistics Concepts - Day 1- 8614 - B.Ed ...Introduction to Statistics - Basics Statistics Concepts - Day 1- 8614 - B.Ed ...
Introduction to Statistics - Basics Statistics Concepts - Day 1- 8614 - B.Ed ...
 
Research design decisions and be competent in the process of reliable data co...
Research design decisions and be competent in the process of reliable data co...Research design decisions and be competent in the process of reliable data co...
Research design decisions and be competent in the process of reliable data co...
 
Certified Specialist Business Intelligence (.docx
Certified     Specialist     Business  Intelligence     (.docxCertified     Specialist     Business  Intelligence     (.docx
Certified Specialist Business Intelligence (.docx
 
Unit2
Unit2Unit2
Unit2
 
Data analysis aug-11
Data analysis aug-11Data analysis aug-11
Data analysis aug-11
 
Basic concept of statistics
Basic concept of statisticsBasic concept of statistics
Basic concept of statistics
 
Running Head Data Mining in The Cloud .docx
Running Head Data Mining in The Cloud                            .docxRunning Head Data Mining in The Cloud                            .docx
Running Head Data Mining in The Cloud .docx
 

Recently uploaded

FSB Advising Checklist - Orientation 2024
FSB Advising Checklist - Orientation 2024FSB Advising Checklist - Orientation 2024
FSB Advising Checklist - Orientation 2024Elizabeth Walsh
 
Wellbeing inclusion and digital dystopias.pptx
Wellbeing inclusion and digital dystopias.pptxWellbeing inclusion and digital dystopias.pptx
Wellbeing inclusion and digital dystopias.pptxJisc
 
AIM of Education-Teachers Training-2024.ppt
AIM of Education-Teachers Training-2024.pptAIM of Education-Teachers Training-2024.ppt
AIM of Education-Teachers Training-2024.pptNishitharanjan Rout
 
How to Manage Call for Tendor in Odoo 17
How to Manage Call for Tendor in Odoo 17How to Manage Call for Tendor in Odoo 17
How to Manage Call for Tendor in Odoo 17Celine George
 
Interdisciplinary_Insights_Data_Collection_Methods.pptx
Interdisciplinary_Insights_Data_Collection_Methods.pptxInterdisciplinary_Insights_Data_Collection_Methods.pptx
Interdisciplinary_Insights_Data_Collection_Methods.pptxPooja Bhuva
 
The basics of sentences session 3pptx.pptx
The basics of sentences session 3pptx.pptxThe basics of sentences session 3pptx.pptx
The basics of sentences session 3pptx.pptxheathfieldcps1
 
Single or Multiple melodic lines structure
Single or Multiple melodic lines structureSingle or Multiple melodic lines structure
Single or Multiple melodic lines structuredhanjurrannsibayan2
 
21st_Century_Skills_Framework_Final_Presentation_2.pptx
21st_Century_Skills_Framework_Final_Presentation_2.pptx21st_Century_Skills_Framework_Final_Presentation_2.pptx
21st_Century_Skills_Framework_Final_Presentation_2.pptxJoelynRubio1
 
Food safety_Challenges food safety laboratories_.pdf
Food safety_Challenges food safety laboratories_.pdfFood safety_Challenges food safety laboratories_.pdf
Food safety_Challenges food safety laboratories_.pdfSherif Taha
 
Details on CBSE Compartment Exam.pptx1111
Details on CBSE Compartment Exam.pptx1111Details on CBSE Compartment Exam.pptx1111
Details on CBSE Compartment Exam.pptx1111GangaMaiya1
 
On_Translating_a_Tamil_Poem_by_A_K_Ramanujan.pptx
On_Translating_a_Tamil_Poem_by_A_K_Ramanujan.pptxOn_Translating_a_Tamil_Poem_by_A_K_Ramanujan.pptx
On_Translating_a_Tamil_Poem_by_A_K_Ramanujan.pptxPooja Bhuva
 
HMCS Vancouver Pre-Deployment Brief - May 2024 (Web Version).pptx
HMCS Vancouver Pre-Deployment Brief - May 2024 (Web Version).pptxHMCS Vancouver Pre-Deployment Brief - May 2024 (Web Version).pptx
HMCS Vancouver Pre-Deployment Brief - May 2024 (Web Version).pptxmarlenawright1
 
TỔNG ÔN TẬP THI VÀO LỚP 10 MÔN TIẾNG ANH NĂM HỌC 2023 - 2024 CÓ ĐÁP ÁN (NGỮ Â...
TỔNG ÔN TẬP THI VÀO LỚP 10 MÔN TIẾNG ANH NĂM HỌC 2023 - 2024 CÓ ĐÁP ÁN (NGỮ Â...TỔNG ÔN TẬP THI VÀO LỚP 10 MÔN TIẾNG ANH NĂM HỌC 2023 - 2024 CÓ ĐÁP ÁN (NGỮ Â...
TỔNG ÔN TẬP THI VÀO LỚP 10 MÔN TIẾNG ANH NĂM HỌC 2023 - 2024 CÓ ĐÁP ÁN (NGỮ Â...Nguyen Thanh Tu Collection
 
On National Teacher Day, meet the 2024-25 Kenan Fellows
On National Teacher Day, meet the 2024-25 Kenan FellowsOn National Teacher Day, meet the 2024-25 Kenan Fellows
On National Teacher Day, meet the 2024-25 Kenan FellowsMebane Rash
 
How to Create and Manage Wizard in Odoo 17
How to Create and Manage Wizard in Odoo 17How to Create and Manage Wizard in Odoo 17
How to Create and Manage Wizard in Odoo 17Celine George
 
80 ĐỀ THI THỬ TUYỂN SINH TIẾNG ANH VÀO 10 SỞ GD – ĐT THÀNH PHỐ HỒ CHÍ MINH NĂ...
80 ĐỀ THI THỬ TUYỂN SINH TIẾNG ANH VÀO 10 SỞ GD – ĐT THÀNH PHỐ HỒ CHÍ MINH NĂ...80 ĐỀ THI THỬ TUYỂN SINH TIẾNG ANH VÀO 10 SỞ GD – ĐT THÀNH PHỐ HỒ CHÍ MINH NĂ...
80 ĐỀ THI THỬ TUYỂN SINH TIẾNG ANH VÀO 10 SỞ GD – ĐT THÀNH PHỐ HỒ CHÍ MINH NĂ...Nguyen Thanh Tu Collection
 
Simple, Complex, and Compound Sentences Exercises.pdf
Simple, Complex, and Compound Sentences Exercises.pdfSimple, Complex, and Compound Sentences Exercises.pdf
Simple, Complex, and Compound Sentences Exercises.pdfstareducators107
 
How to Manage Global Discount in Odoo 17 POS
How to Manage Global Discount in Odoo 17 POSHow to Manage Global Discount in Odoo 17 POS
How to Manage Global Discount in Odoo 17 POSCeline George
 
Towards a code of practice for AI in AT.pptx
Towards a code of practice for AI in AT.pptxTowards a code of practice for AI in AT.pptx
Towards a code of practice for AI in AT.pptxJisc
 
NO1 Top Black Magic Specialist In Lahore Black magic In Pakistan Kala Ilam Ex...
NO1 Top Black Magic Specialist In Lahore Black magic In Pakistan Kala Ilam Ex...NO1 Top Black Magic Specialist In Lahore Black magic In Pakistan Kala Ilam Ex...
NO1 Top Black Magic Specialist In Lahore Black magic In Pakistan Kala Ilam Ex...Amil baba
 

Recently uploaded (20)

FSB Advising Checklist - Orientation 2024
FSB Advising Checklist - Orientation 2024FSB Advising Checklist - Orientation 2024
FSB Advising Checklist - Orientation 2024
 
Wellbeing inclusion and digital dystopias.pptx
Wellbeing inclusion and digital dystopias.pptxWellbeing inclusion and digital dystopias.pptx
Wellbeing inclusion and digital dystopias.pptx
 
AIM of Education-Teachers Training-2024.ppt
AIM of Education-Teachers Training-2024.pptAIM of Education-Teachers Training-2024.ppt
AIM of Education-Teachers Training-2024.ppt
 
How to Manage Call for Tendor in Odoo 17
How to Manage Call for Tendor in Odoo 17How to Manage Call for Tendor in Odoo 17
How to Manage Call for Tendor in Odoo 17
 
Interdisciplinary_Insights_Data_Collection_Methods.pptx
Interdisciplinary_Insights_Data_Collection_Methods.pptxInterdisciplinary_Insights_Data_Collection_Methods.pptx
Interdisciplinary_Insights_Data_Collection_Methods.pptx
 
The basics of sentences session 3pptx.pptx
The basics of sentences session 3pptx.pptxThe basics of sentences session 3pptx.pptx
The basics of sentences session 3pptx.pptx
 
Single or Multiple melodic lines structure
Single or Multiple melodic lines structureSingle or Multiple melodic lines structure
Single or Multiple melodic lines structure
 
21st_Century_Skills_Framework_Final_Presentation_2.pptx
21st_Century_Skills_Framework_Final_Presentation_2.pptx21st_Century_Skills_Framework_Final_Presentation_2.pptx
21st_Century_Skills_Framework_Final_Presentation_2.pptx
 
Food safety_Challenges food safety laboratories_.pdf
Food safety_Challenges food safety laboratories_.pdfFood safety_Challenges food safety laboratories_.pdf
Food safety_Challenges food safety laboratories_.pdf
 
Details on CBSE Compartment Exam.pptx1111
Details on CBSE Compartment Exam.pptx1111Details on CBSE Compartment Exam.pptx1111
Details on CBSE Compartment Exam.pptx1111
 
On_Translating_a_Tamil_Poem_by_A_K_Ramanujan.pptx
On_Translating_a_Tamil_Poem_by_A_K_Ramanujan.pptxOn_Translating_a_Tamil_Poem_by_A_K_Ramanujan.pptx
On_Translating_a_Tamil_Poem_by_A_K_Ramanujan.pptx
 
HMCS Vancouver Pre-Deployment Brief - May 2024 (Web Version).pptx
HMCS Vancouver Pre-Deployment Brief - May 2024 (Web Version).pptxHMCS Vancouver Pre-Deployment Brief - May 2024 (Web Version).pptx
HMCS Vancouver Pre-Deployment Brief - May 2024 (Web Version).pptx
 
TỔNG ÔN TẬP THI VÀO LỚP 10 MÔN TIẾNG ANH NĂM HỌC 2023 - 2024 CÓ ĐÁP ÁN (NGỮ Â...
TỔNG ÔN TẬP THI VÀO LỚP 10 MÔN TIẾNG ANH NĂM HỌC 2023 - 2024 CÓ ĐÁP ÁN (NGỮ Â...TỔNG ÔN TẬP THI VÀO LỚP 10 MÔN TIẾNG ANH NĂM HỌC 2023 - 2024 CÓ ĐÁP ÁN (NGỮ Â...
TỔNG ÔN TẬP THI VÀO LỚP 10 MÔN TIẾNG ANH NĂM HỌC 2023 - 2024 CÓ ĐÁP ÁN (NGỮ Â...
 
On National Teacher Day, meet the 2024-25 Kenan Fellows
On National Teacher Day, meet the 2024-25 Kenan FellowsOn National Teacher Day, meet the 2024-25 Kenan Fellows
On National Teacher Day, meet the 2024-25 Kenan Fellows
 
How to Create and Manage Wizard in Odoo 17
How to Create and Manage Wizard in Odoo 17How to Create and Manage Wizard in Odoo 17
How to Create and Manage Wizard in Odoo 17
 
80 ĐỀ THI THỬ TUYỂN SINH TIẾNG ANH VÀO 10 SỞ GD – ĐT THÀNH PHỐ HỒ CHÍ MINH NĂ...
80 ĐỀ THI THỬ TUYỂN SINH TIẾNG ANH VÀO 10 SỞ GD – ĐT THÀNH PHỐ HỒ CHÍ MINH NĂ...80 ĐỀ THI THỬ TUYỂN SINH TIẾNG ANH VÀO 10 SỞ GD – ĐT THÀNH PHỐ HỒ CHÍ MINH NĂ...
80 ĐỀ THI THỬ TUYỂN SINH TIẾNG ANH VÀO 10 SỞ GD – ĐT THÀNH PHỐ HỒ CHÍ MINH NĂ...
 
Simple, Complex, and Compound Sentences Exercises.pdf
Simple, Complex, and Compound Sentences Exercises.pdfSimple, Complex, and Compound Sentences Exercises.pdf
Simple, Complex, and Compound Sentences Exercises.pdf
 
How to Manage Global Discount in Odoo 17 POS
How to Manage Global Discount in Odoo 17 POSHow to Manage Global Discount in Odoo 17 POS
How to Manage Global Discount in Odoo 17 POS
 
Towards a code of practice for AI in AT.pptx
Towards a code of practice for AI in AT.pptxTowards a code of practice for AI in AT.pptx
Towards a code of practice for AI in AT.pptx
 
NO1 Top Black Magic Specialist In Lahore Black magic In Pakistan Kala Ilam Ex...
NO1 Top Black Magic Specialist In Lahore Black magic In Pakistan Kala Ilam Ex...NO1 Top Black Magic Specialist In Lahore Black magic In Pakistan Kala Ilam Ex...
NO1 Top Black Magic Specialist In Lahore Black magic In Pakistan Kala Ilam Ex...
 

Data science notes for ASDS calicut 2.pptx

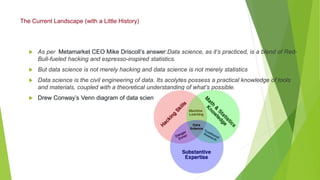
  • 1. The Current Landscape (with a Little History)  As per Metamarket CEO Mike Driscoll’s answer:Data science, as it’s practiced, is a blend of Red- Bull-fueled hacking and espresso-inspired statistics.  But data science is not merely hacking and data science is not merely statistics  Data science is the civil engineering of data. Its acolytes possess a practical knowledge of tools and materials, coupled with a theoretical understanding of what’s possible.  Drew Conway’s Venn diagram of data science
  • 2. Population and Sample In statistics, population is the entire set of items from which you draw data for a statistical study. It can be a group of individuals, a set of items, etc. It makes up the data pool for a study. It can be a group of individuals, objects, events, organizations, etc. You use populations to draw conclusions An example of a population would be the entire student body at a school. It would contain all the students who study in that school at the time of data collection. Depending on the problem statement, data from each of these students is collected. An example is the students who speak Hindi among the students of a school. For the above situation, it is easy to collect data. The population is small and willing to provide data and can be contacted. The data collected will be complete and reliable. If you had to collect the same data from a larger population, say the entire country of India, it would be impossible to draw reliable conclusions because of geographical and accessibility constraints, not to mention time and resource constraints. A lot of data would be missing or might be unreliable. Furthermore, due to accessibility issues, marginalized tribes or villages might not provide data at all, making the data biased towards certain regions or groups.
  • 3. Sample  A sample represents the group of interest from the population, which you will use to represent the data. The sample is an unbiased subset of the population that best represents the whole data.  To overcome the restraints of a population, you can sometimes collect data from a subset of your population and then consider it as the general norm. You collect the subset information from the groups who have taken part in the study, making the data reliable. The results obtained for different groups who took part in the study can be extrapolated to generalize for the population.  The process of collecting data from a small subsection of the population and then using it to generalize over the entire set is called Sampling.
  • 4.  Samples are used when :  The population is too large to collect data.  The data collected is not reliable.  The population is hypothetical and is unlimited in size.  Take the example of a study that documents the results of a new medical procedure. It is unknown how the procedure will affect people across the globe, so a test group is used to find out how people react to it. A sample should generally :  • Satisfy all different variations present in the population as well as a well-defined selection criterion.  • Be utterly unbiased on the properties of the objects being selected.  • Be random to choose the objects of study fairly. Say you are looking for a job in the IT sector, so you search online for IT jobs. The first search result would be for jobs all around the world. But you want to work in India, so you search for IT jobs in India. This would be your population. It would be impossible to go through and apply for all positions in the listing. So you consider the top 30 jobs you are qualified for and satisfied with and apply for those. This is your sample.
  • 5. Statistical Modeling  statistical modeling is a process using statistical models to analyze a set of data. Statistical models are mathematical representations of the observed data.  Statistical modeling methods are a powerful tool in understanding the consolidated data and making generalized predictions using this data. A statistical model could be in the form of a mathematical equation or a visual representation of the information. Techniques in Statistical Modeling There are several statistical modeling techniques used during data exploration. Here are some of the common techniques: 1. Linear Regression Linear regression uses a linear equation to model the relationship between two variables, where one variable is dependent and the other is independent. If one independent variable is utilized to predict a dependent variable, it is called simple linear regression. If more than one independent variable is used to predict a dependent variable, it’s called a multiple linear regression. For example, depending on a person’s height, age, and gender, a linear regression model may be used to estimate their weight.
  • 6. 2. Classification Classifications groups the data into different categories to allow for a more accurate prediction and analysis. This technique can enable effective analysis of very large data sets. There are two major techniques under classification:  Logistic Regression When the dependent variable is binary, the logistic regression technique is used to model and predict the relationship between the binary variable and one or more independent variables. Logistic regression models are used to represent the connection between a binary outcome variable (for example, yes/no) and one or more predictor variables. For example, depending on age, blood pressure, and cholesterol levels, a logistic regression model may be used to predict if a patient would have a heart attack. Discriminant Analysis Here, two or more groups are known as prior and new observations are grouped into known clusters based on the measured features. The distribution of the predictor variable X is modeled separately into each of the response classes, Bayes’ theorem is then used to calculate the probability of each response class, based on the value of X. Let us consider an example of where the discriminant analysis can be used.  Consider that you are in charge of the loan department at ABC bank. The bank manager asks you to find a better way to give loans so bad debt and defaults are reduced. You have a financial management background, so you decide to go with discriminant analysis to understand the problem and find a solution. The creation of a credit risk profile for existing customers by a bank’s loan department to determine whether new loan applicants pose a credit risk is a canonical example of dynamic financial analysis.
  • 7.  Resampling In this technique, repeated samples are drawn from the original set of data, creating a unique sampling distribution based on actual data. It uses experimental methods as opposed to analytical methods to create a unique sampling distribution. Since the samples drawn are unbiased, the estimates obtained are also unbiased. Bootstrapping  This takes into account the data samples that weren’t selected in the initial sample as are placement. The process is repeated several times and the average score is calculated for the estimation of the model performance. Cross-Validation The training data is divided into k number of parts. Here, k – 1 parts are considered training sets, and the one remaining set is used as the test set. This is repeated k number of times and the average of the k scores are calculated as the performance estimation.
  • 8.  Non-linear Models Here the data under observation is modeled using a non-linear combination of model parameters and this is dependent on one or more independent variables. The data is then fitted using a method of successive approximations. Example: Gold price and inflation --Even if the gold prices are stable to a great extent, they are affected by inflation, crude oil, etc. But the important one is the impact of inflation, and at the same time, gold prices can control the inflation instability. Therefore, a deep understanding of the relationship between inflation and gold price is a prerequisite. In this case, nonlinear regression analysis is employed for analyzing data. The dependent variable is gold price, and the independent variable is inflation. The regression analysis results revealed that inflation impacts the gold price.  Tree-Based Methods In a tree-based method, the predictor space is segmented into different simple regions. The set of splitting rules can be summarized in a tree, giving it the name decision-tree method. This can be used for both, regression and classification problems. Bagging, boosting, and random forest algorithm are some of the approaches used in this method.
  • 10. Unsupervised Learning Unsupervised learning relies on the algorithm to identify a pattern in the data. Here the categories of data are not known. For example, in clustering, closely related items are grouped,making it a method of unsupervised learning. unsupervised learning is a method we use to group data when no labels are present. Since no labels are present, unsupervised learning methods are typically applied to build a concise representation of the data so we can derive imaginative content from it. For example, if we were releasing a new product, we can use unsupervised learning methods to identify who the target market for the new product will be: this is because there is no historical information about who the target customer is and their demographics. Time Series This forecasting model can be used to predict future values based on historical values. It is used to identify the phenomenon represented by the data and then integrated with other data to draw predictions for the future. Time series forecasting is a technique for the prediction of events through a sequence of time. It predicts future events by analyzing the trends of the past, on the assumption that future trends will hold similar to historical trends. It is used across many fields of study in various applications including: Astronomy.
  • 11. Neural Networks Modeled loosely on the human brain, these are algorithms designed to identify patterns in the data. Neural networks have non-linear elements that process information, called neurons. These are arranged in layers and normally executed in parallel. Neural networks are being increasingly used to make predictions and classifications as they have minimal demands on assumptions and model structure and can approximate a wide range of models
  • 12. Probability Distribution Probability distribution is mathematical function which provide the possibilities of occurrence of various possible outcome that can occur in an experiment. There are many types of probability distribution .Following are five probability distribution that mostly used in data science:  Normal distribution  Binomial distribution  Bernoulli distribution  Uniform distribution  Poisson distribution
  • 13. Normal distribution Normal distribution is most important distribution ,because it fits in many natural phenomenon.  For instance :height,blood pressure,IQ score,etc  • Normal distribution is also called as guassian distribution  In graphical form, the normal distribution appears as a "bell curve". A normal distribution is a type of continuous probability distribution in which most data points cluster toward the middle of the range, while the rest taper off symmetrically toward either extreme. The middle of the range is also known as the mean of the distribution.
  • 14. Binomial Distribution  Binomial distribution is discrete distribution.  Binomial distribution is used to represent probability of x success in n trial ,given success probability p in each trial.  • If the distribution satisfies the below conditions then such distribution is called as binomial distribution: 1. There should fixed number of trial. 2. It should have only two possible outcome. 3. Events should be independent. 4. Probability of getting success and failure should remain same
  • 15. Bernoulli Distribution  Bernoulli distribution is easiest distribution among all distributions.  It is similar to binomial distribution. The only difference is it takes only one trial while binomial distribution considers n trial.  It has only two possible outcome ie success vs failure. Let’s consider random variable X with only one parameter p which represents probability of occurrence of event.  It’s density function is given as : P[X=1]=p P[X=0]=1-p Where, X=1 indicates event has occurred X=0 indicates event didn’t occured
  • 16. Uniform Distribution  Distribution is said to be a uniform distribution, if all the outcomes of event have equal probabilities.  Uniform distribution is also called rectangular distribution.  Expected value of uniform distribution provides us no relevant information  Since each outcome is equally likely both mean and variance are uninterpretable.  It does not have predictive power
  • 17. Poisson Distribution  Poisson distribution is discrete probability distribution.  Poisson distribution is a distribution of count ie number of times event has occurred in given interval of time.  Poisson distribution can be used to predict probability of number of successful event that may occur in specific interval of time.  Example, if a call center received 50 calls in 1 hour, then using Poisson distribution we can predict probability of getting 20 calls in next 30 minutes.