Downloaded 1,211 times
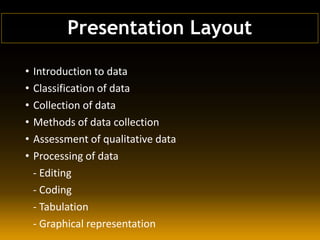


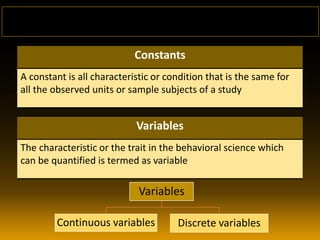
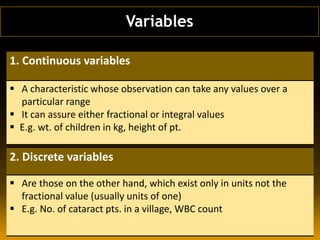
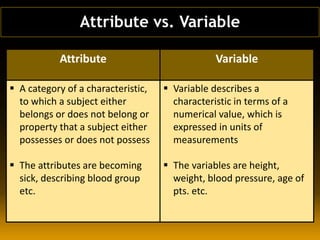

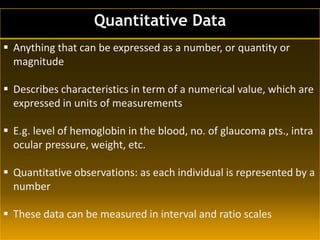


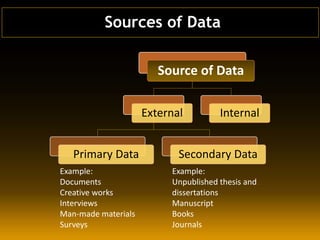


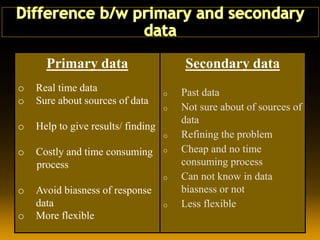

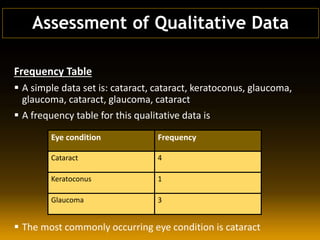
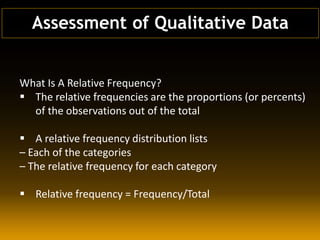
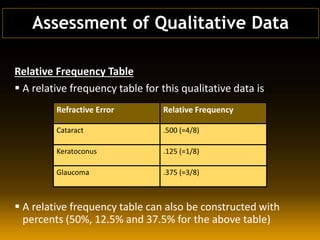


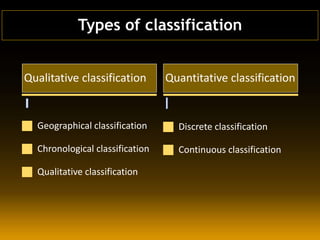
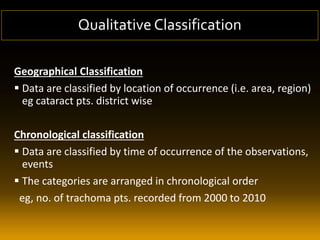

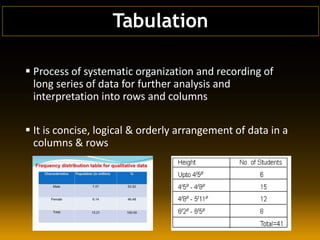


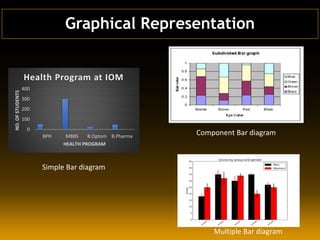


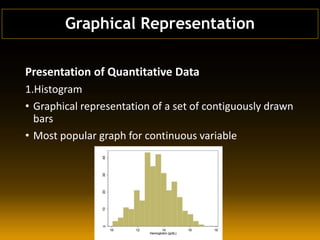


The document discusses various aspects of data collection, qualitative data assessment, and data processing. It highlights the differences between qualitative and quantitative data, their classification, collection methods, and processing techniques. Additionally, it emphasizes the importance of reliable data through proper collection and assessment methods for effective research outcomes.