Downloaded 26 times
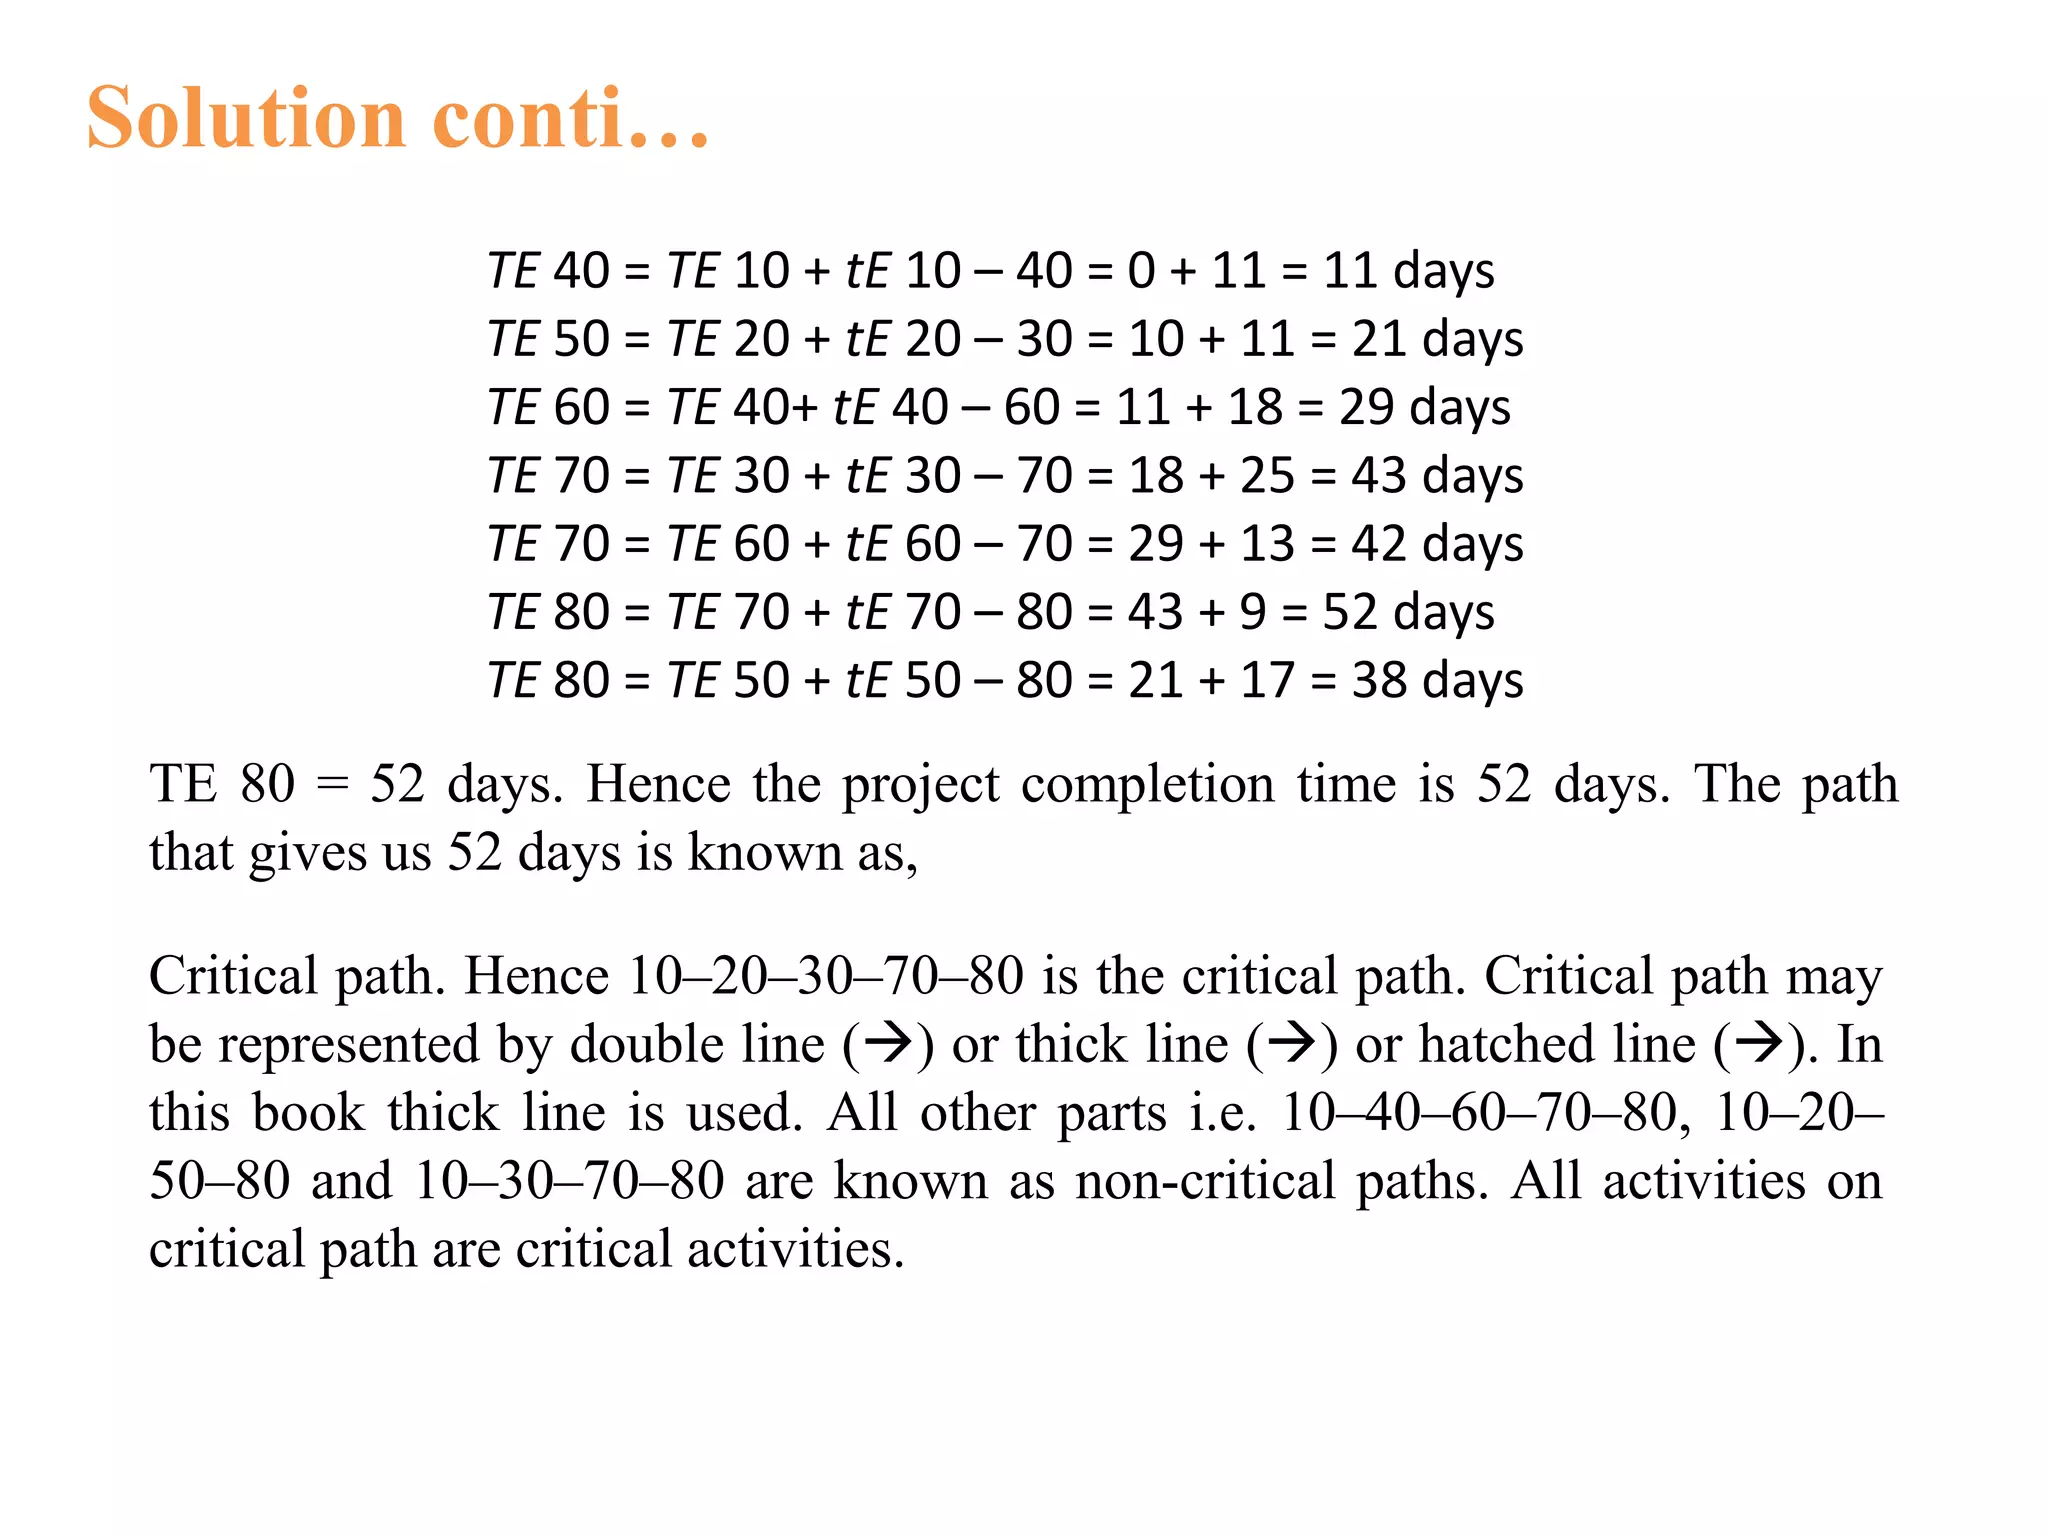
![Solution conti…
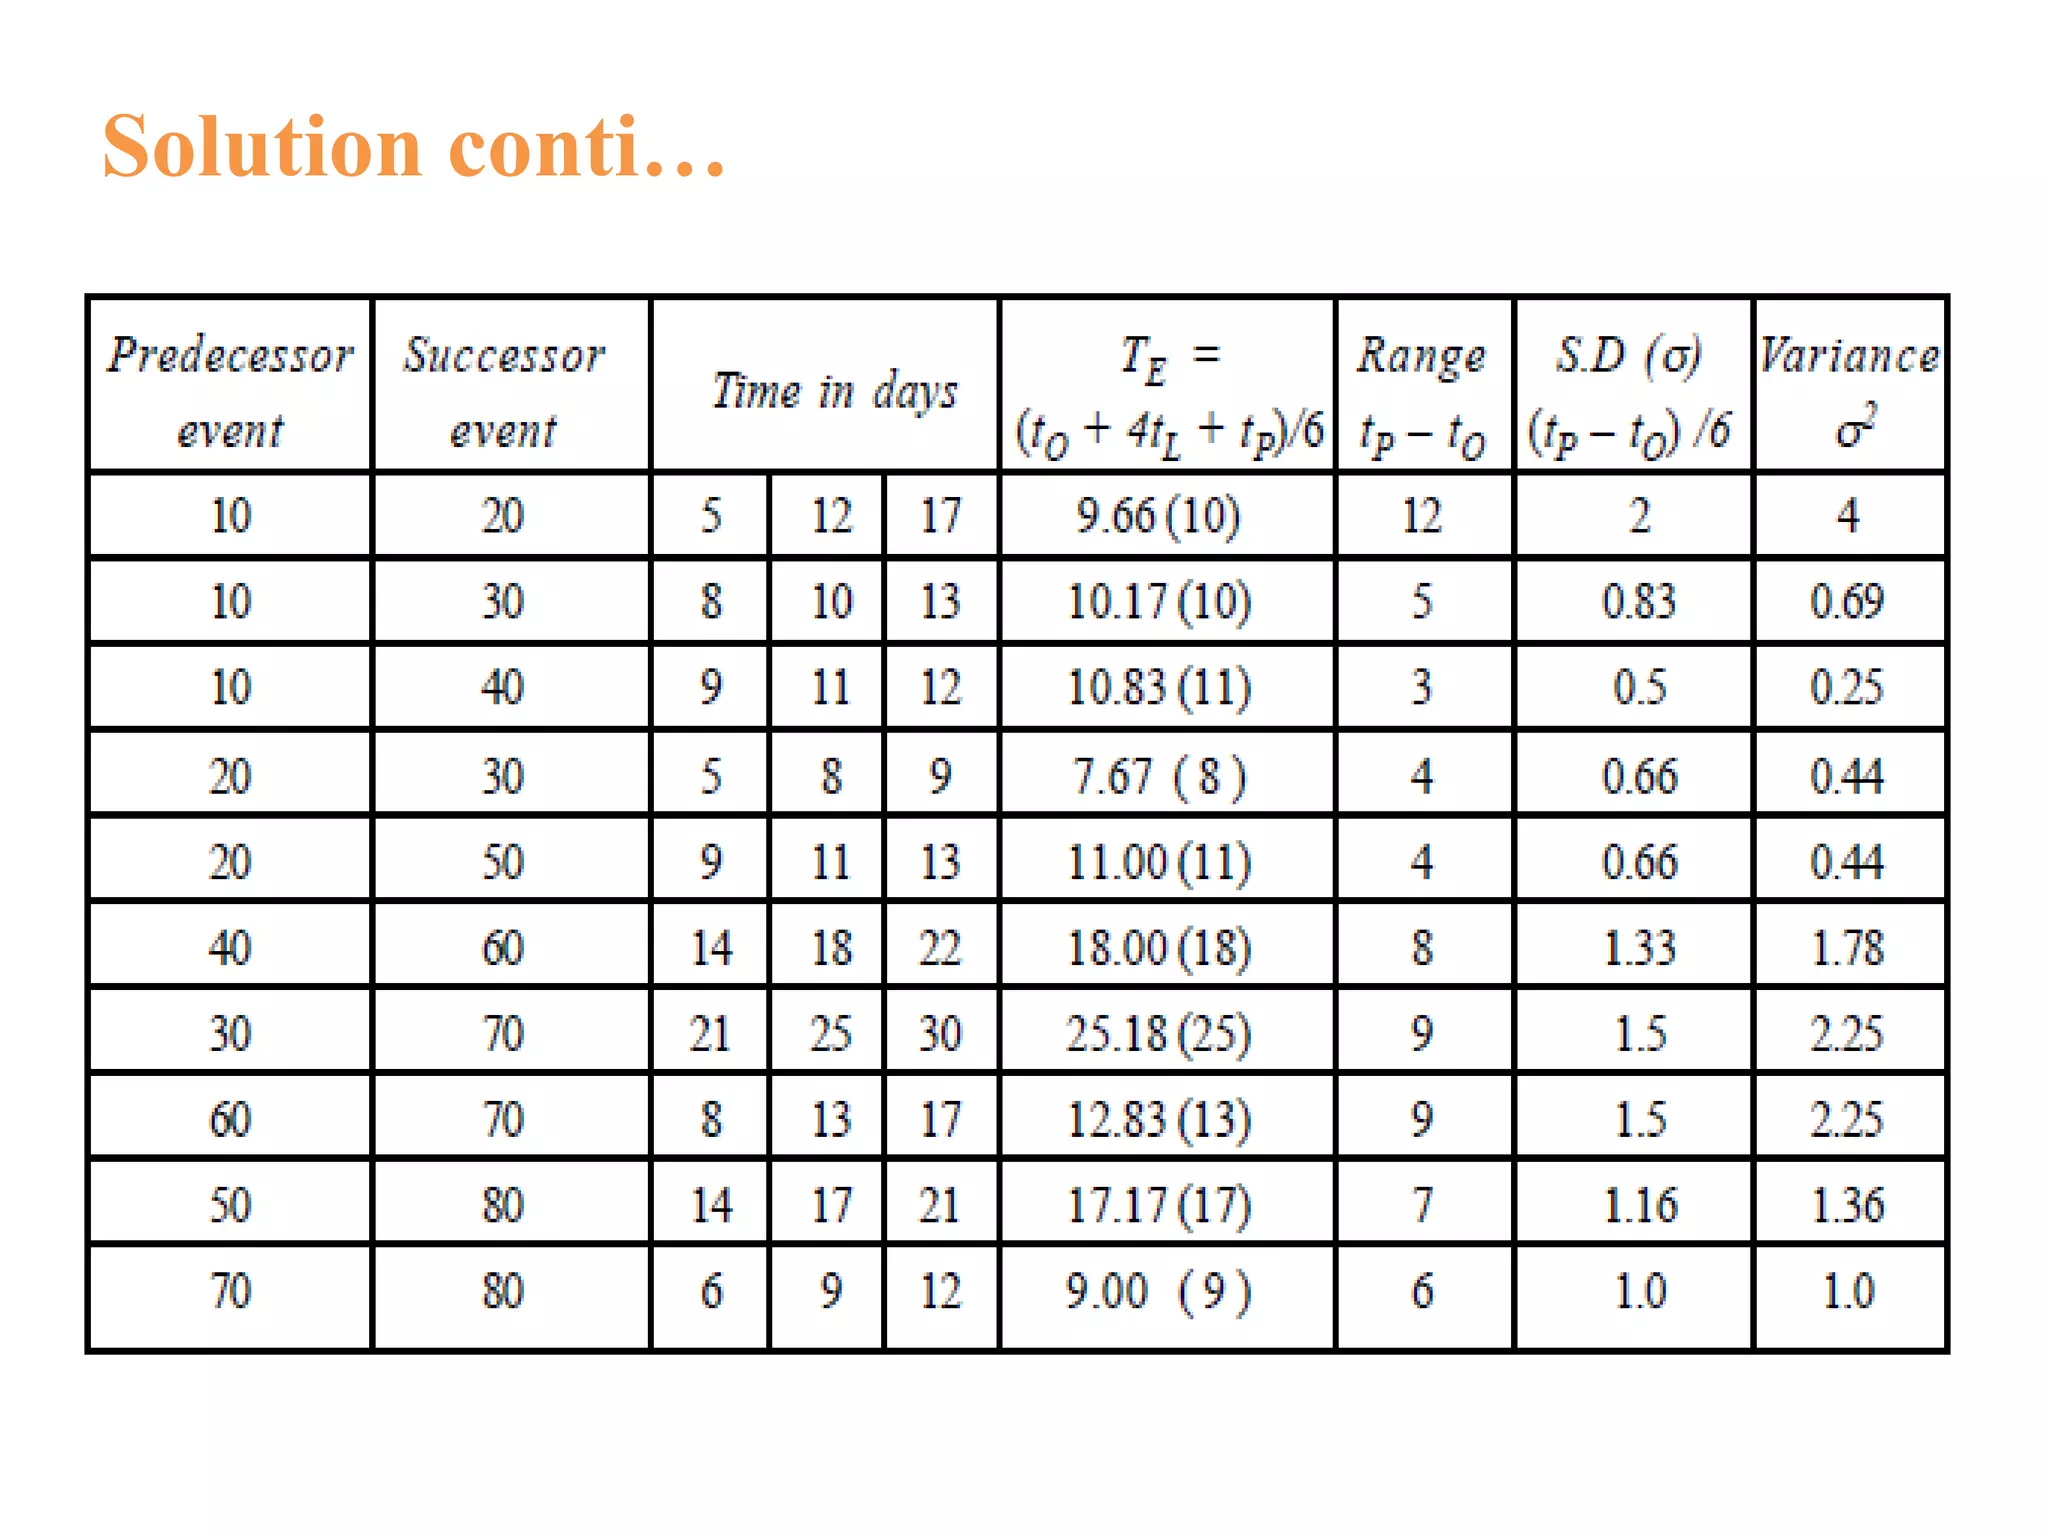
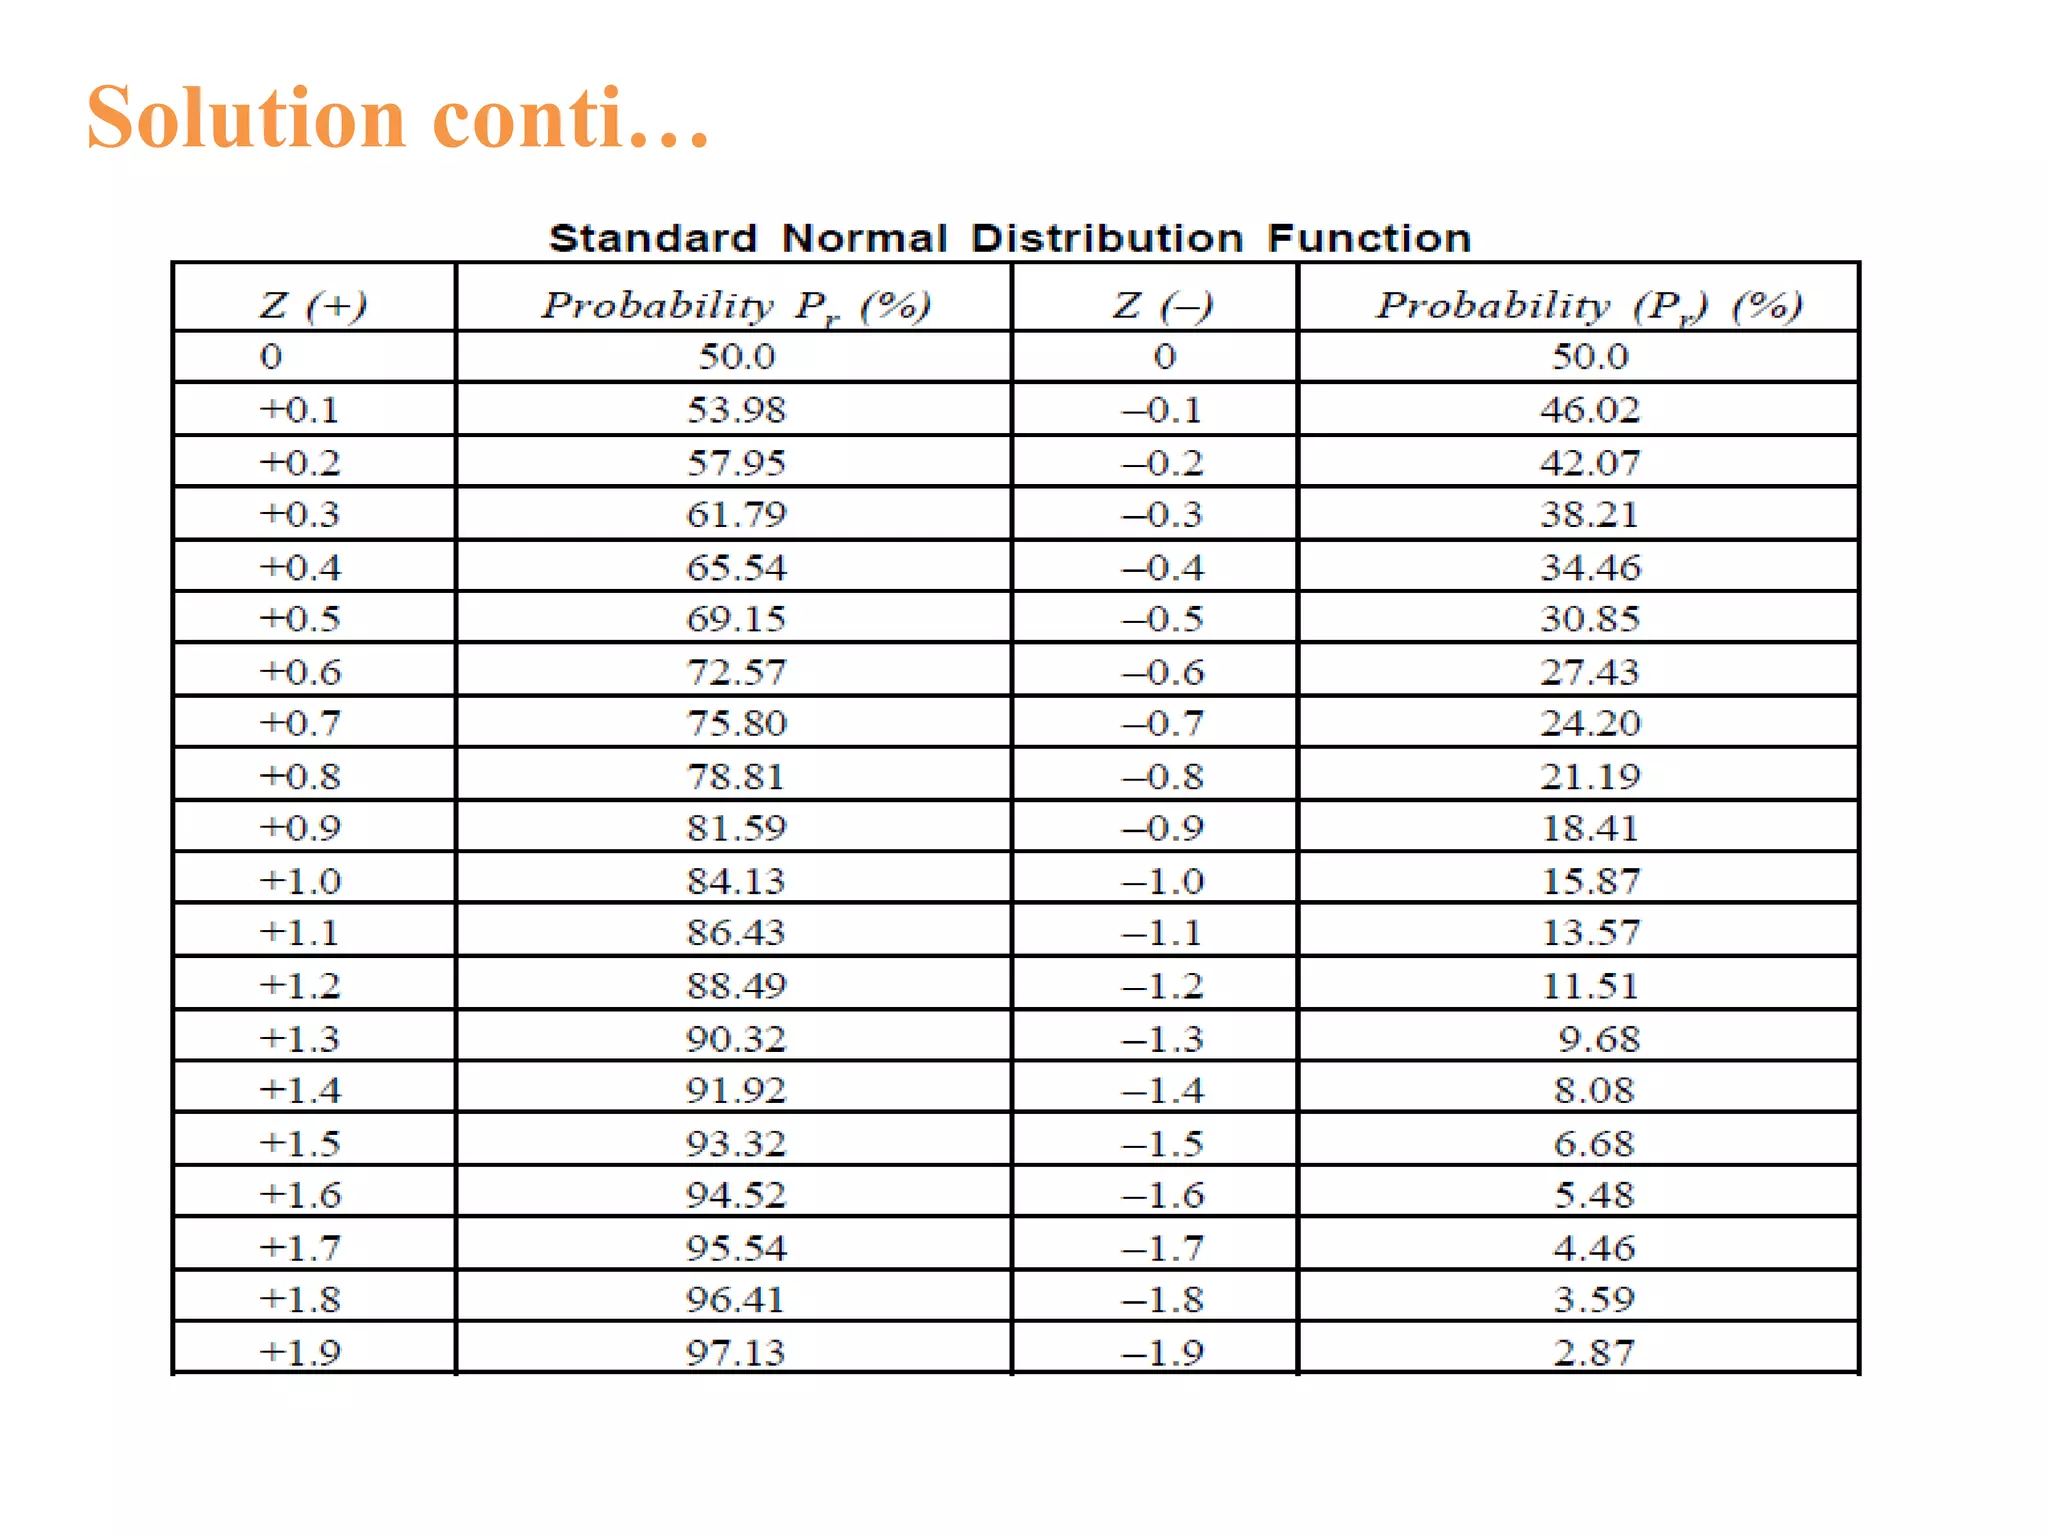
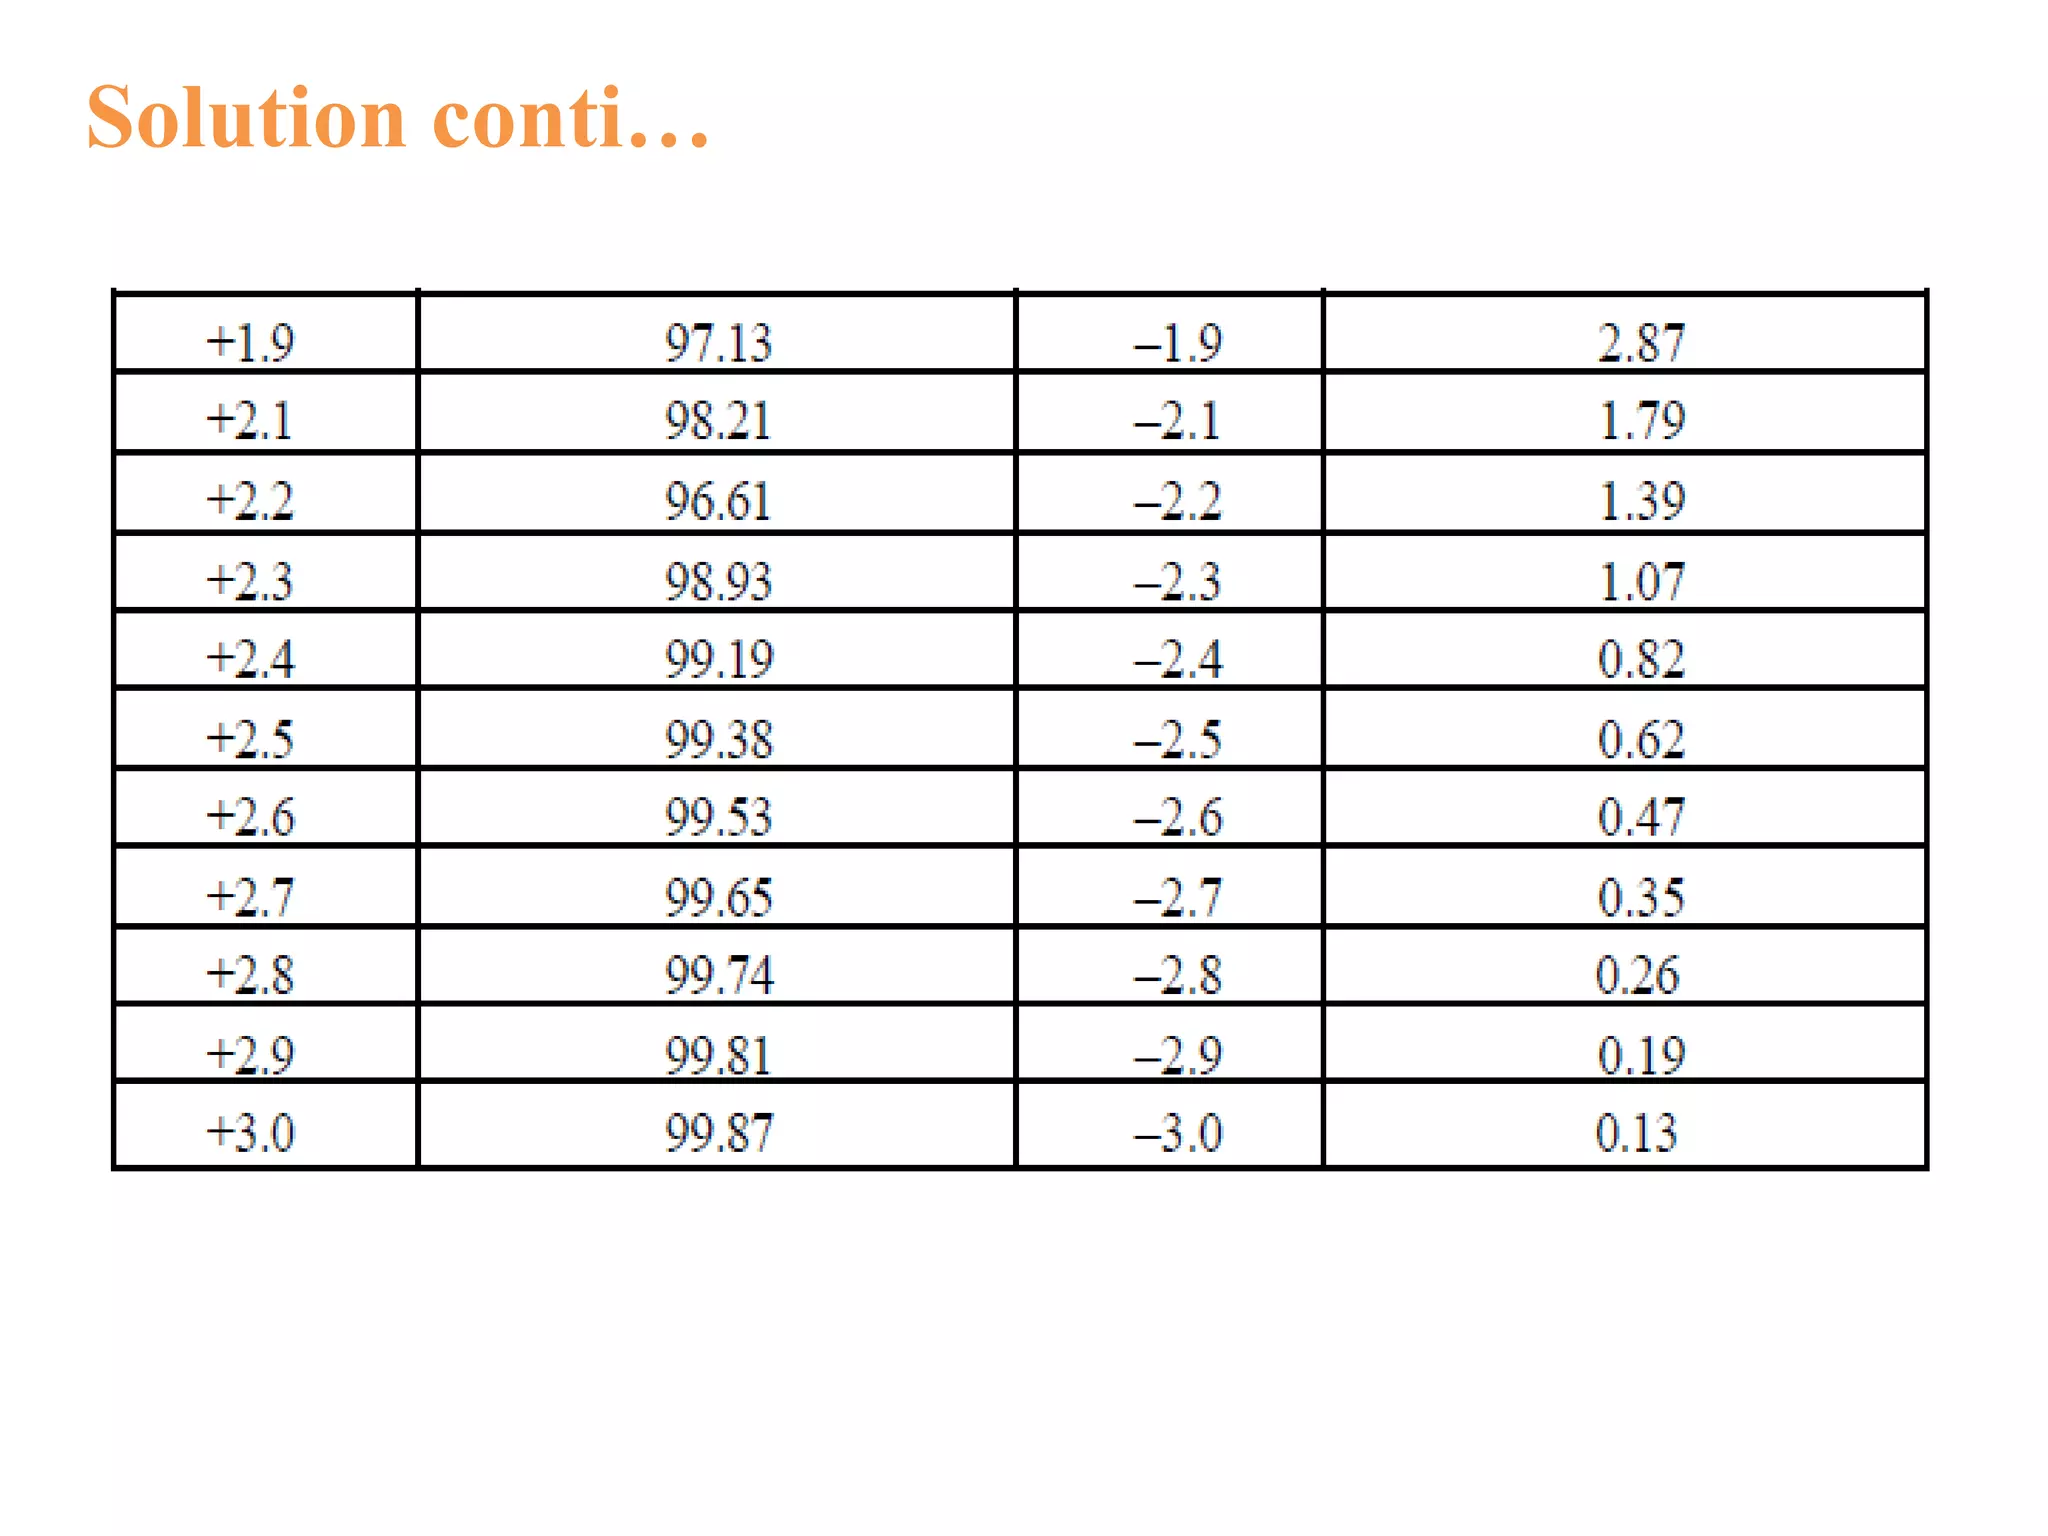
While calculating the probability of completing the project (having number of
activities), the following procedure is applied (here, we apply central limit
theorem).
Step 1: Identify critical path and critical activities.
Step 2: Find variance ( σ2 ) for critical activities.
σij = [ (t p ij – to ij)/6]2
Step 3: List out critical activities and their σ2
Step 4: Find the sum of variance of critical activities i.e. Σσ2
Step 5: Find the square root of sum of variance i.e. Σσ2
Step 6: Find the difference between the contractual time (TL) i.e., time by which
the project is to be completed and project completion time TE, i.e. TL – TE
Depending on the value of TL, this may be +ve or 0 or –ve number. That is
If TL = TE then TL – TE = 0
If TL > TE then TL – TE = Positive Number
If TL < TE then TL – TE = Negative Number](https://image.slidesharecdn.com/criticalpathmethod-170803225336/75/Critical-path-method-24-2048.jpg)


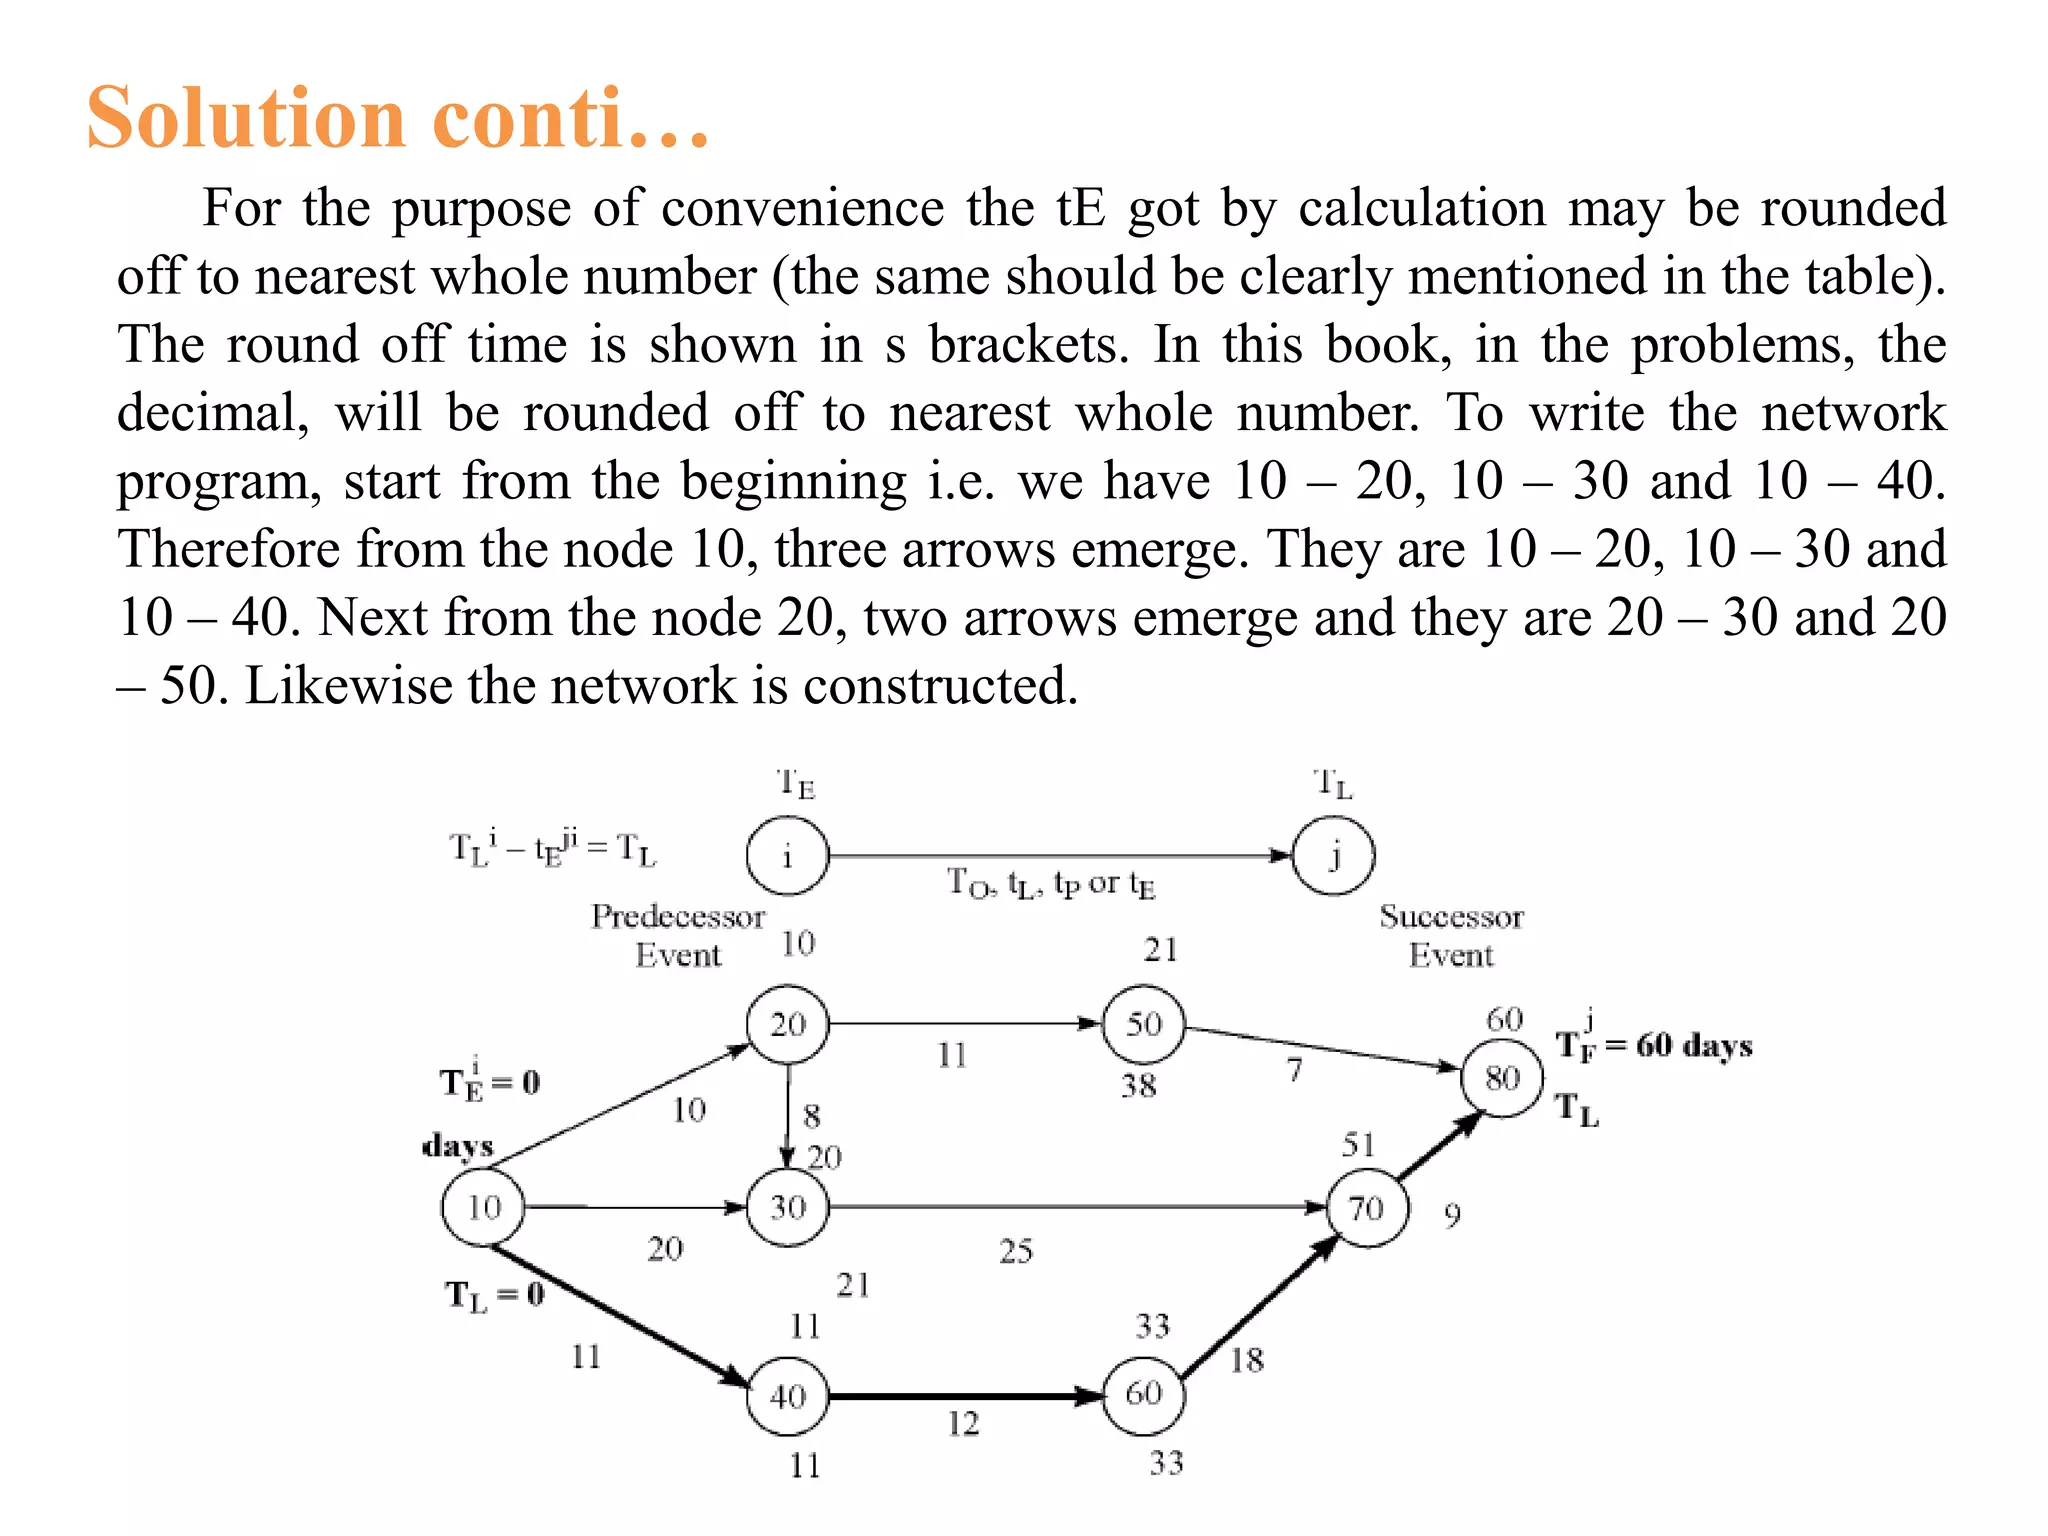
The document discusses critical path method (CPM) and program evaluation and review technique (PERT) for planning and scheduling large projects. It explains that a project consists of various activities connected logically in a network. CPM and PERT help estimate project completion time, control resources, and reduce completion time. The key differences between CPM and PERT are that PERT uses probabilistic activity times and three estimates while CPM uses fixed times and is activity-oriented rather than event-oriented. The document also outlines the steps for writing a project network.


![Electrical discharge machining [EDM]](https://cdn.slidesharecdn.com/ss_thumbnails/electricaldischargemachiningedm-170803232011-thumbnail.jpg?width=640&height=640&fit=bounds)


