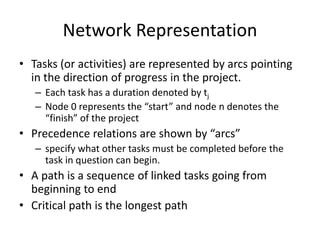
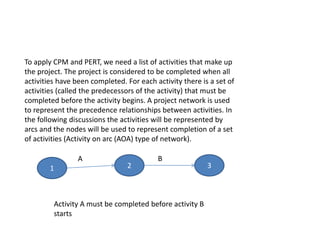
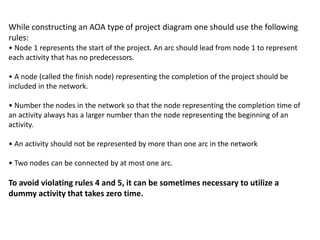
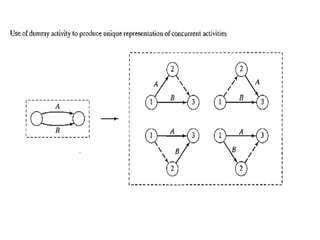
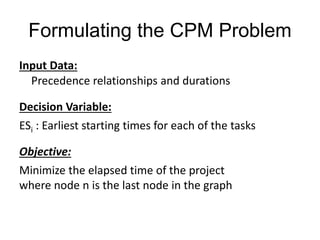
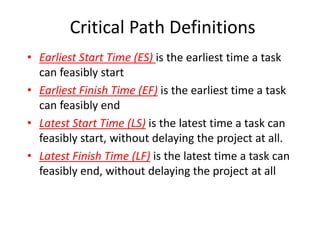
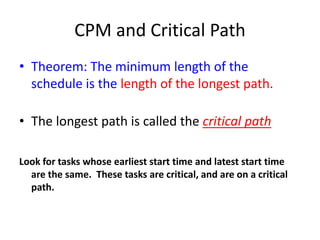
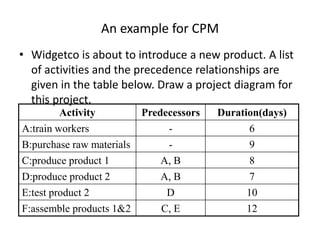
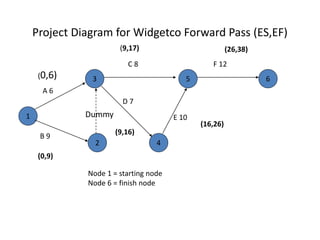
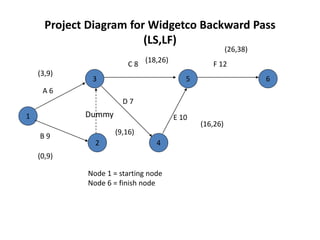
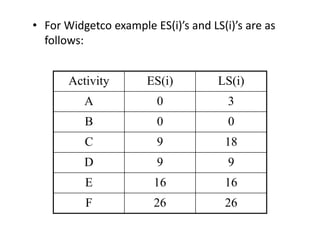
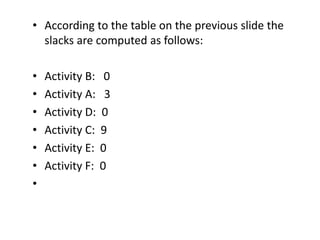
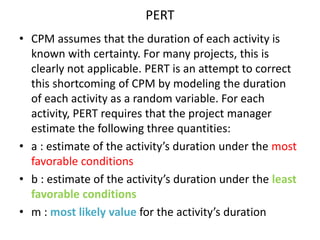
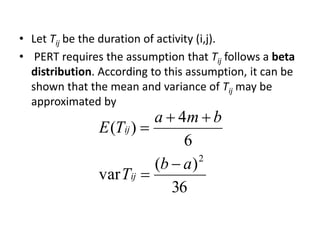
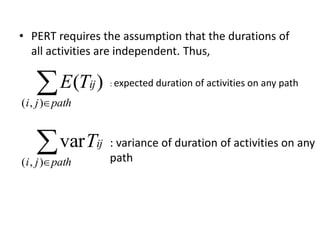
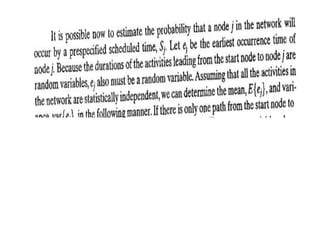
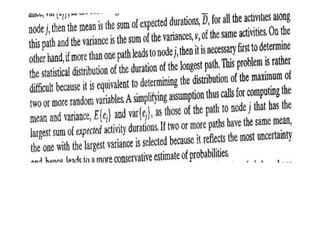
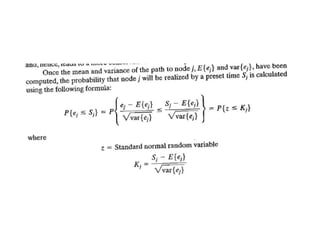
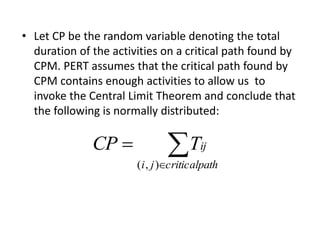
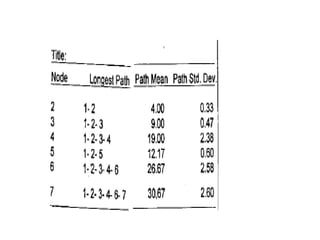
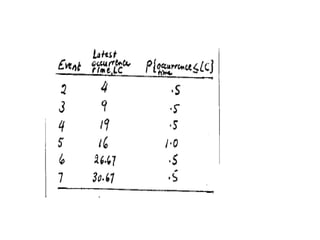
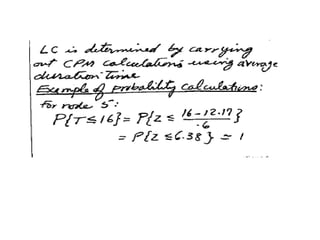
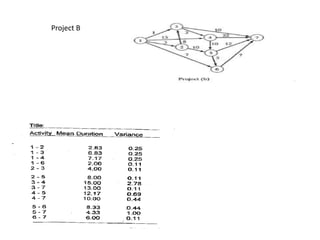
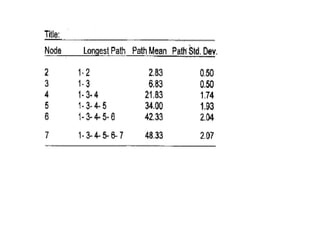
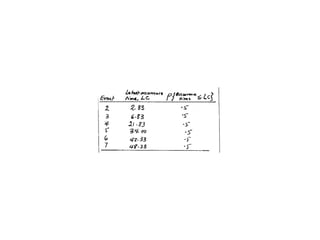
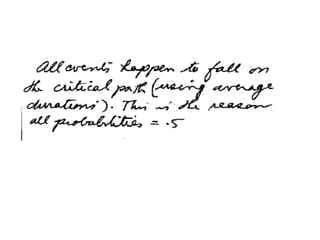
CPM & PERT
CPM: CRITICAL PATH METHOD 
PERT: Program Evaluation and Review 
Technique
CPM and PERT 
Network models can be used to assist in the planning, 
scheduling and control of projects 
Project: is a collection of interrelated activities with each 
activity consuming time and resources. 
CPM: If the duration of each activity is known with certainty, 
the Critical Path Method (CPM) can be used to determine the 
length of time required to complete a project. 
PERT: If the duration of activities is not known with certainty, 
the Program Evaluation and Review Technique (PERT) can be 
used to estimate the probability that the project will be 
completed by a given deadline.
CPM and PERT are used in many 
applications including the following: 
• Scheduling construction projects such as office 
buildings, highways and swimming pools 
• Developing countdown and “hold” procedure for the 
launching of space crafts 
• Installing new computer systems 
• Designing and marketing new products 
• Completing corporate mergers 
• Building ships
Project Planning, Scheduling and 
Control 
• Planning: organized approach to accomplish the goal 
of minimizing elapsed time of project 
– defines objectives and tasks; represents tasks interactions 
on a network; estimates time and resources 
• Scheduling: a time-phased commitment of resources 
– identifies critical tasks which, if delayed, will delay the 
project’s completion time. 
• Control: means of monitoring and revising the 
progress of a project
Network Representation 
• Tasks (or activities) are represented by arcs pointing 
in the direction of progress in the project. 
– Each task has a duration denoted by tj 
– Node 0 represents the “start” and node n denotes the 
“finish” of the project 
• Precedence relations are shown by “arcs” 
– specify what other tasks must be completed before the 
task in question can begin. 
• A path is a sequence of linked tasks going from 
beginning to end 
• Critical path is the longest path
To apply CPM and PERT, we need a list of activities that make up 
the project. The project is considered to be completed when all 
activities have been completed. For each activity there is a set of 
activities (called the predecessors of the activity) that must be 
completed before the activity begins. A project network is used 
to represent the precedence relationships between activities. In 
the following discussions the activities will be represented by 
arcs and the nodes will be used to represent completion of a set 
of activities (Activity on arc (AOA) type of network). 
A B 
1 2 3 
Activity A must be completed before activity B 
starts
While constructing an AOA type of project diagram one should use the following 
rules: 
• Node 1 represents the start of the project. An arc should lead from node 1 to represent 
each activity that has no predecessors. 
• A node (called the finish node) representing the completion of the project should be 
included in the network. 
• Number the nodes in the network so that the node representing the completion time of 
an activity always has a larger number than the node representing the beginning of an 
activity. 
• An activity should not be represented by more than one arc in the network 
• Two nodes can be connected by at most one arc. 
To avoid violating rules 4 and 5, it can be sometimes necessary to utilize a 
dummy activity that takes zero time.
Question1
Formulating the CPM Problem 
Input Data: 
Precedence relationships and durations 
Decision Variable: 
ESi : Earliest starting times for each of the tasks 
Objective: 
Minimize the elapsed time of the project 
where node n is the last node in the graph
Critical Path Definitions 
• Earliest Start Time (ES) is the earliest time a task 
can feasibly start 
• Earliest Finish Time (EF) is the earliest time a task 
can feasibly end 
• Latest Start Time (LS) is the latest time a task can 
feasibly start, without delaying the project at all. 
• Latest Finish Time (LF) is the latest time a task can 
feasibly end, without delaying the project at all
CPM and Critical Path 
• Theorem: The minimum length of the 
schedule is the length of the longest path. 
• The longest path is called the critical path 
Look for tasks whose earliest start time and latest start time 
are the same. These tasks are critical, and are on a critical 
path.
An example for CPM 
• Widgetco is about to introduce a new product. A list 
of activities and the precedence relationships are 
given in the table below. Draw a project diagram for 
this project. 
Activity Predecessors Duration(days) 
A:train workers - 6 
B:purchase raw materials - 9 
C:produce product 1 A, B 8 
D:produce product 2 A, B 7 
E:test product 2 D 10 
F:assemble products 1&2 C, E 12
Project Diagram for Widgetco 
1 
5 6 
3 
2 4 
A 6 
B 9 
Dummy 
C 8 
D 7 
E 10 
F 12 
Node 1 = starting node 
Node 6 = finish node
Project Diagram for Widgetco Forward Pass (ES,EF) 
1 
5 6 
3 
2 4 
A 6 
B 9 
Dummy 
C 8 
D 7 
E 10 
F 12 
Node 1 = starting node 
Node 6 = finish node 
(0,6) 
(0,9) 
(9,17) 
(9,16) 
(16,26) 
(26,38)
Project Diagram for Widgetco Backward Pass 
(LS,LF) 
1 
5 6 
3 
2 4 
A 6 
B 9 
Dummy 
C 8 
D 7 
E 10 
F 12 
Node 1 = starting node 
Node 6 = finish node 
(3,9) 
(0,9) 
(18,26) 
(9,16) 
(16,26) 
(26,38)
• For Widgetco example ES(i)’s and LS(i)’s are as 
follows: 
Activity ES(i) LS(i) 
A 0 3 
B 0 0 
C 9 18 
D 9 9 
E 16 16 
F 26 26
• According to the table on the previous slide the 
slacks are computed as follows: 
• Activity B: 0 
• Activity A: 3 
• Activity D: 0 
• Activity C: 9 
• Activity E: 0 
• Activity F: 0 
•
Critical path 
• An activity with a slack of zero is a critical activity 
• A path from node 1 to the finish node that 
consists entirely of critical activities is called a 
critical path. 
• For Widgetco example B-D-E-F is a critical path. 
• The Makespan is equal to 38
p 
q 
j 
v 
DPJ 
D qj 
D vj 
p 
q 
v 
j
v 
q 
p 
j 
p 
q 
v 
j 
D jp 
D jq 
D jv
Critical Activities
Forward and backward pass 
calculations for the project of 
Example 6.5-2
6 6
FLOAT
Forward and backward pass 
calculations for the project of 
Example 6.5-2
PERT 
• CPM assumes that the duration of each activity is 
known with certainty. For many projects, this is 
clearly not applicable. PERT is an attempt to correct 
this shortcoming of CPM by modeling the duration 
of each activity as a random variable. For each 
activity, PERT requires that the project manager 
estimate the following three quantities: 
• a : estimate of the activity’s duration under the most 
favorable conditions 
• b : estimate of the activity’s duration under the least 
favorable conditions 
• m : most likely value for the activity’s duration
• Let Tij be the duration of activity (i,j). 
• PERT requires the assumption that Tij follows a beta 
distribution. According to this assumption, it can be 
shown that the mean and variance of Tij may be 
approximated by 
4 
( ) 
36 
var 
6 
( ) 
2 b a 
T 
a m b 
E T 
ij 
ij 
 
 
  

• PERT requires the assumption that the durations of 
all activities are independent. Thus, 
 
E ( Tij 
) 
( i , j ) 
path 
 
path j i 
Tij 
( , ) 
var 
: expected duration of activities on any path 
: variance of duration of activities on any 
path
• Let CP be the random variable denoting the total 
duration of the activities on a critical path found by 
CPM. PERT assumes that the critical path found by 
CPM contains enough activities to allow us to 
invoke the Central Limit Theorem and conclude that 
the following is normally distributed: 
 
 
CP  
Tij 
i j criticalpath 
( , )
a, b and m for activities in Widgetco 
Activity a b m 
(1,2) 5 13 9 
(1,3) 2 10 6 
(3,5) 3 13 8 
(3,4) 1 13 7 
(4,5) 8 12 10 
(5,6) 9 15 12
Project Diagram for Widgetco 
1 
5 6 
3 
2 4 
A 6 
B 9 
Dummy 
C 8 
D 7 
E 10 
F 12 
Node 1 = starting node 
Node 6 = finish node
• According to the table on the previous slide: 
1 
(13 5) 
(10 2) 
(13 3) 
(13 1) 
(12 8) 
(15 9) 
36 
E T T 
E T T 
E T T 
E T T 
E T T 
12, var 
5 13 36 
2 10 24 
3 13 32 
1 13 28 
8 12 40 
9 15 48 
6 
( ) 
0.44 
36 
10, var 
6 
( ) 
4 
36 
7, var 
6 
( ) 
2.78 
36 
8, var 
6 
( ) 
1.78 
36 
6, var 
6 
( ) 
1.78 
36 
9, var 
6 
( ) 
2 
56 56 
2 
45 45 
2 
34 34 
2 
35 35 
2 
13 13 
2 
12 12 
 
 
  
  
 
 
 
  
  
 
 
 
  
  
 
 
 
  
  
 
 
 
  
  
 
 
 
  
  
 
E T T
• Of course, the fact that arc (2,3) is a dummy arc 
yields 
• E(T23)=varT23=0 
• The critical path was B-D-E-F. Thus, 
• E(CP)=9+0+7+10+12=38 
• varCP=1.78+0+4+0.44+1=7.22 
• Then the standard deviation for CP is (7.22)1/2=2.69 
• And 
CP 
P CP P 
( 35) (     
) ( 1.12) 0.13 
35 38 
2.69 
38 
2.69 
 
 
 
  P Z
• PERT implies that there is a 13% chance that the 
project will be completed within 35 days.
Project B
Cpmprt
Cpmprt
Cpmprt
Cpmprt

Cpmprt

  • 1.
  • 2.
    CPM: CRITICAL PATHMETHOD PERT: Program Evaluation and Review Technique
  • 3.
    CPM and PERT Network models can be used to assist in the planning, scheduling and control of projects Project: is a collection of interrelated activities with each activity consuming time and resources. CPM: If the duration of each activity is known with certainty, the Critical Path Method (CPM) can be used to determine the length of time required to complete a project. PERT: If the duration of activities is not known with certainty, the Program Evaluation and Review Technique (PERT) can be used to estimate the probability that the project will be completed by a given deadline.
  • 4.
    CPM and PERTare used in many applications including the following: • Scheduling construction projects such as office buildings, highways and swimming pools • Developing countdown and “hold” procedure for the launching of space crafts • Installing new computer systems • Designing and marketing new products • Completing corporate mergers • Building ships
  • 5.
    Project Planning, Schedulingand Control • Planning: organized approach to accomplish the goal of minimizing elapsed time of project – defines objectives and tasks; represents tasks interactions on a network; estimates time and resources • Scheduling: a time-phased commitment of resources – identifies critical tasks which, if delayed, will delay the project’s completion time. • Control: means of monitoring and revising the progress of a project
  • 6.
    Network Representation •Tasks (or activities) are represented by arcs pointing in the direction of progress in the project. – Each task has a duration denoted by tj – Node 0 represents the “start” and node n denotes the “finish” of the project • Precedence relations are shown by “arcs” – specify what other tasks must be completed before the task in question can begin. • A path is a sequence of linked tasks going from beginning to end • Critical path is the longest path
  • 7.
    To apply CPMand PERT, we need a list of activities that make up the project. The project is considered to be completed when all activities have been completed. For each activity there is a set of activities (called the predecessors of the activity) that must be completed before the activity begins. A project network is used to represent the precedence relationships between activities. In the following discussions the activities will be represented by arcs and the nodes will be used to represent completion of a set of activities (Activity on arc (AOA) type of network). A B 1 2 3 Activity A must be completed before activity B starts
  • 8.
    While constructing anAOA type of project diagram one should use the following rules: • Node 1 represents the start of the project. An arc should lead from node 1 to represent each activity that has no predecessors. • A node (called the finish node) representing the completion of the project should be included in the network. • Number the nodes in the network so that the node representing the completion time of an activity always has a larger number than the node representing the beginning of an activity. • An activity should not be represented by more than one arc in the network • Two nodes can be connected by at most one arc. To avoid violating rules 4 and 5, it can be sometimes necessary to utilize a dummy activity that takes zero time.
  • 12.
  • 15.
    Formulating the CPMProblem Input Data: Precedence relationships and durations Decision Variable: ESi : Earliest starting times for each of the tasks Objective: Minimize the elapsed time of the project where node n is the last node in the graph
  • 16.
    Critical Path Definitions • Earliest Start Time (ES) is the earliest time a task can feasibly start • Earliest Finish Time (EF) is the earliest time a task can feasibly end • Latest Start Time (LS) is the latest time a task can feasibly start, without delaying the project at all. • Latest Finish Time (LF) is the latest time a task can feasibly end, without delaying the project at all
  • 17.
    CPM and CriticalPath • Theorem: The minimum length of the schedule is the length of the longest path. • The longest path is called the critical path Look for tasks whose earliest start time and latest start time are the same. These tasks are critical, and are on a critical path.
  • 18.
    An example forCPM • Widgetco is about to introduce a new product. A list of activities and the precedence relationships are given in the table below. Draw a project diagram for this project. Activity Predecessors Duration(days) A:train workers - 6 B:purchase raw materials - 9 C:produce product 1 A, B 8 D:produce product 2 A, B 7 E:test product 2 D 10 F:assemble products 1&2 C, E 12
  • 19.
    Project Diagram forWidgetco 1 5 6 3 2 4 A 6 B 9 Dummy C 8 D 7 E 10 F 12 Node 1 = starting node Node 6 = finish node
  • 20.
    Project Diagram forWidgetco Forward Pass (ES,EF) 1 5 6 3 2 4 A 6 B 9 Dummy C 8 D 7 E 10 F 12 Node 1 = starting node Node 6 = finish node (0,6) (0,9) (9,17) (9,16) (16,26) (26,38)
  • 21.
    Project Diagram forWidgetco Backward Pass (LS,LF) 1 5 6 3 2 4 A 6 B 9 Dummy C 8 D 7 E 10 F 12 Node 1 = starting node Node 6 = finish node (3,9) (0,9) (18,26) (9,16) (16,26) (26,38)
  • 22.
    • For Widgetcoexample ES(i)’s and LS(i)’s are as follows: Activity ES(i) LS(i) A 0 3 B 0 0 C 9 18 D 9 9 E 16 16 F 26 26
  • 23.
    • According tothe table on the previous slide the slacks are computed as follows: • Activity B: 0 • Activity A: 3 • Activity D: 0 • Activity C: 9 • Activity E: 0 • Activity F: 0 •
  • 24.
    Critical path •An activity with a slack of zero is a critical activity • A path from node 1 to the finish node that consists entirely of critical activities is called a critical path. • For Widgetco example B-D-E-F is a critical path. • The Makespan is equal to 38
  • 27.
    p q j v DPJ D qj D vj p q v j
  • 29.
    v q p j p q v j D jp D jq D jv
  • 30.
  • 33.
    Forward and backwardpass calculations for the project of Example 6.5-2
  • 34.
  • 40.
  • 43.
    Forward and backwardpass calculations for the project of Example 6.5-2
  • 47.
    PERT • CPMassumes that the duration of each activity is known with certainty. For many projects, this is clearly not applicable. PERT is an attempt to correct this shortcoming of CPM by modeling the duration of each activity as a random variable. For each activity, PERT requires that the project manager estimate the following three quantities: • a : estimate of the activity’s duration under the most favorable conditions • b : estimate of the activity’s duration under the least favorable conditions • m : most likely value for the activity’s duration
  • 48.
    • Let Tijbe the duration of activity (i,j). • PERT requires the assumption that Tij follows a beta distribution. According to this assumption, it can be shown that the mean and variance of Tij may be approximated by 4 ( ) 36 var 6 ( ) 2 b a T a m b E T ij ij     
  • 49.
    • PERT requiresthe assumption that the durations of all activities are independent. Thus,  E ( Tij ) ( i , j ) path  path j i Tij ( , ) var : expected duration of activities on any path : variance of duration of activities on any path
  • 58.
    • Let CPbe the random variable denoting the total duration of the activities on a critical path found by CPM. PERT assumes that the critical path found by CPM contains enough activities to allow us to invoke the Central Limit Theorem and conclude that the following is normally distributed:   CP  Tij i j criticalpath ( , )
  • 59.
    a, b andm for activities in Widgetco Activity a b m (1,2) 5 13 9 (1,3) 2 10 6 (3,5) 3 13 8 (3,4) 1 13 7 (4,5) 8 12 10 (5,6) 9 15 12
  • 60.
    Project Diagram forWidgetco 1 5 6 3 2 4 A 6 B 9 Dummy C 8 D 7 E 10 F 12 Node 1 = starting node Node 6 = finish node
  • 61.
    • According tothe table on the previous slide: 1 (13 5) (10 2) (13 3) (13 1) (12 8) (15 9) 36 E T T E T T E T T E T T E T T 12, var 5 13 36 2 10 24 3 13 32 1 13 28 8 12 40 9 15 48 6 ( ) 0.44 36 10, var 6 ( ) 4 36 7, var 6 ( ) 2.78 36 8, var 6 ( ) 1.78 36 6, var 6 ( ) 1.78 36 9, var 6 ( ) 2 56 56 2 45 45 2 34 34 2 35 35 2 13 13 2 12 12                                           E T T
  • 62.
    • Of course,the fact that arc (2,3) is a dummy arc yields • E(T23)=varT23=0 • The critical path was B-D-E-F. Thus, • E(CP)=9+0+7+10+12=38 • varCP=1.78+0+4+0.44+1=7.22 • Then the standard deviation for CP is (7.22)1/2=2.69 • And CP P CP P ( 35) (     ) ( 1.12) 0.13 35 38 2.69 38 2.69      P Z
  • 63.
    • PERT impliesthat there is a 13% chance that the project will be completed within 35 days.
  • 69.