
Recommended
More Related Content
What's hot
What's hot (12)
Viewers also liked
Recently uploaded
Recently uploaded (20)
My Water Saving Promise
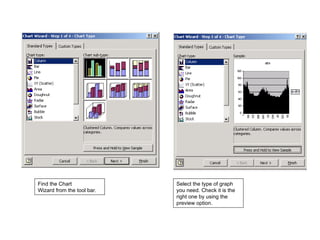
- 1. Find the Chart Wizard from the tool bar. Select the type of graph you need. Check it is the right one by using the preview option.
- 2. Line graph without markers creates the correct plot by plotting decibel readings over time.
- 3. Make sure you have selected the column you need to graph.
- 4. Add your labels. Select the gridlines you think are important.
- 5. Put your graph on a new sheet.
- 6. The finished graph should look something like this. Can you make it larger?
- 7. Add some useful information by adding a text box Add some useful information by adding a text box