Download to read offline


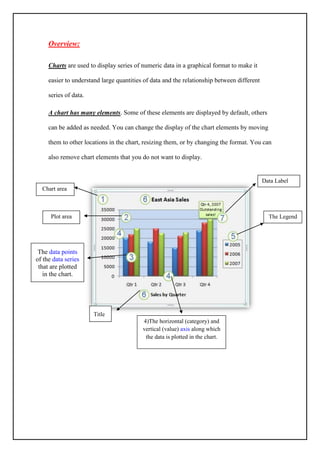
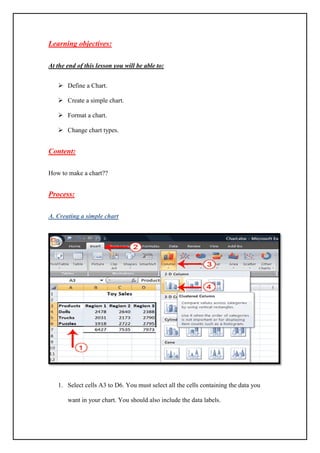
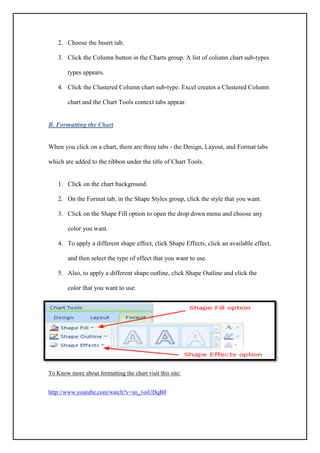
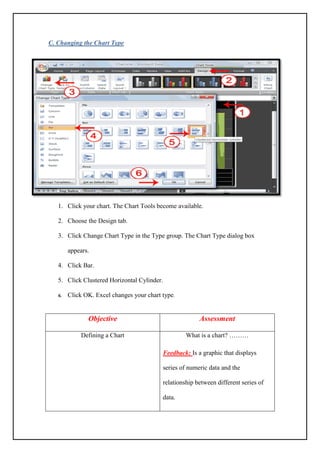
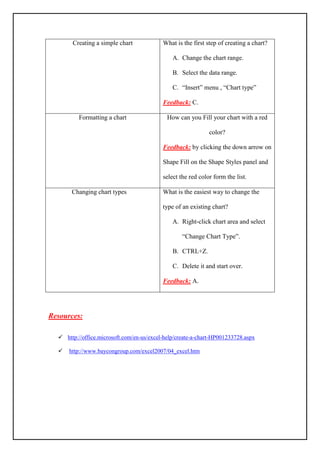

This document provides an overview of how to create and format charts in Excel. It discusses the key elements of a chart, including the data labels, chart area, plot area, legend, title, and axes. The learning objectives are to define a chart, create a simple chart, format a chart by changing colors and effects, and change the chart type. The content then outlines the specific steps to make a chart, such as selecting the data range and inserting a column or bar chart. It also explains how to format charts by modifying shapes, fills, and outlines. The final section reviews how to change an existing chart's type using the Chart Type dialog box.


