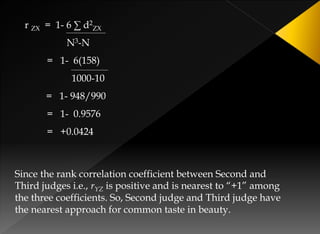
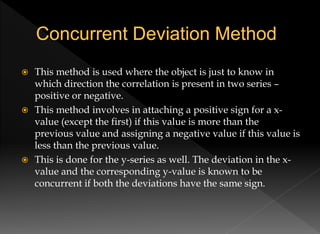
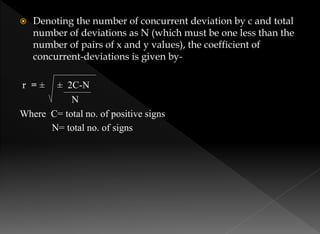
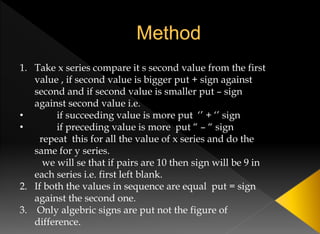
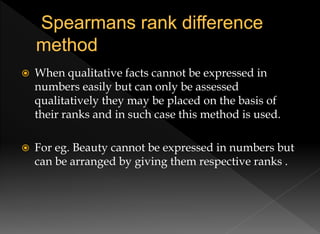
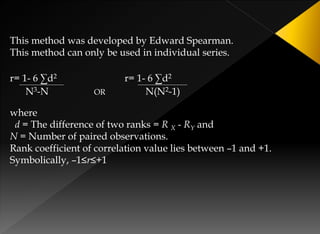
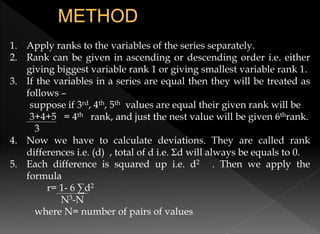
The document details the rank correlation method developed by Edward Spearman, used for qualitative data that cannot be quantified but can be ranked. It explains formulas for calculating rank correlation coefficients, addressing tied observations, and provides examples involving students' ranks across tests and rankings in competitions. Additionally, it describes the method of concurrent deviations for analyzing relationships between two variables.
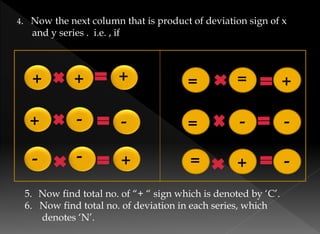
![When two or more value in either or both the series are equal,
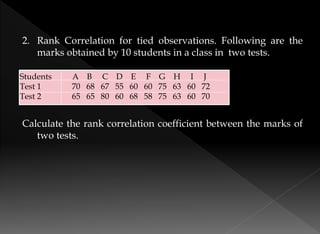
following correction factor also applies-
{1/12(m3-m)+……}
This correlation is applied as many times as the value are equal in
both the series taken together.
‘m’ represents the number of equal value.
For eg. 40 has been repeated 2 times and 45 has been repeated 4
times , so the value of m for 40 is 2 and value of m for 45 is 4.
The formula along with this correlation is –
6 [ ∑d2 +1/12(m3-m)+ 1/12(m3-m) …… ]
r = 1 –
N3-N](https://image.slidesharecdn.com/correlation-210831141340/85/Correlation-5-320.jpg)
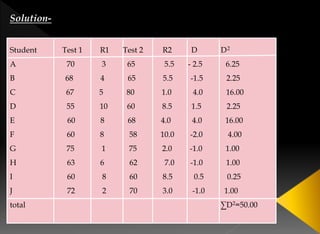
![60 is repeated 3 times in test 1
60, 65 is repeated twice in test 2
m=3; m=2; m=2
r = 1 – 6 [ ∑d2 +1/12(m3-m)+ 1/12(m3-m) …… ]
N3-N
r = 1- 6 [50+1/12(33-3)+1/12(23-2)+1/12(23-2)]
1000-10
r = 1- 6 [50+1/12(27-3)+1/12(8-2)+1/12(8-2)]
990
r = 1- 6 [50+1/12*24+1/12*6+1/12*6]
990
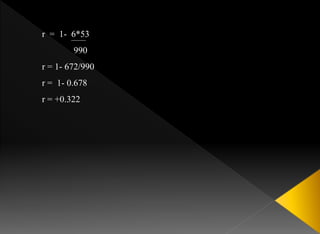
r = 1- 6(50+2+1/2+1/2)
990](https://image.slidesharecdn.com/correlation-210831141340/85/Correlation-11-320.jpg)