Downloaded 255 times


![Reference
2013a. ACHE [Online]. Available: http://www.thermopedia.com/content/663/.
2013b. EES: Engineering Equation Solver | F-Chart Software : Engineering Software [Online].
Available: http://www.fchart.com/ees/.
2013c. Natural Draft Cooling Towers | Hamon Group [Online]. Available:
http://www.hamon.com/en/cooling-systems/wet-cooling-systems/natural-draft-cooling-
towers/natural-draft/.
BURGER, R. 1994. Cooling Tower Technology. Maintenance, Upgrading and Rebuilding.
United States of America: The Fairmont Press, Inc. .
ENERGY, U. S. D. O. 2011. Cooling Towers: Understanding Key Components of Cooling
Towers and How to Improve Water Efficiency. In: ENERGY (ed.).
HEATING, A. I. O. A. C. R. A. 2009. Types of Cooling Towers In: Selecting a Cooling Tower
Level 1 – Participant Guide Version 1.0.
TAWNEY, R., KHAN, Z. & ZACHARY, J. 2005. Economic and performance evauation of heat
sink Options in combined cycle applications. Journal of engineering for Gas Turbine and Power,
127, 397-403.
Cooling Tower Technical Site of Daeil Aqua Co., L. (n.d.). Cooling Tower Thermal Design Manual. Retrieved
from http://myhome.hanafos.com/~criok/english/publication/thermal/thermal12eng.html
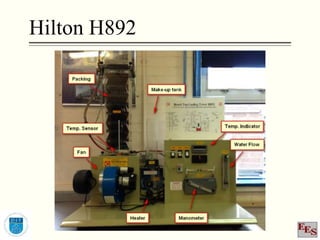
Ltd, P. H. (2003, February). Experimental operating and maintanence manual.](https://image.slidesharecdn.com/gky1ctwhqysbmbpbcl4v-signature-2257ab7810867420e9fc5631a1316538fecfef15cf81a58af61bf6366e4ac813-poli-140718090448-phpapp02/85/Modelling-of-a-cooling-tower-in-EES-28-320.jpg)

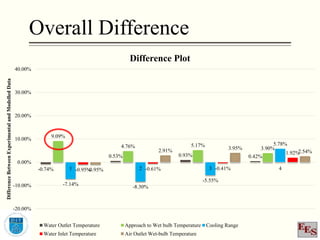
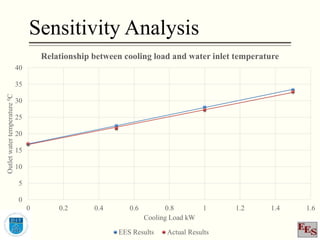
The document details a study on cooling towers, focusing on the creation of a mathematical model implemented in the Engineering Equation Solver (EES) for thermodynamic analysis. It includes various types of cooling towers, governing equations, and results from experimental and modeled comparisons. Key findings emphasize the accuracy of simulations, with suggestions for further investigation into errors and additional theories.


