Download as PDF, PPTX

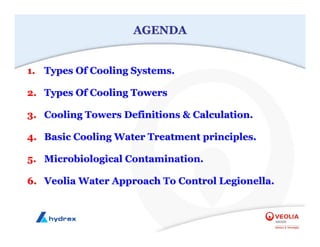
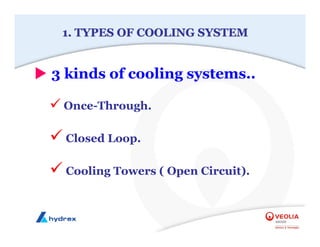
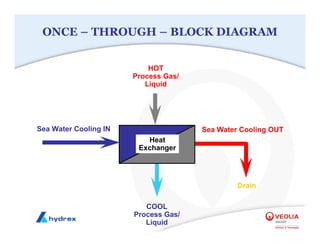
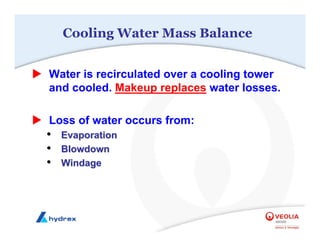
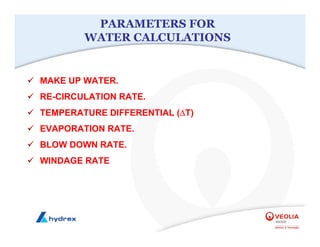
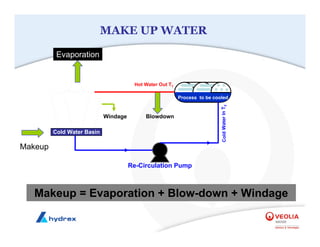
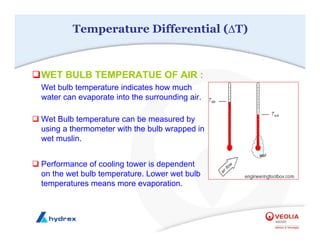
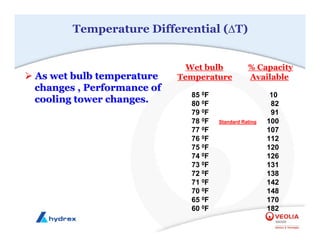
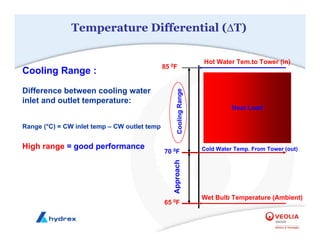
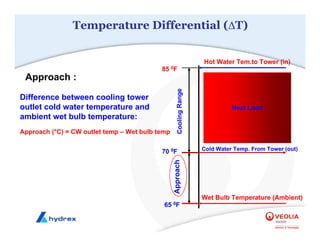
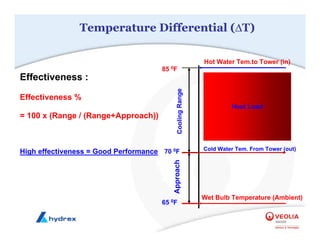
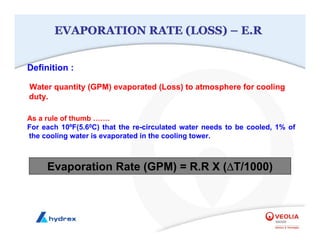
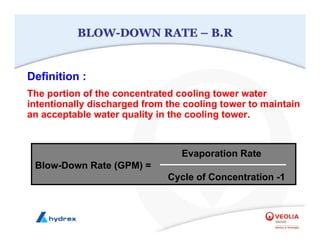
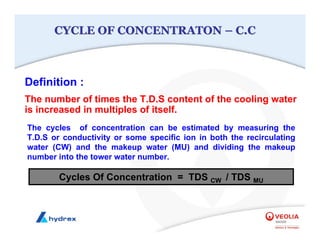
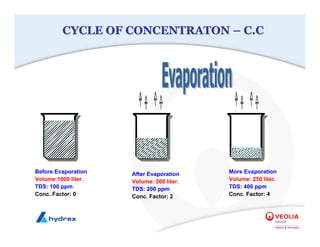
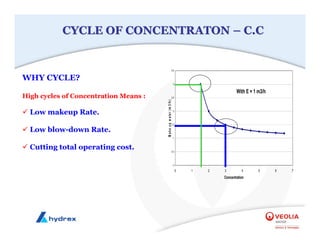
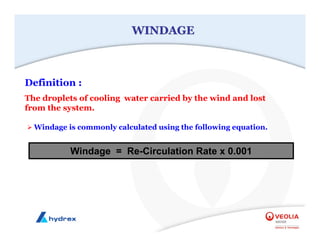
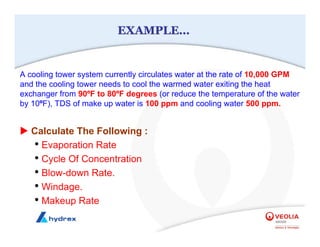
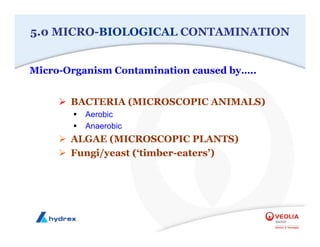

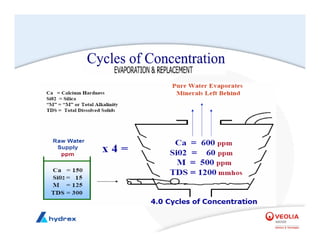
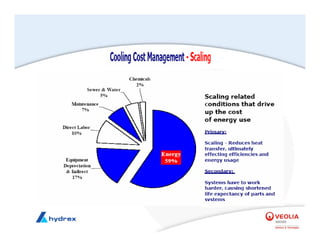
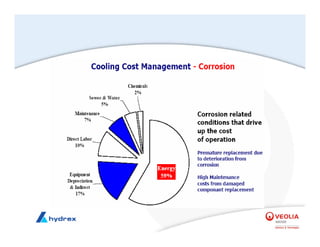
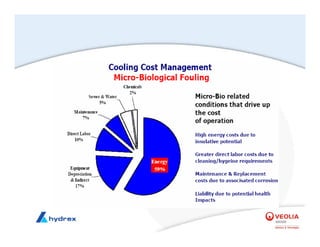
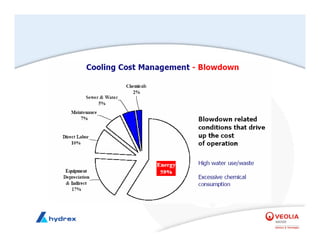
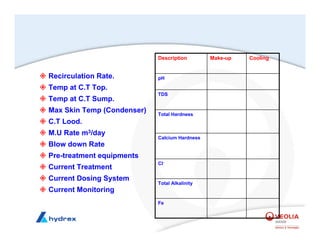
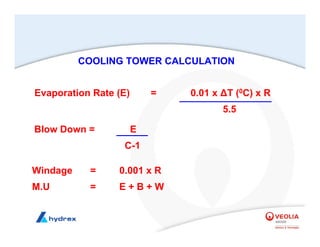
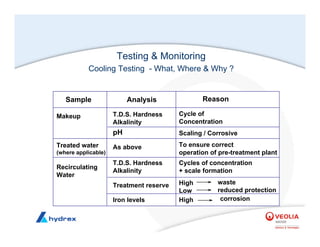
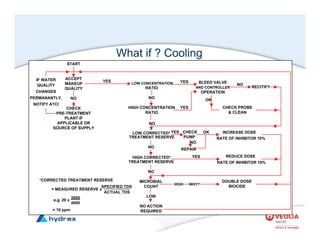

The seminar covers various aspects of cooling towers, including types of cooling systems, definitions, basic water treatment principles, and contamination issues. Key topics include evaporation rates, blowdown rates, cycles of concentration, and the impact of temperature on cooling efficiency. Specific focus is given to the microbiological contamination and corrosion challenges faced in cooling systems.


