Downloaded 571 times


![a r e derived from
w , tThe formulas f o r calculation of p
the ideal gas law.
w i t h data reported by Research - Cottrell (11).
and p
a ,t
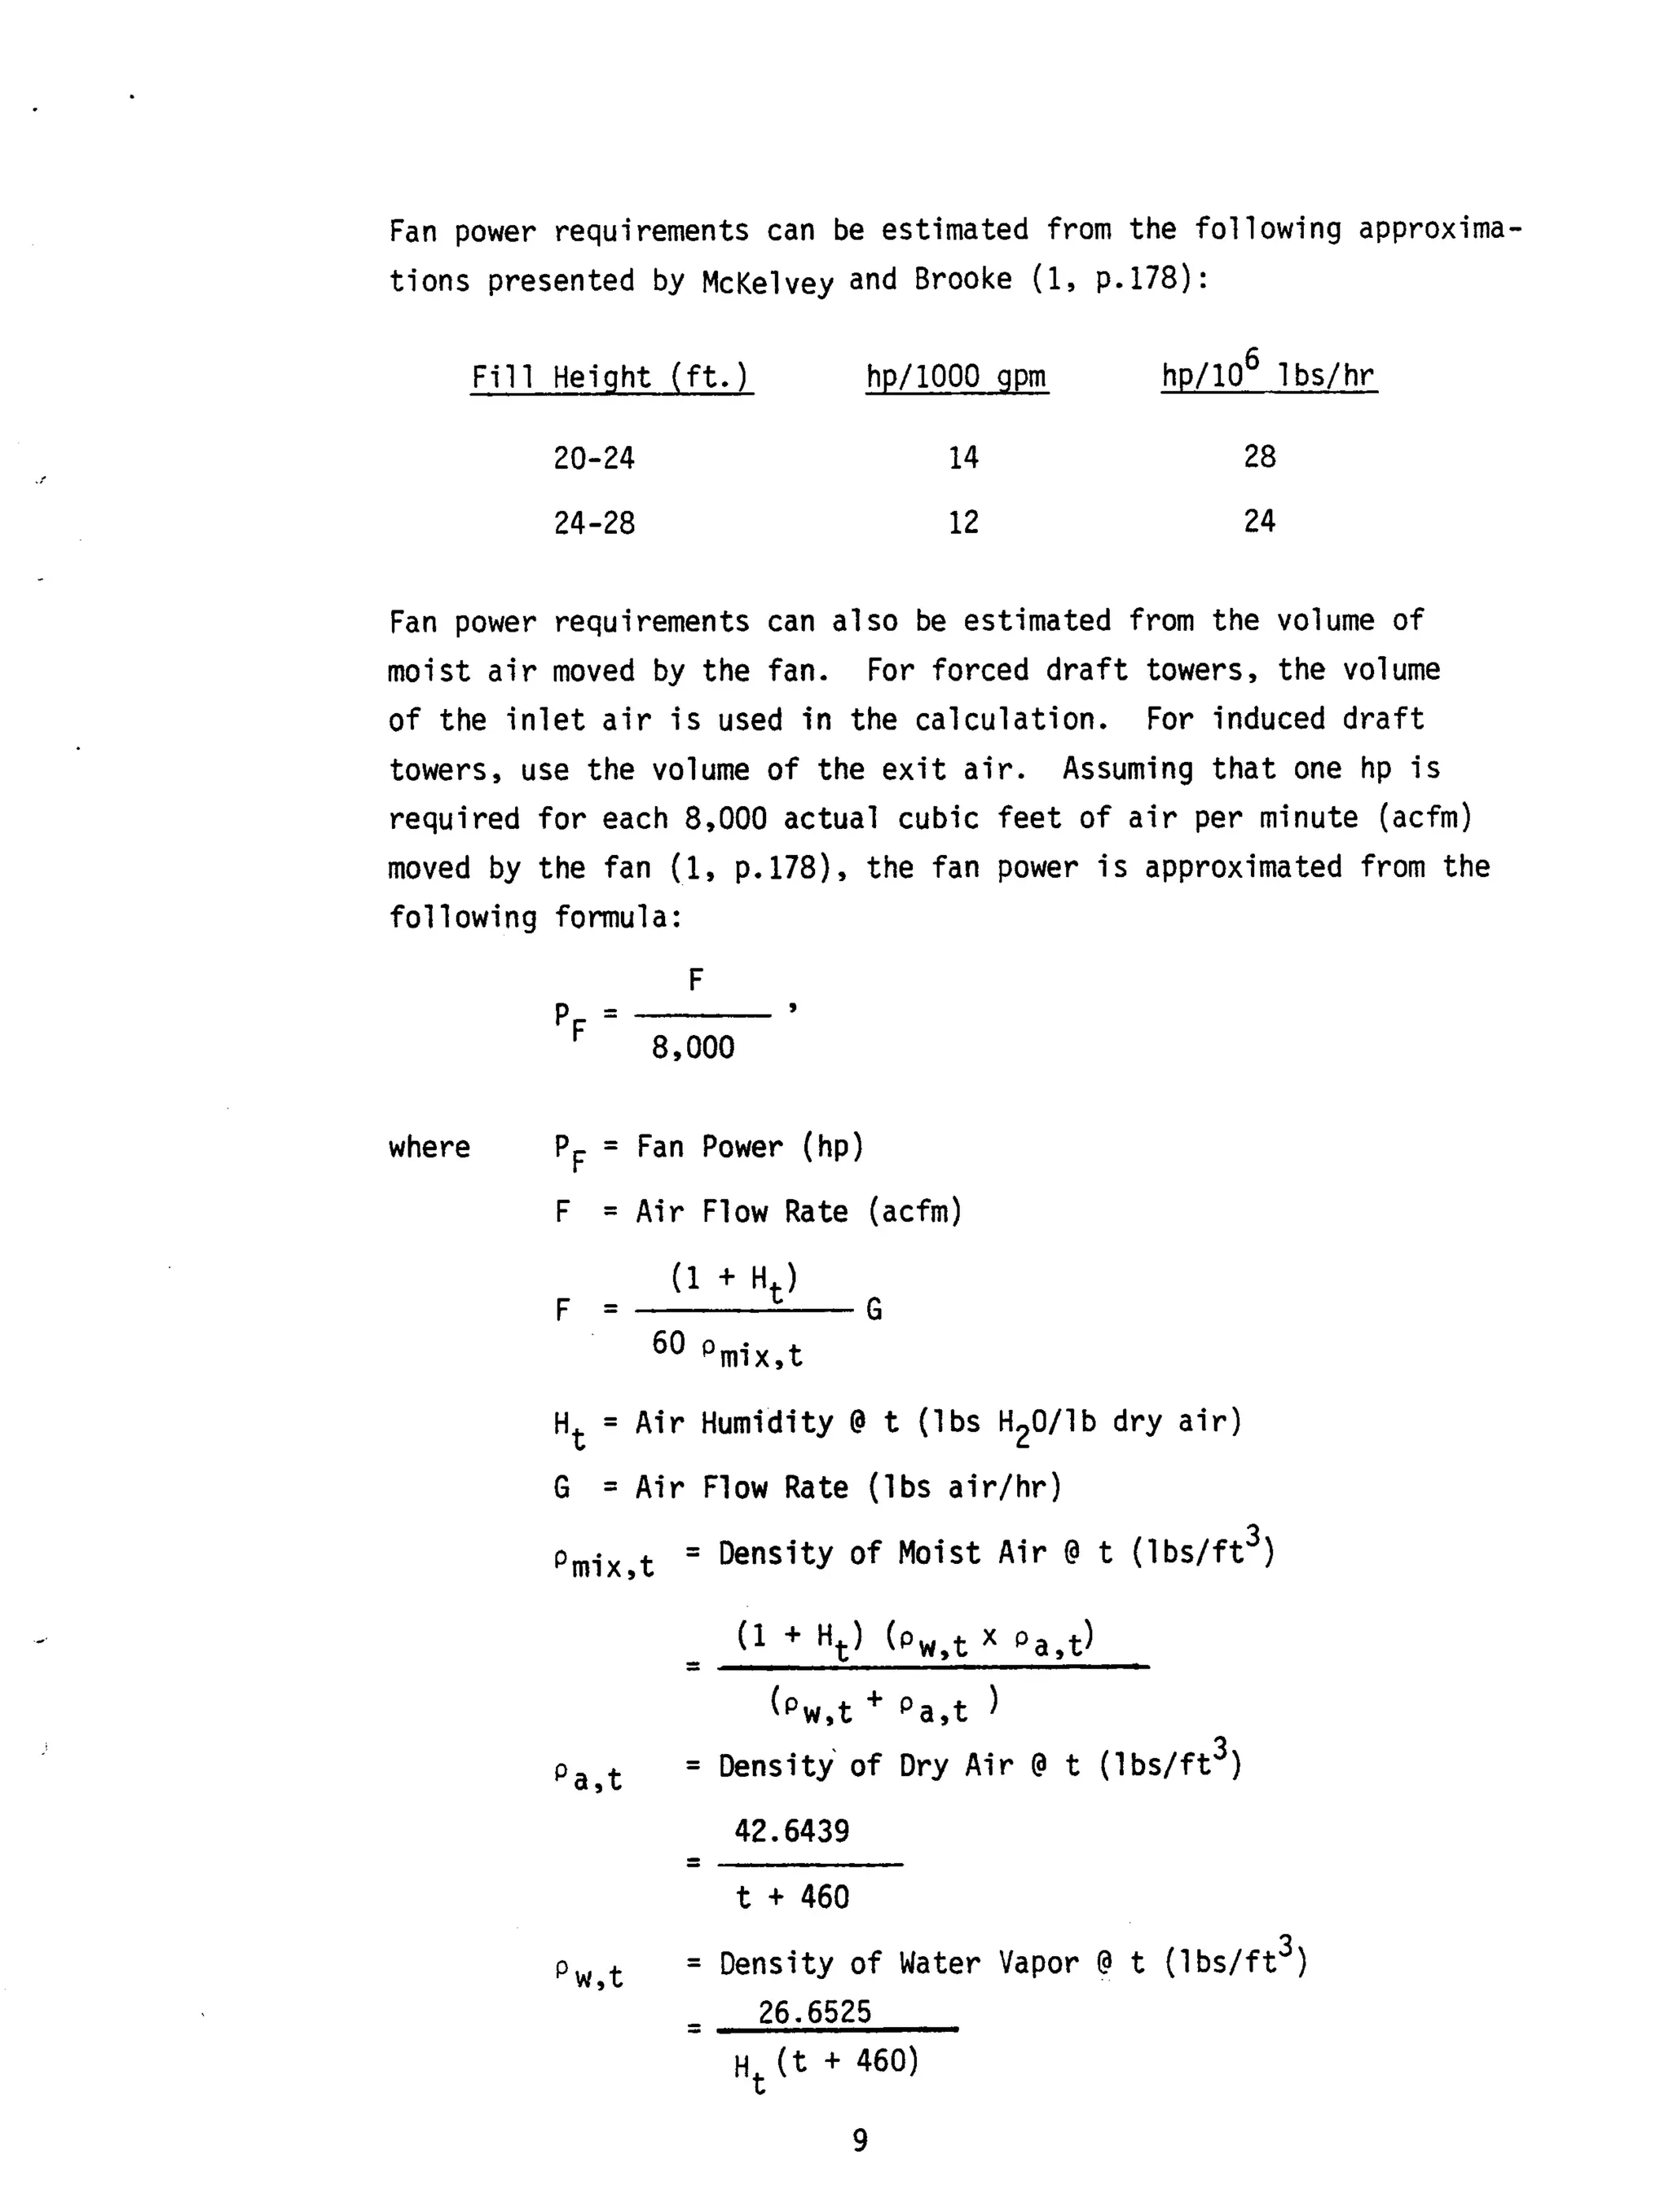
The assumption of 1 hp/8,000 acfm is consistent
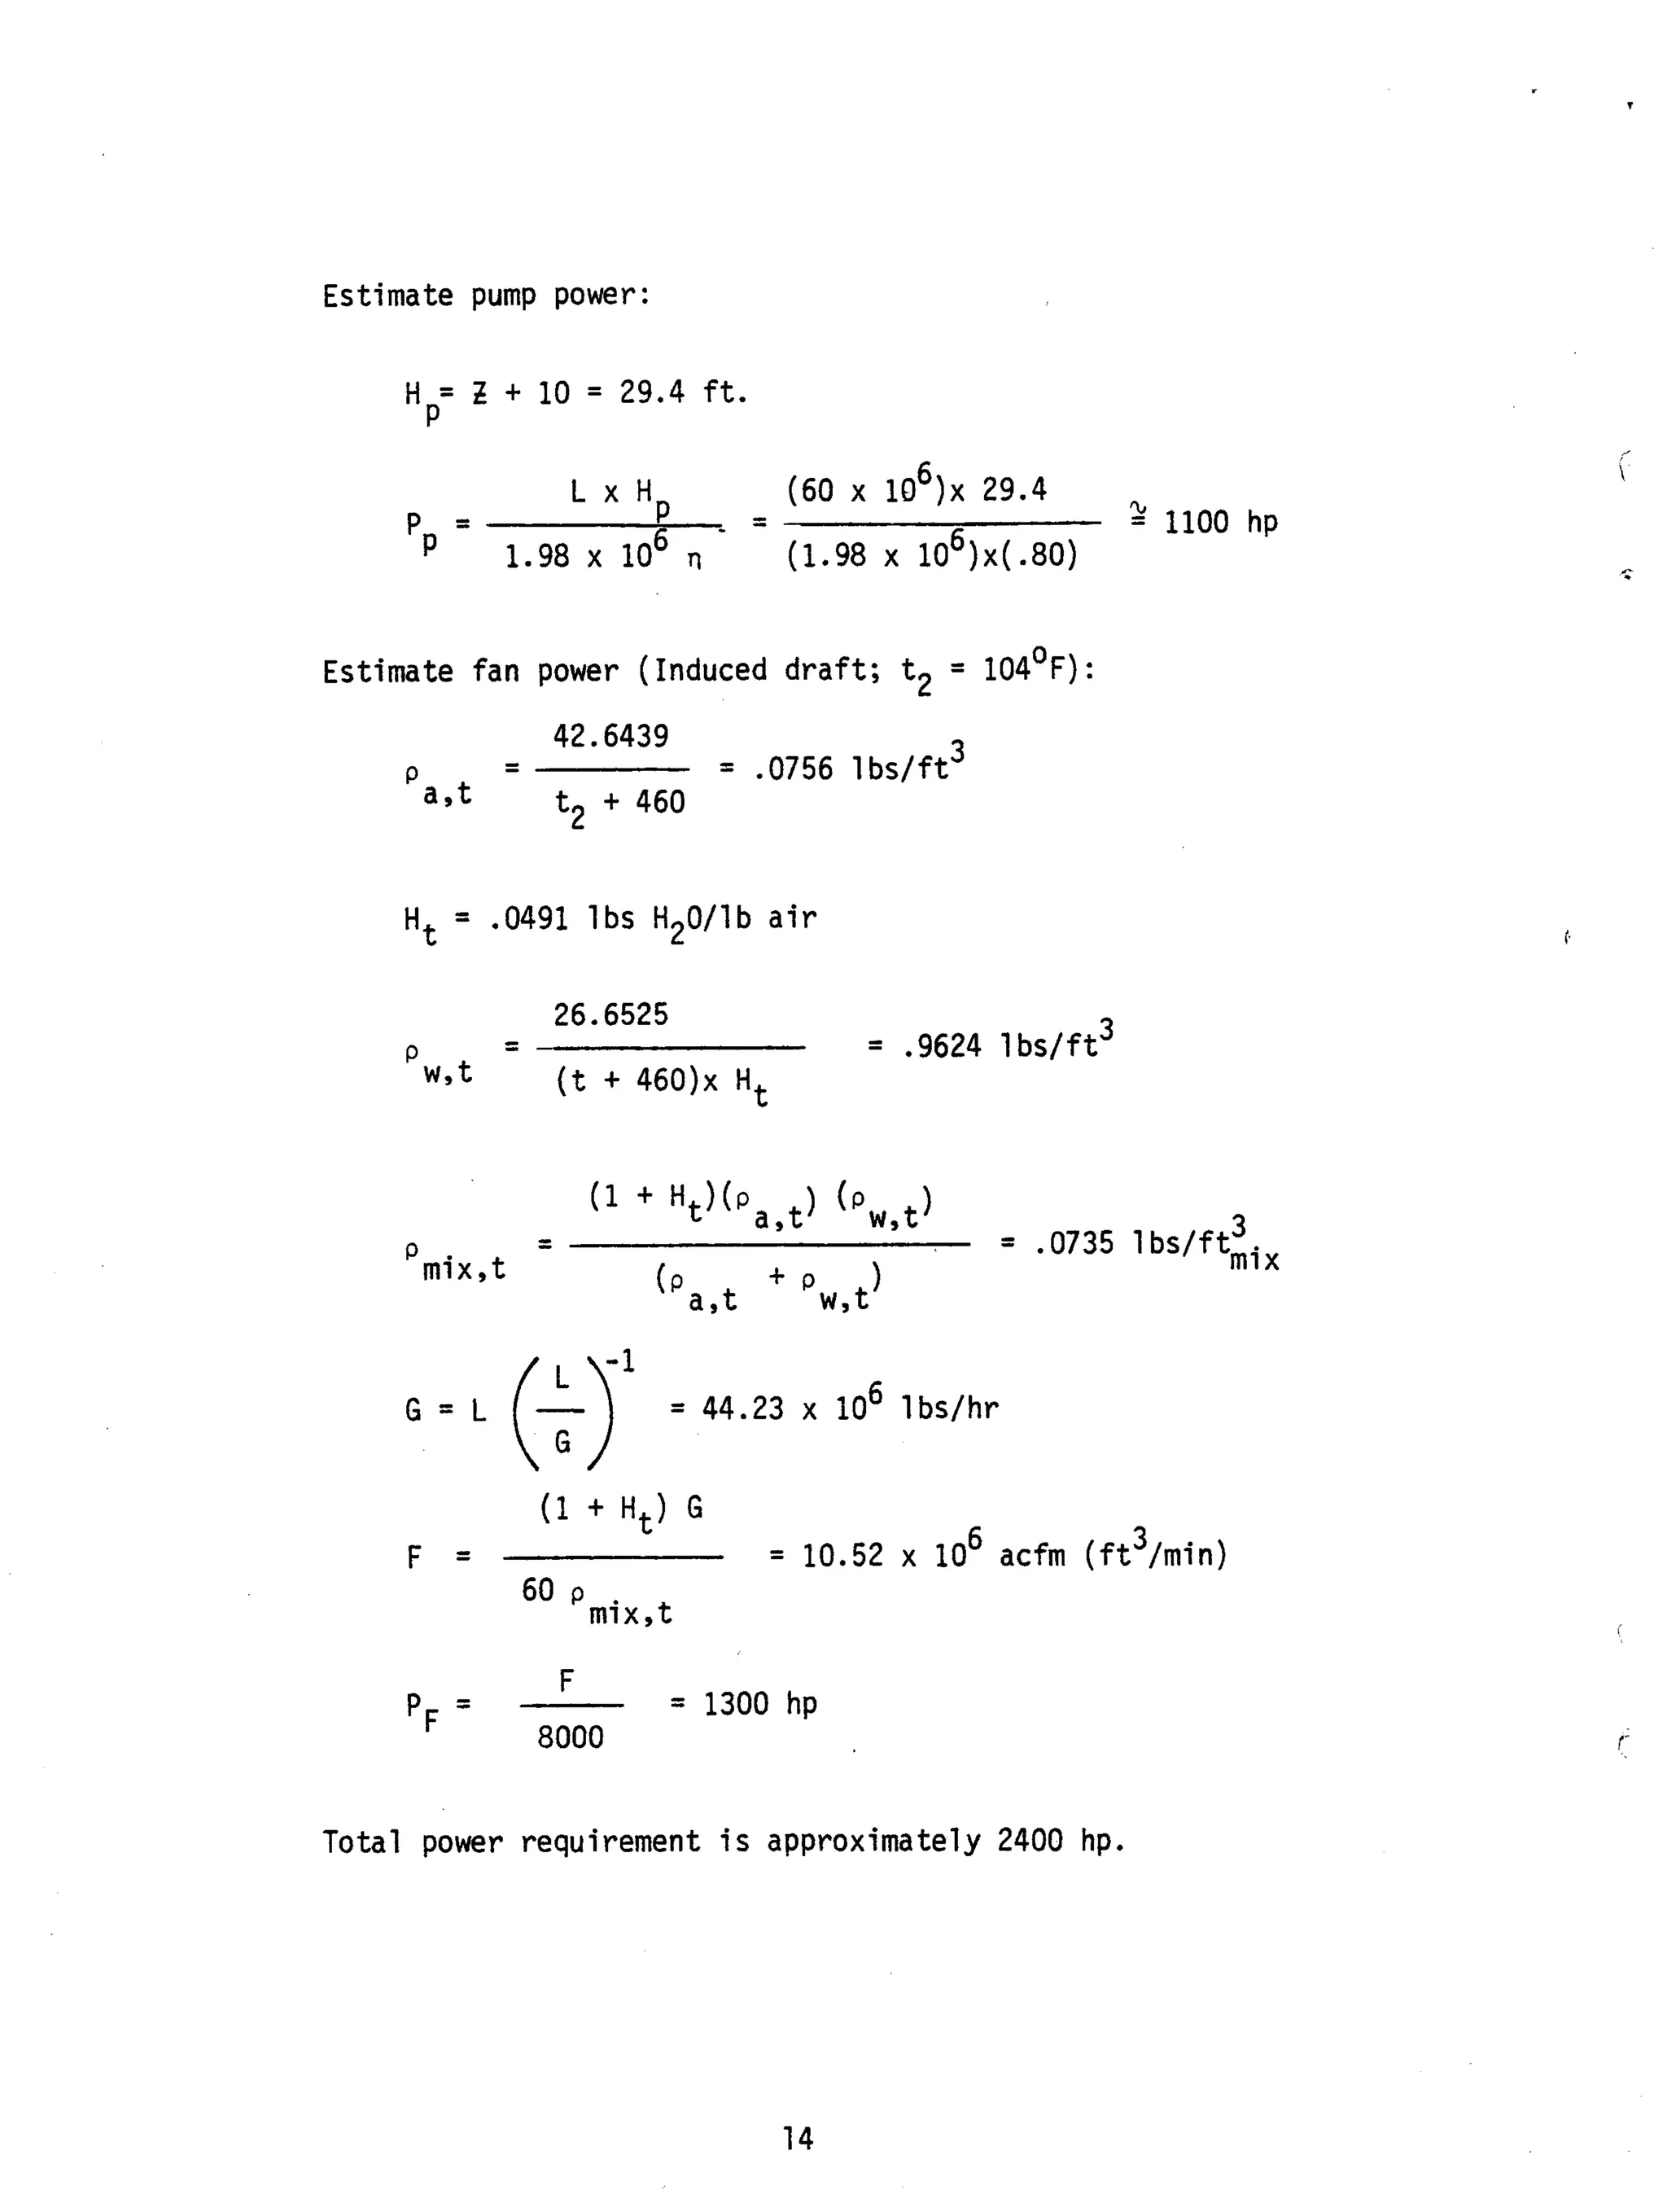
The total power is obtained by adding fan power and pump power.
McKelvey and Brooke (1, p.179) present a method f o r approximating
total power requirements from range, appoach, design wet-bul b temper-
ature and water flow rate.
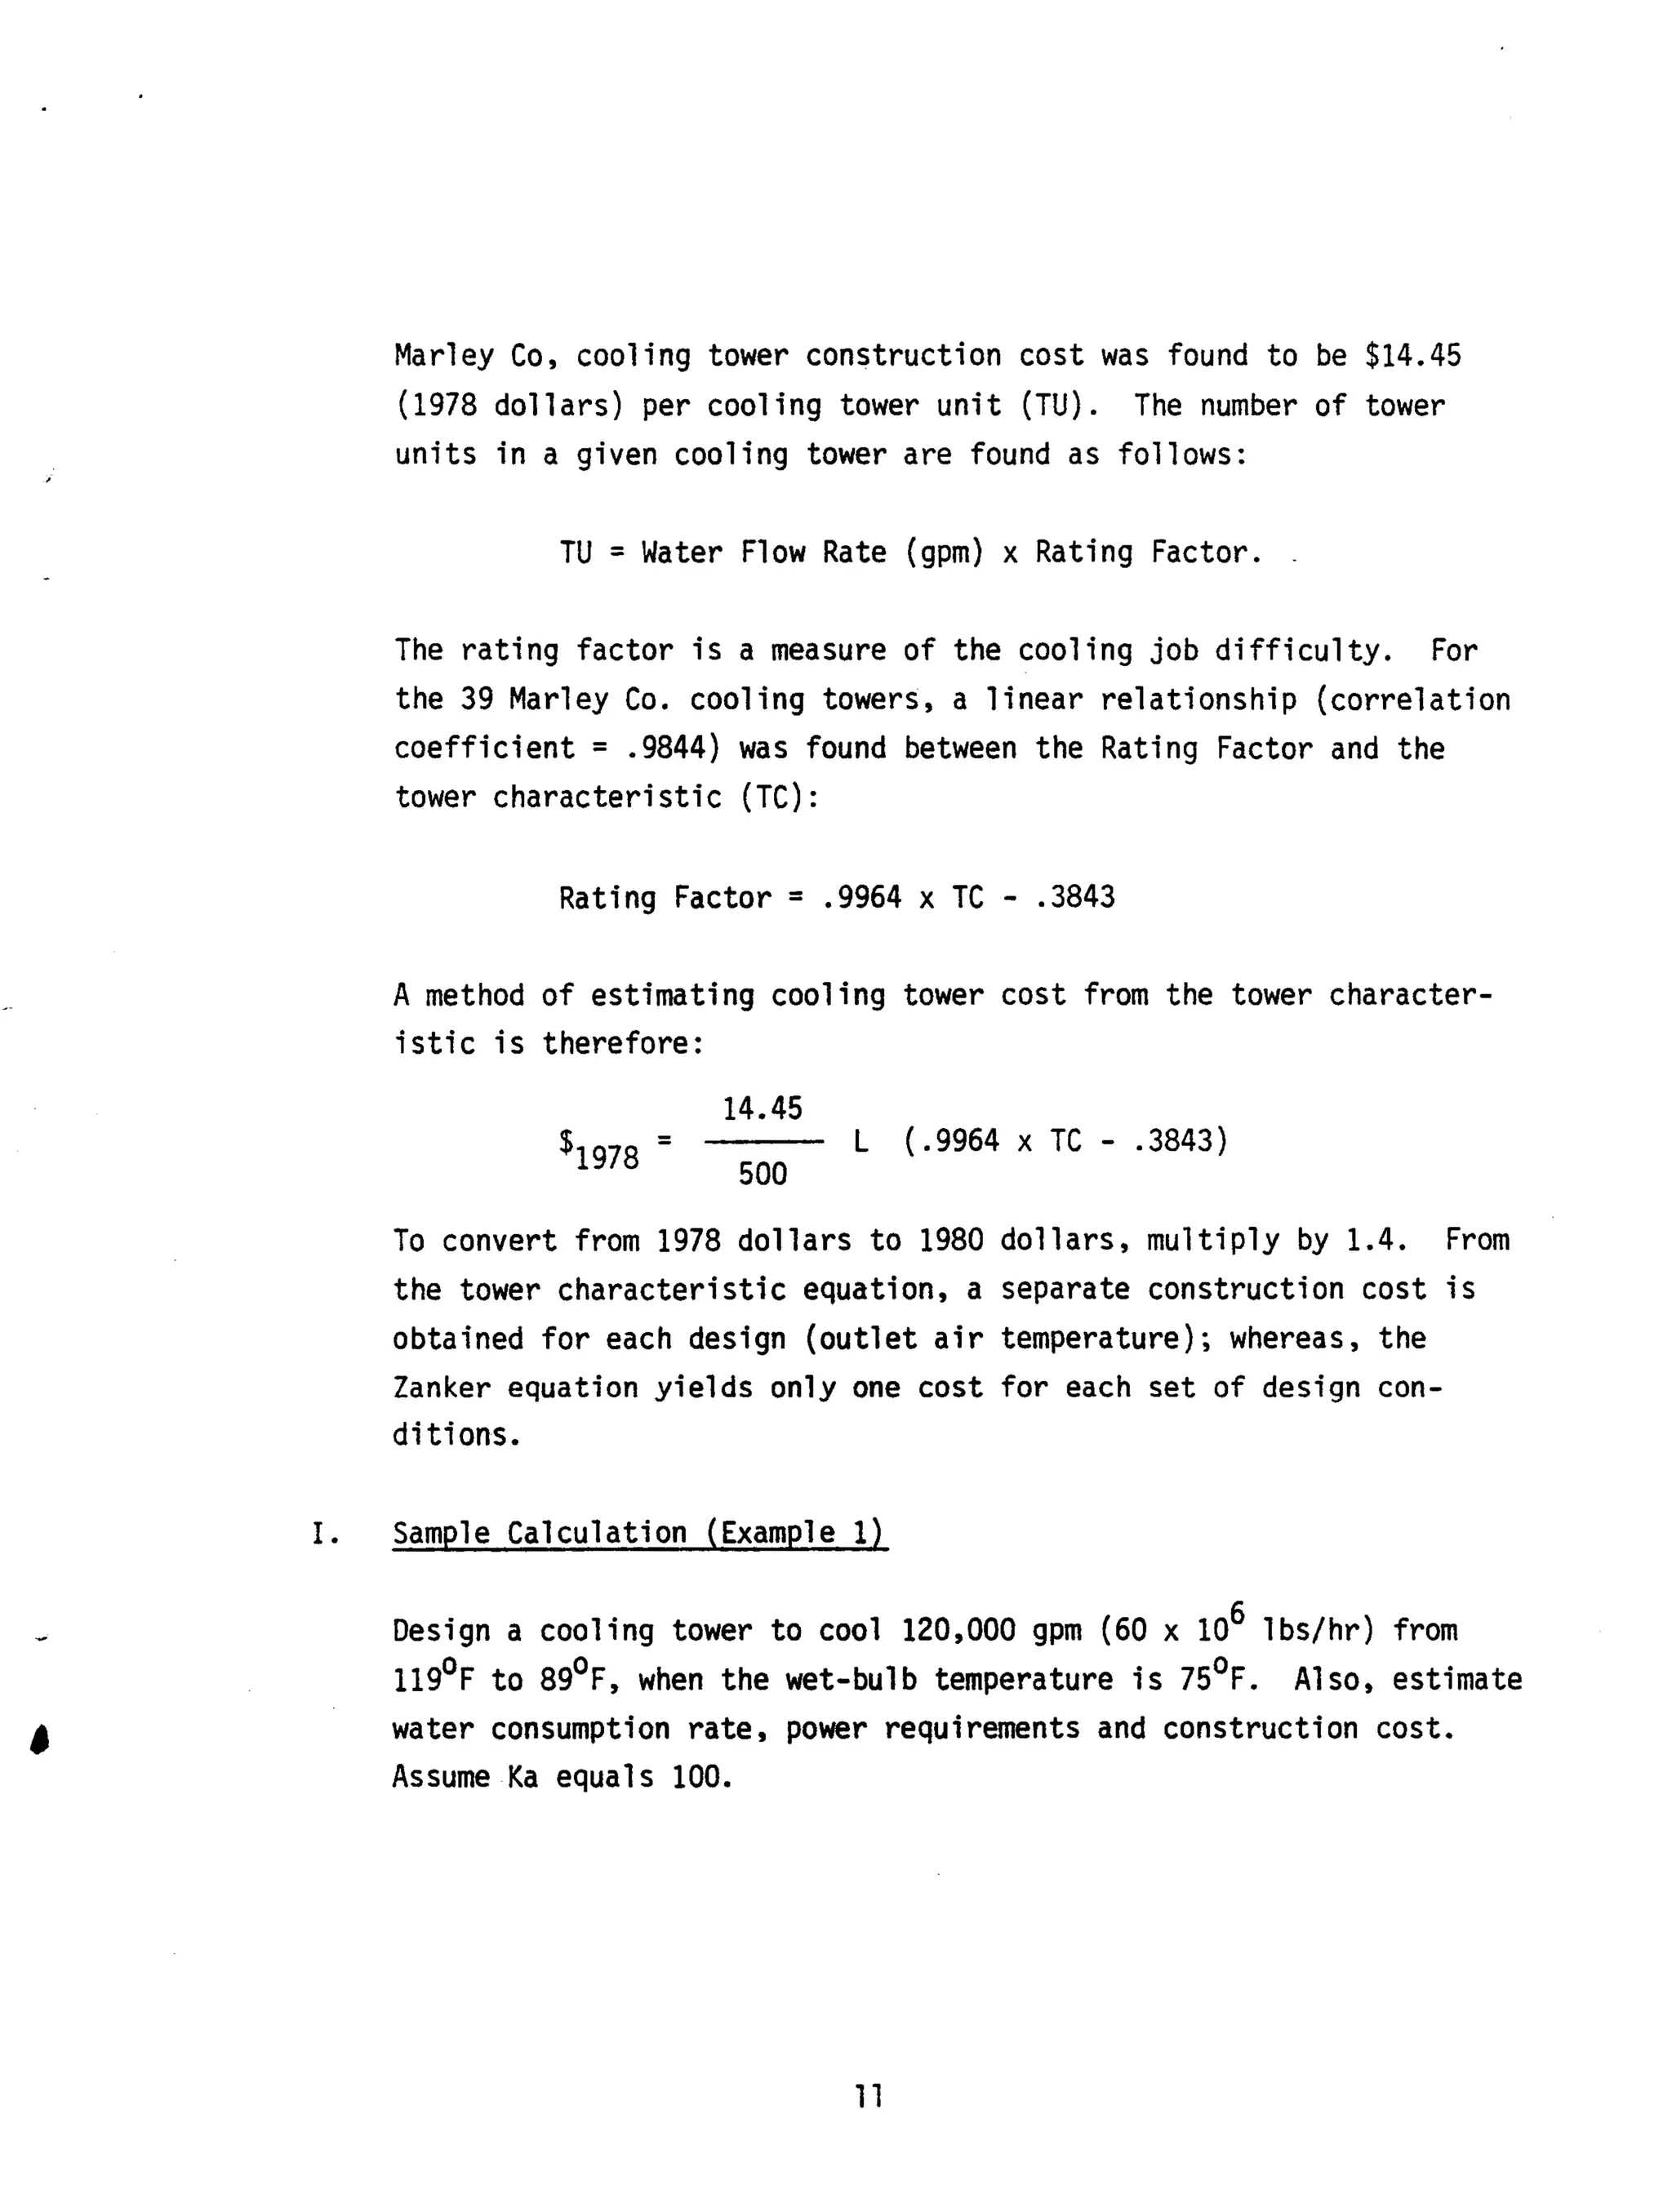
H. Cost Estimation
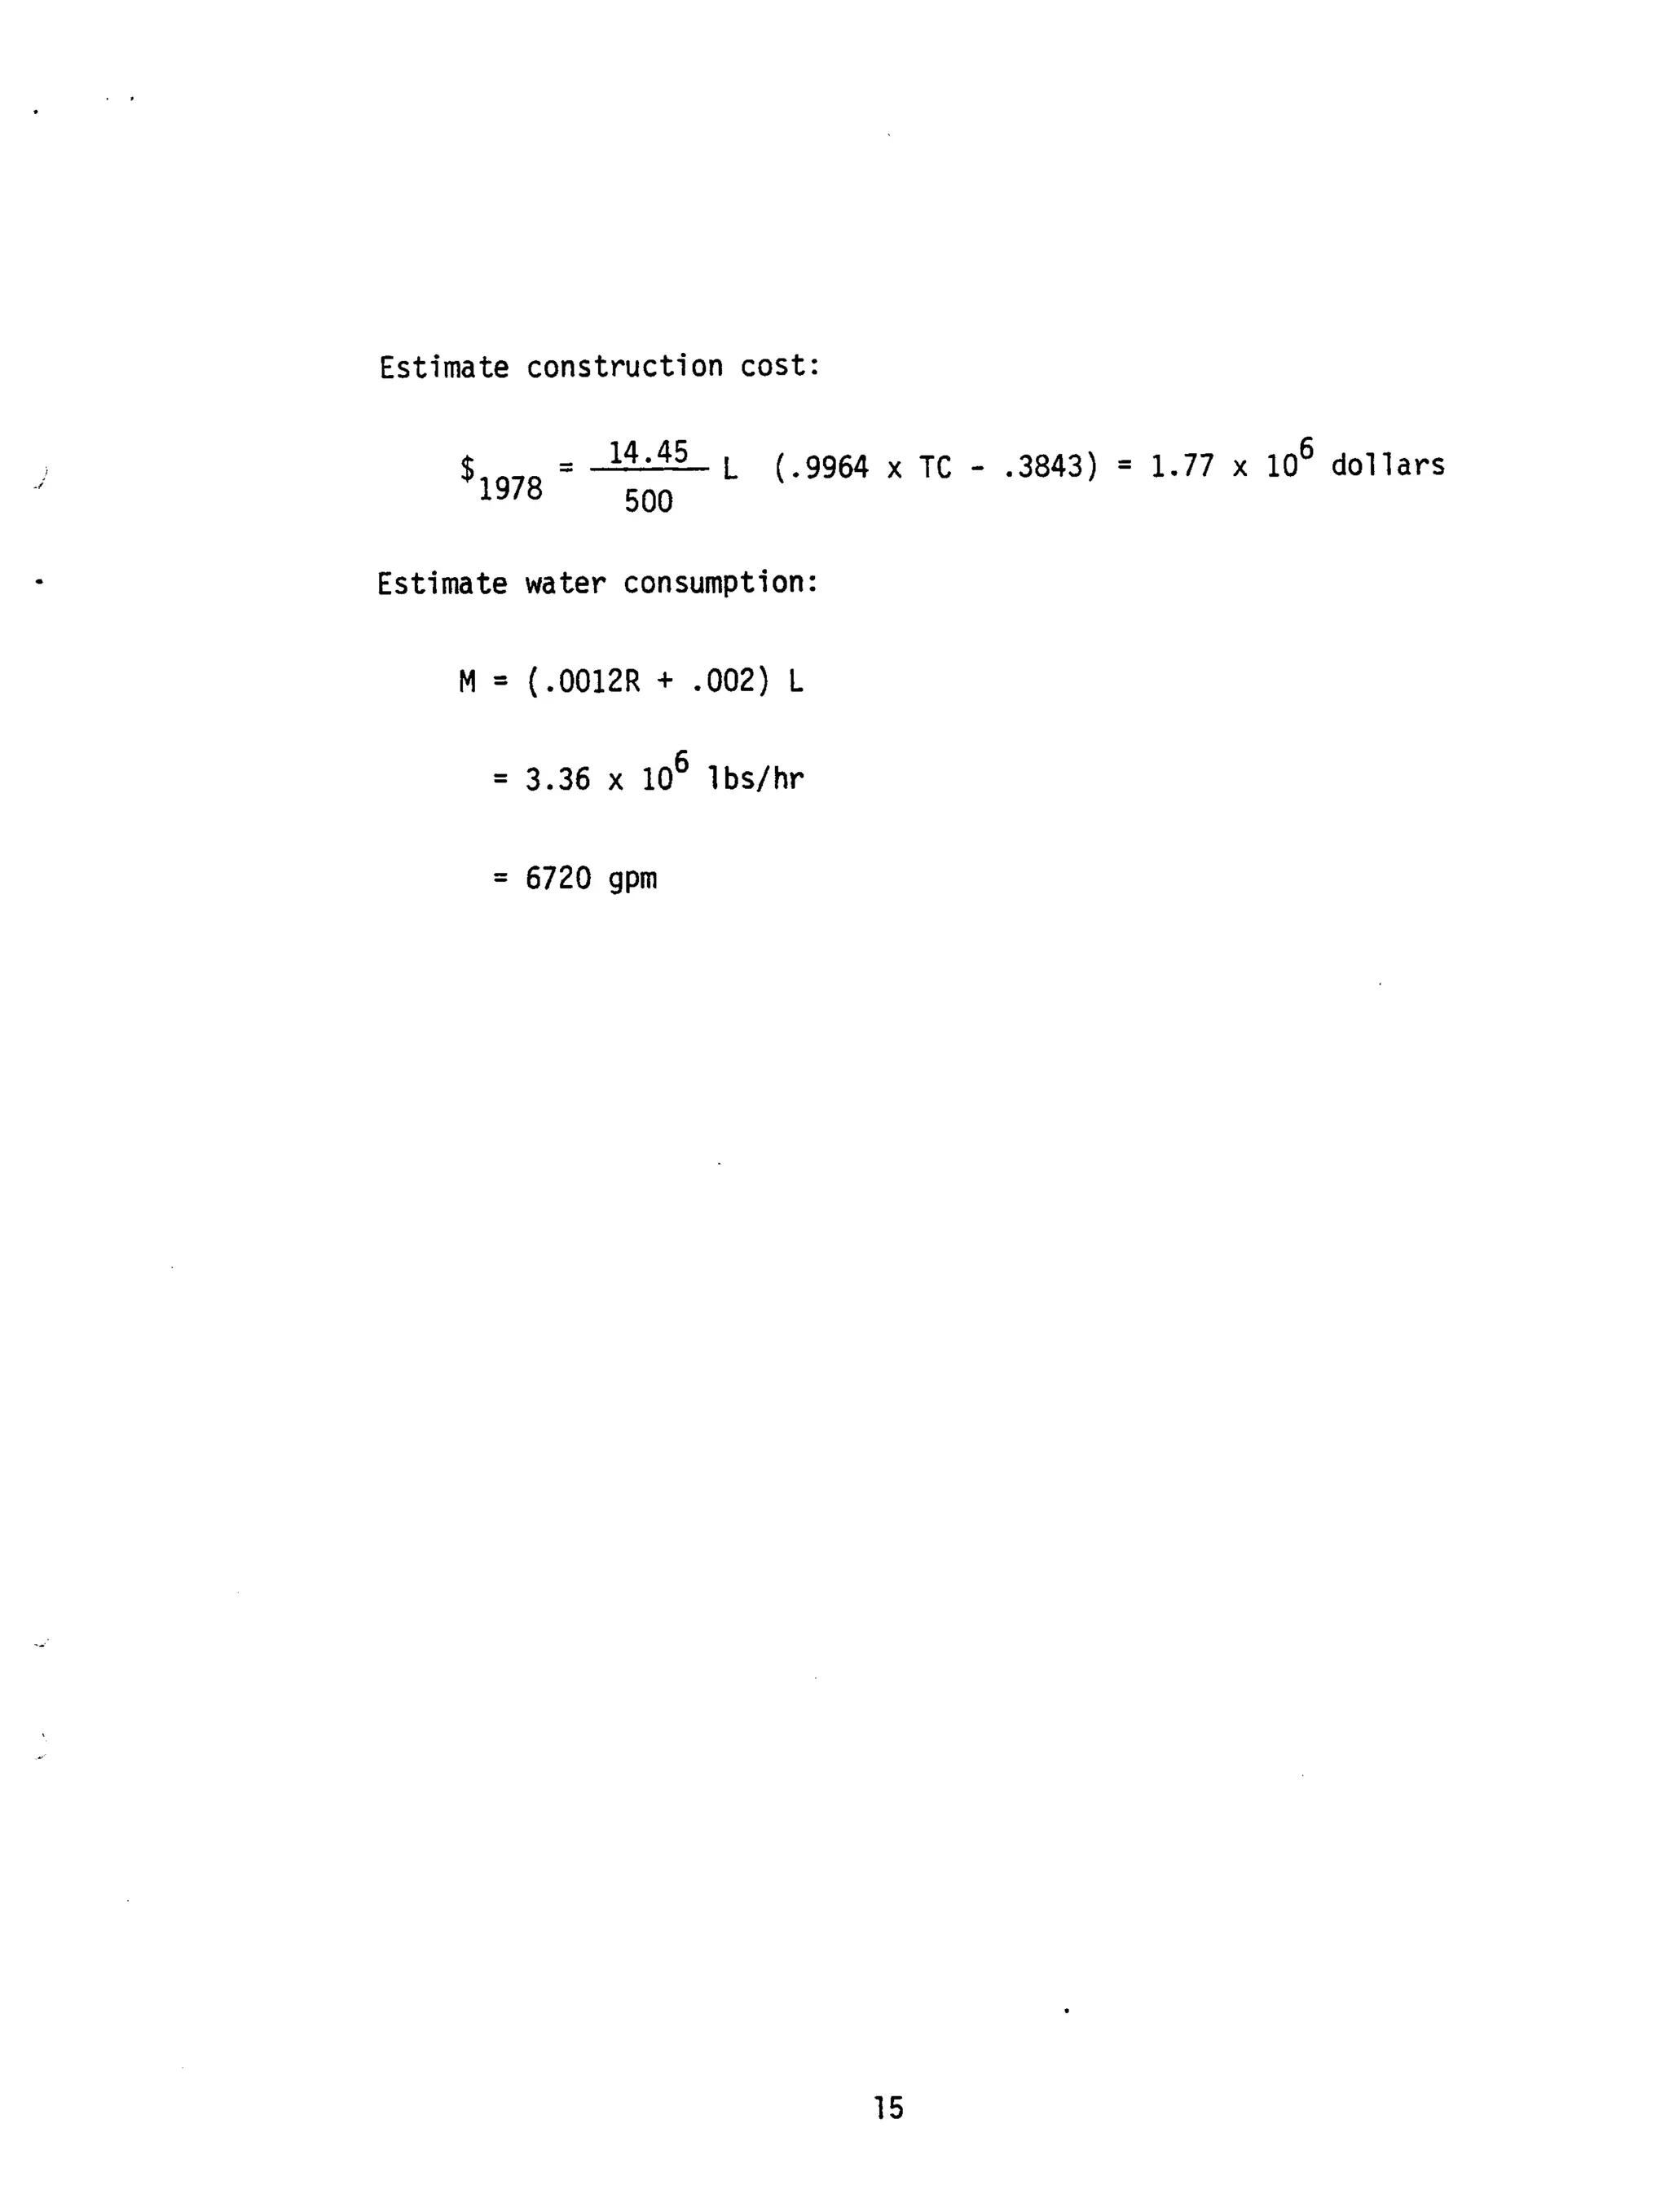
Zanker (12) has derived an equation f o r the estimation o f cooling
tower construction cost:
Q--
$1967 C x A + 39.2R - 586
= 1967 dollars
where $1967
Q = Total Heat Load (Btu/hr)
R = Range (OF)
A = Approach ( O F )
279
C =
[1 t 0.0335 (85 - twb)1.143]
= Design Wet-Bul b Temperaturetwb
Multiplication of 1967 dollars by 2.7 [l.0813] will approximately
correct t o 1980 dollars.
Dickey (9) presents a method f o r estimation of cooling tower con-
struction costs. From analysis of 39 cooling towers b u i l t by
10](https://image.slidesharecdn.com/coolingtowercalculation11-170129220354/75/Cooling-tower-calculation-1-1-18-2048.jpg)
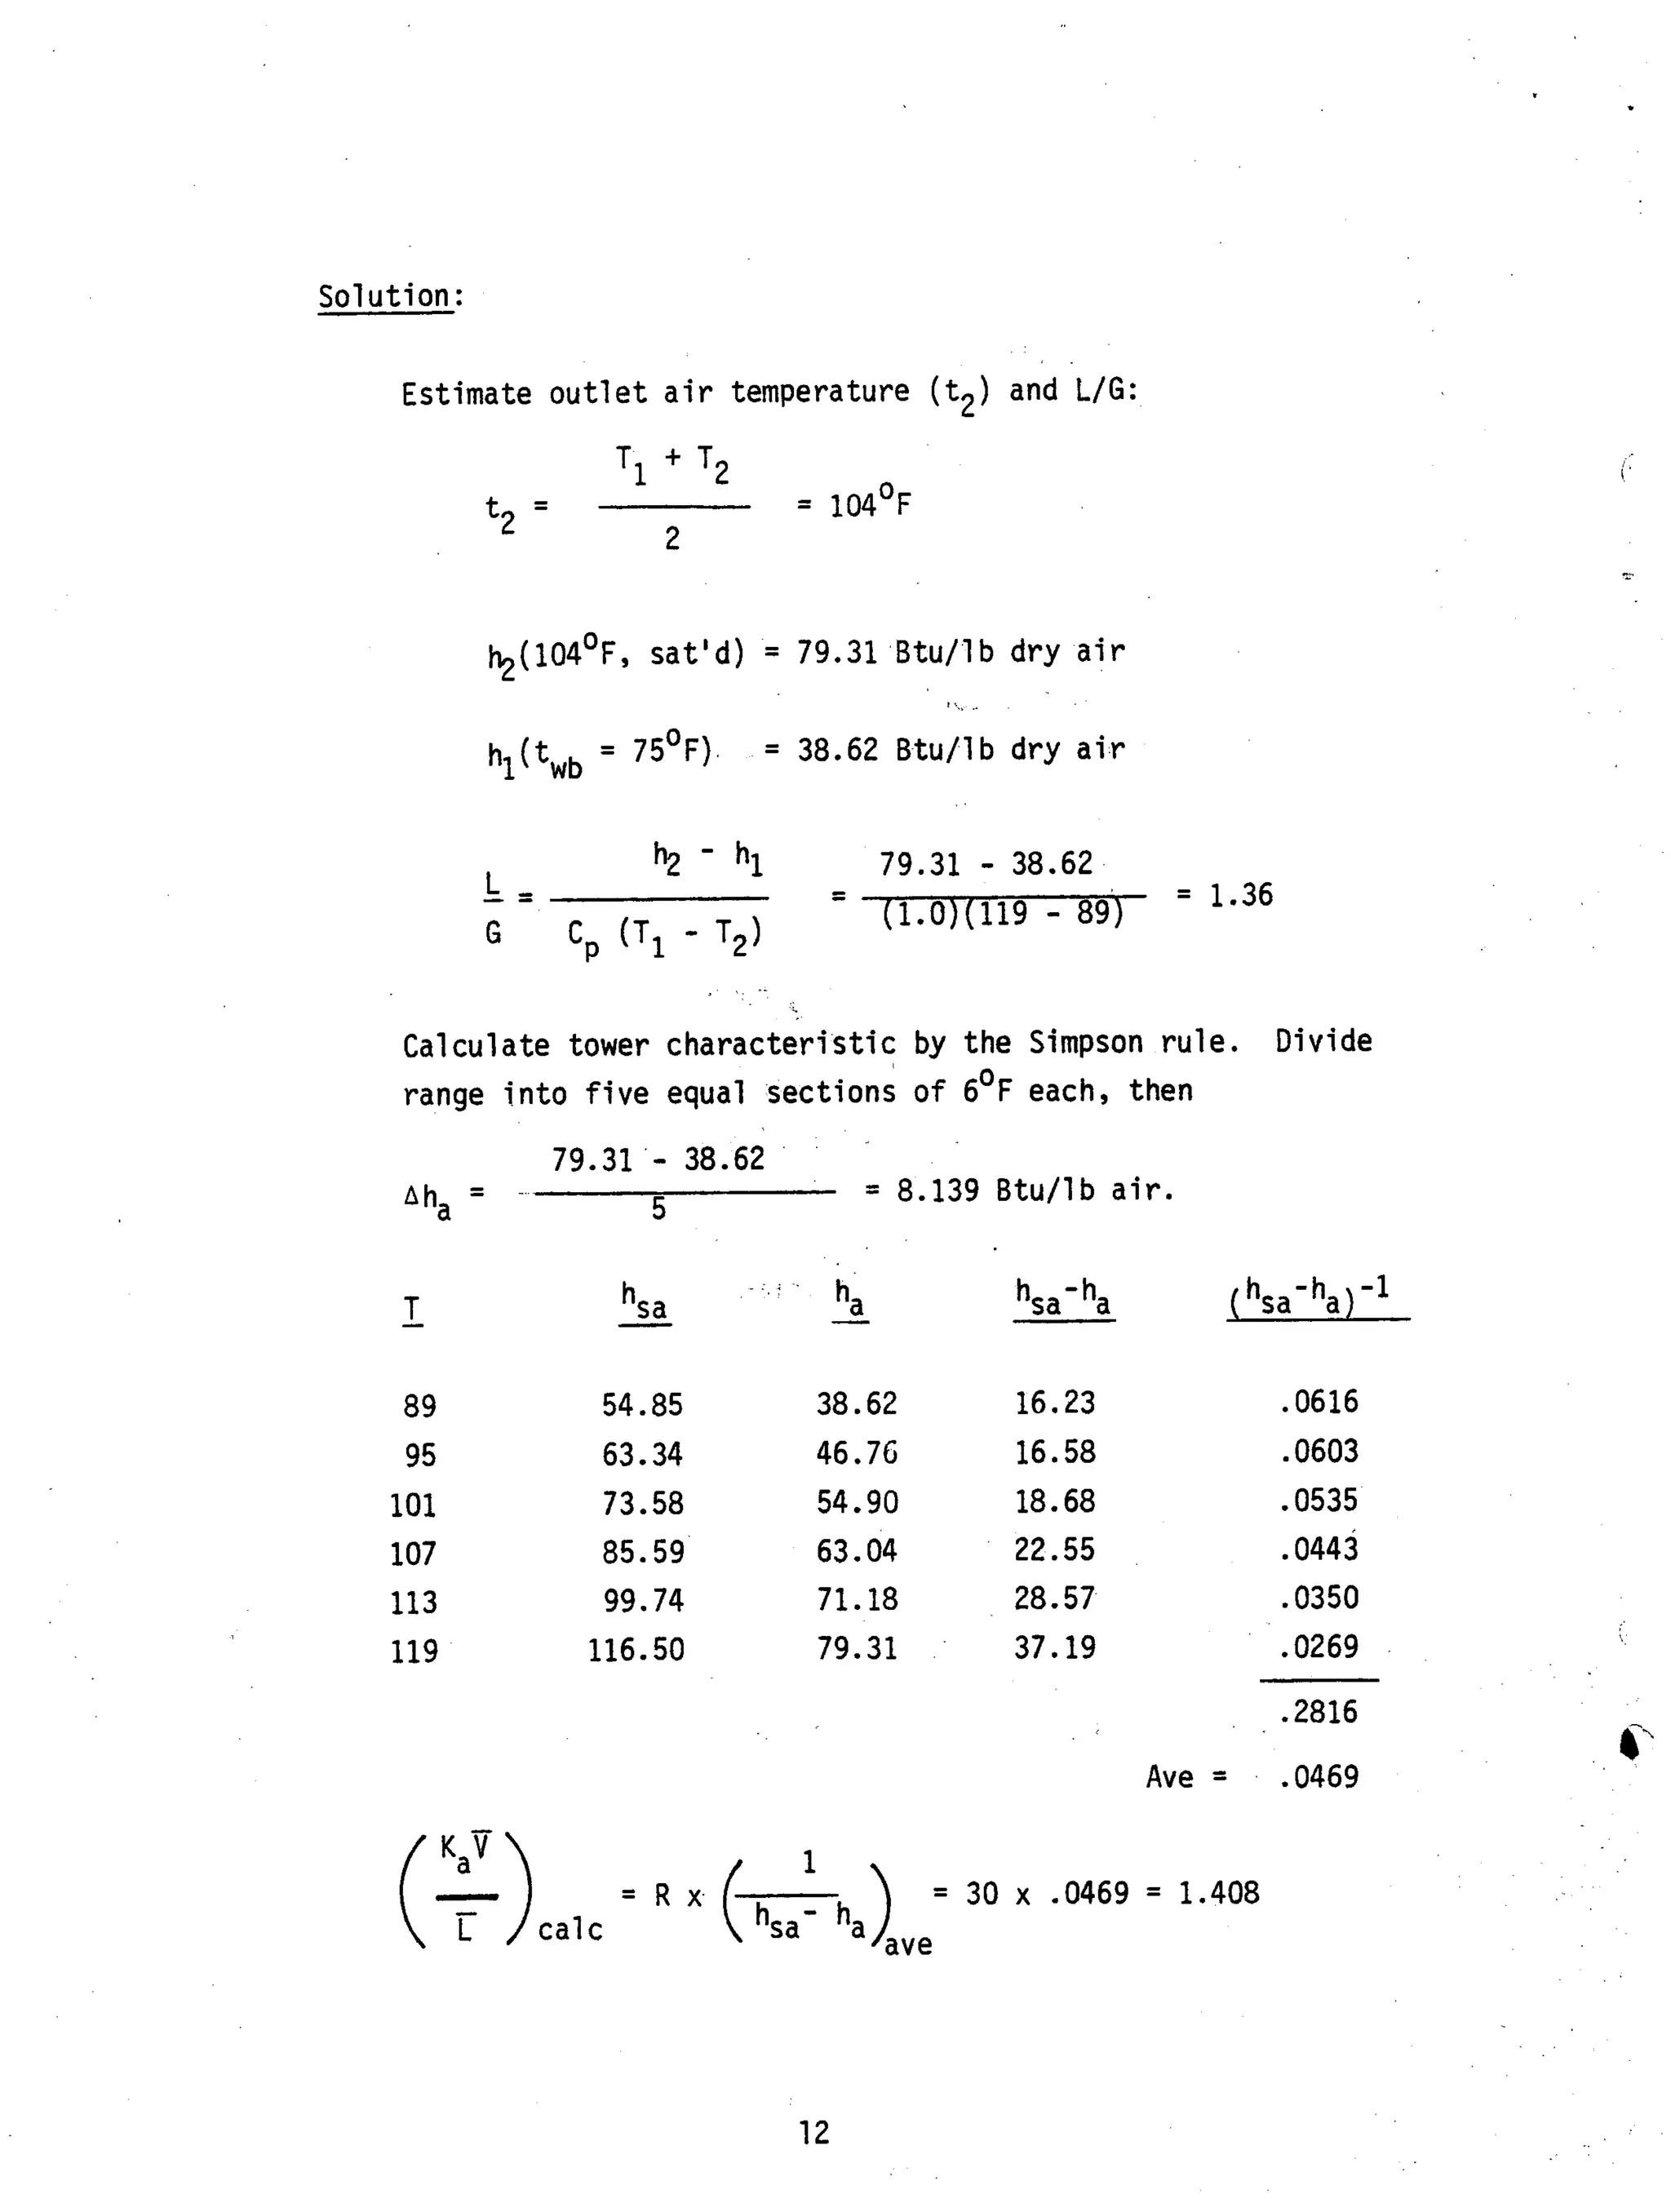


This document presents a rule-of-thumb design procedure for wet cooling towers that can be used for power plant cycle optimization. It begins with defining the design problem and specifying inlet/outlet water temperatures and ambient wet-bulb temperature. It then provides methods to calculate the outlet air temperature, tower characteristic, loading factor, and other key parameters. These include using the average of inlet/outlet water temperatures to approximate outlet air temperature, graphically integrating the Merkel equation to determine tower characteristic, and using graphs to determine the optimum loading factor based on design conditions. The goal is to provide simplified methods for estimating cooling tower dimensions, performance, costs and other details needed for power plant analysis without requiring detailed iterative design calculations.


