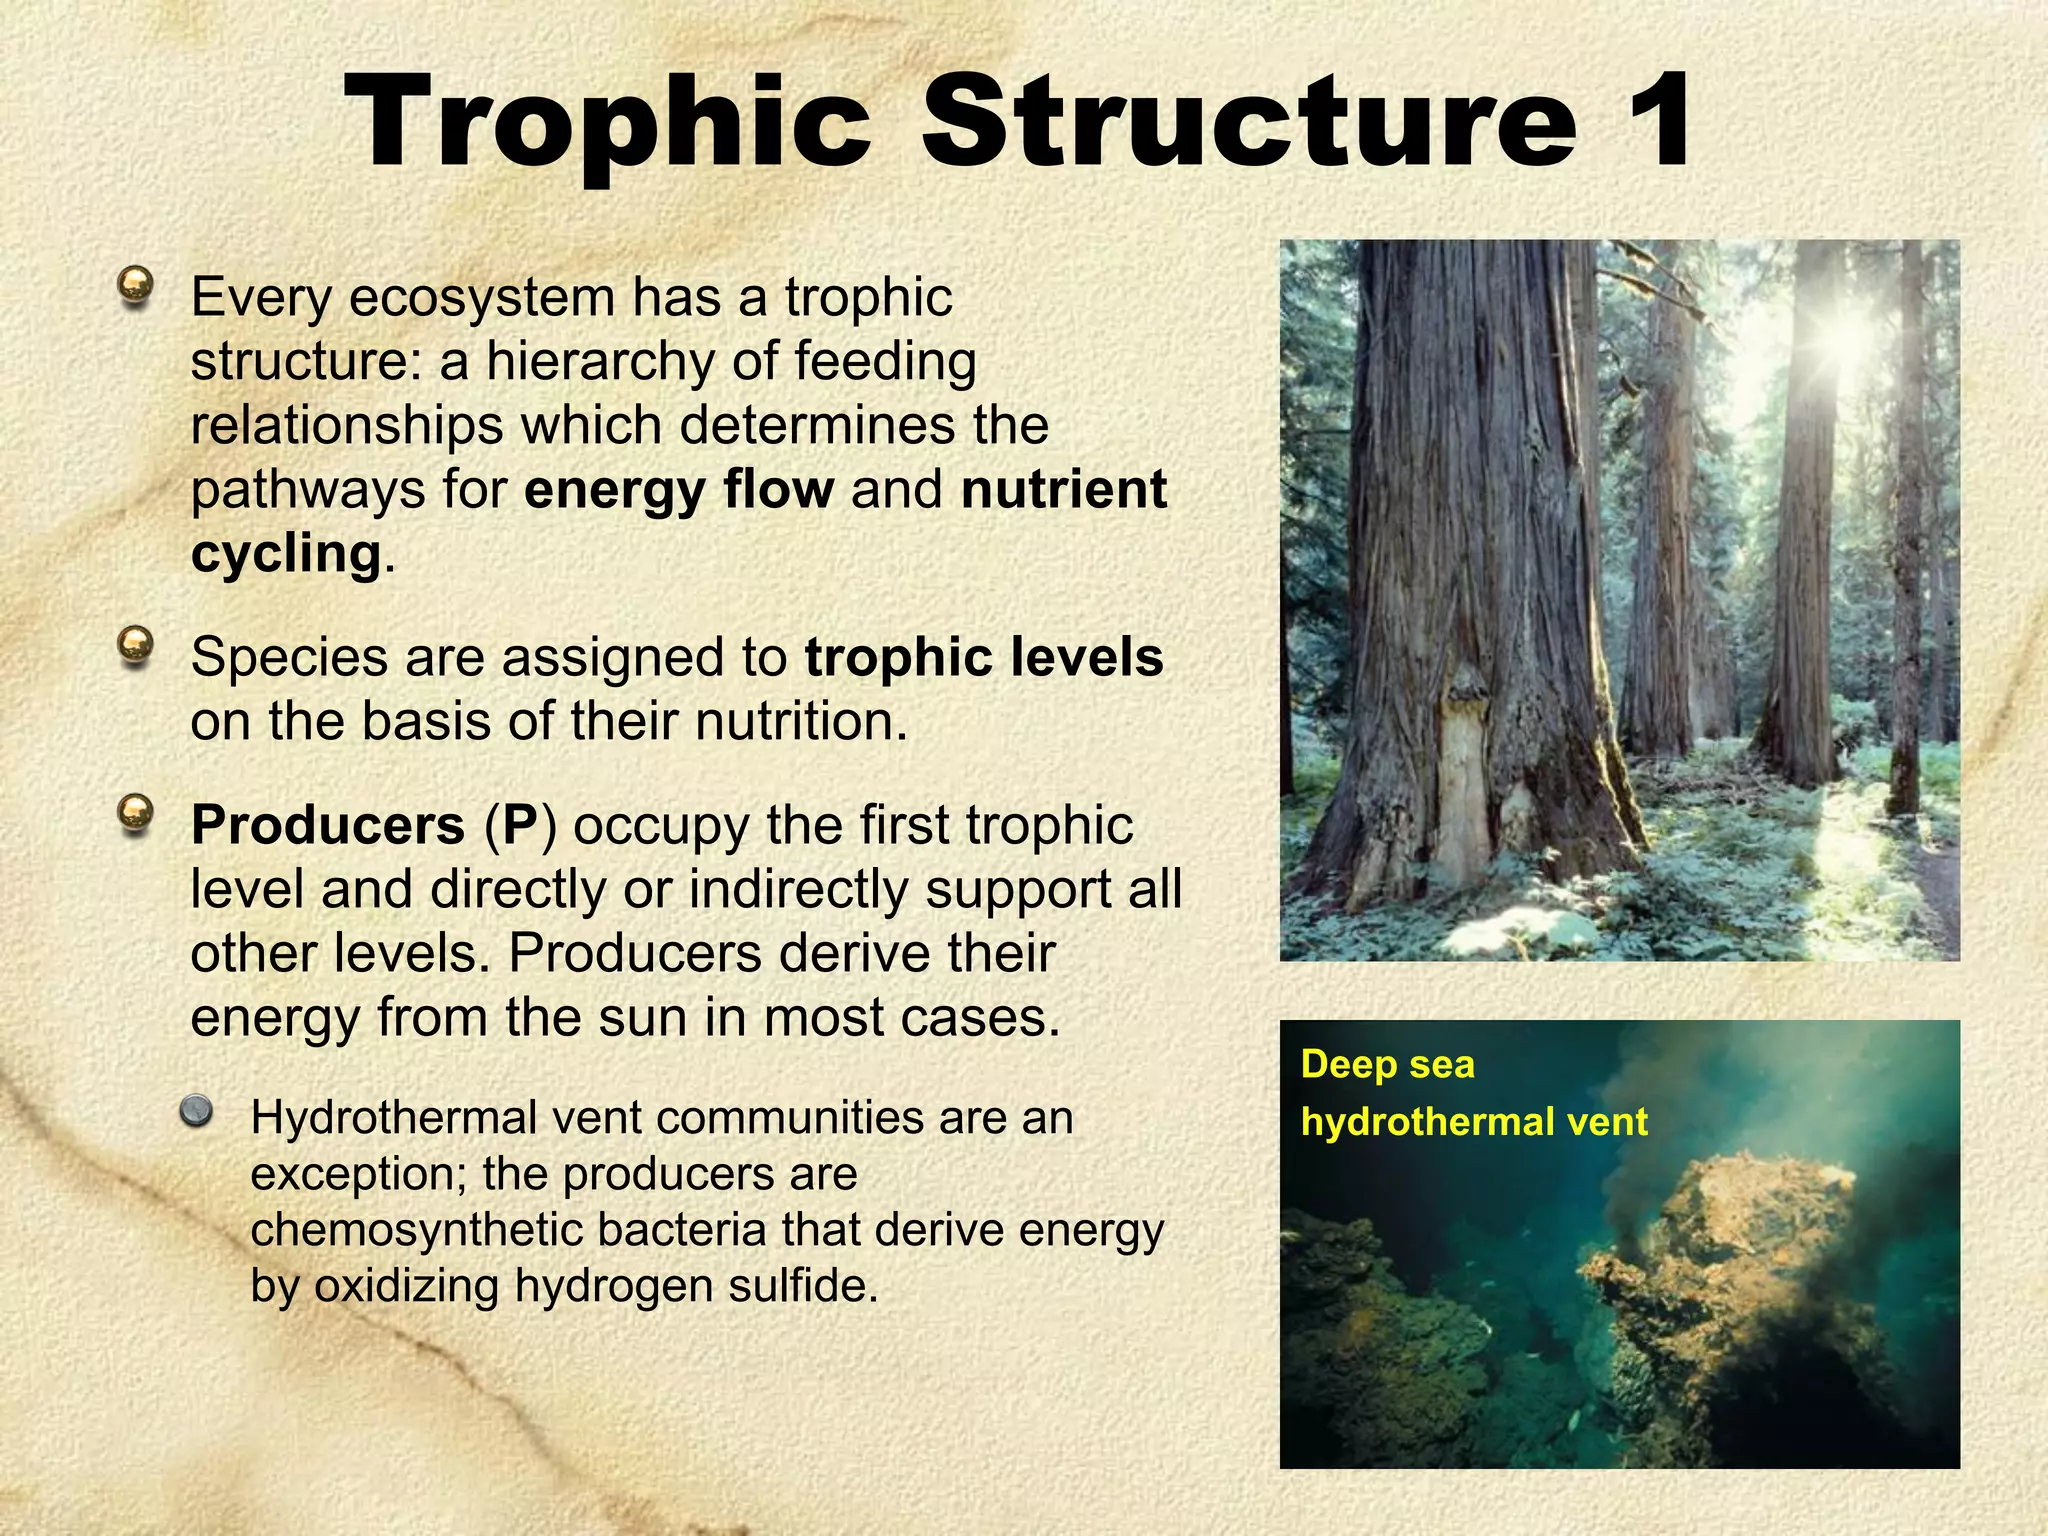
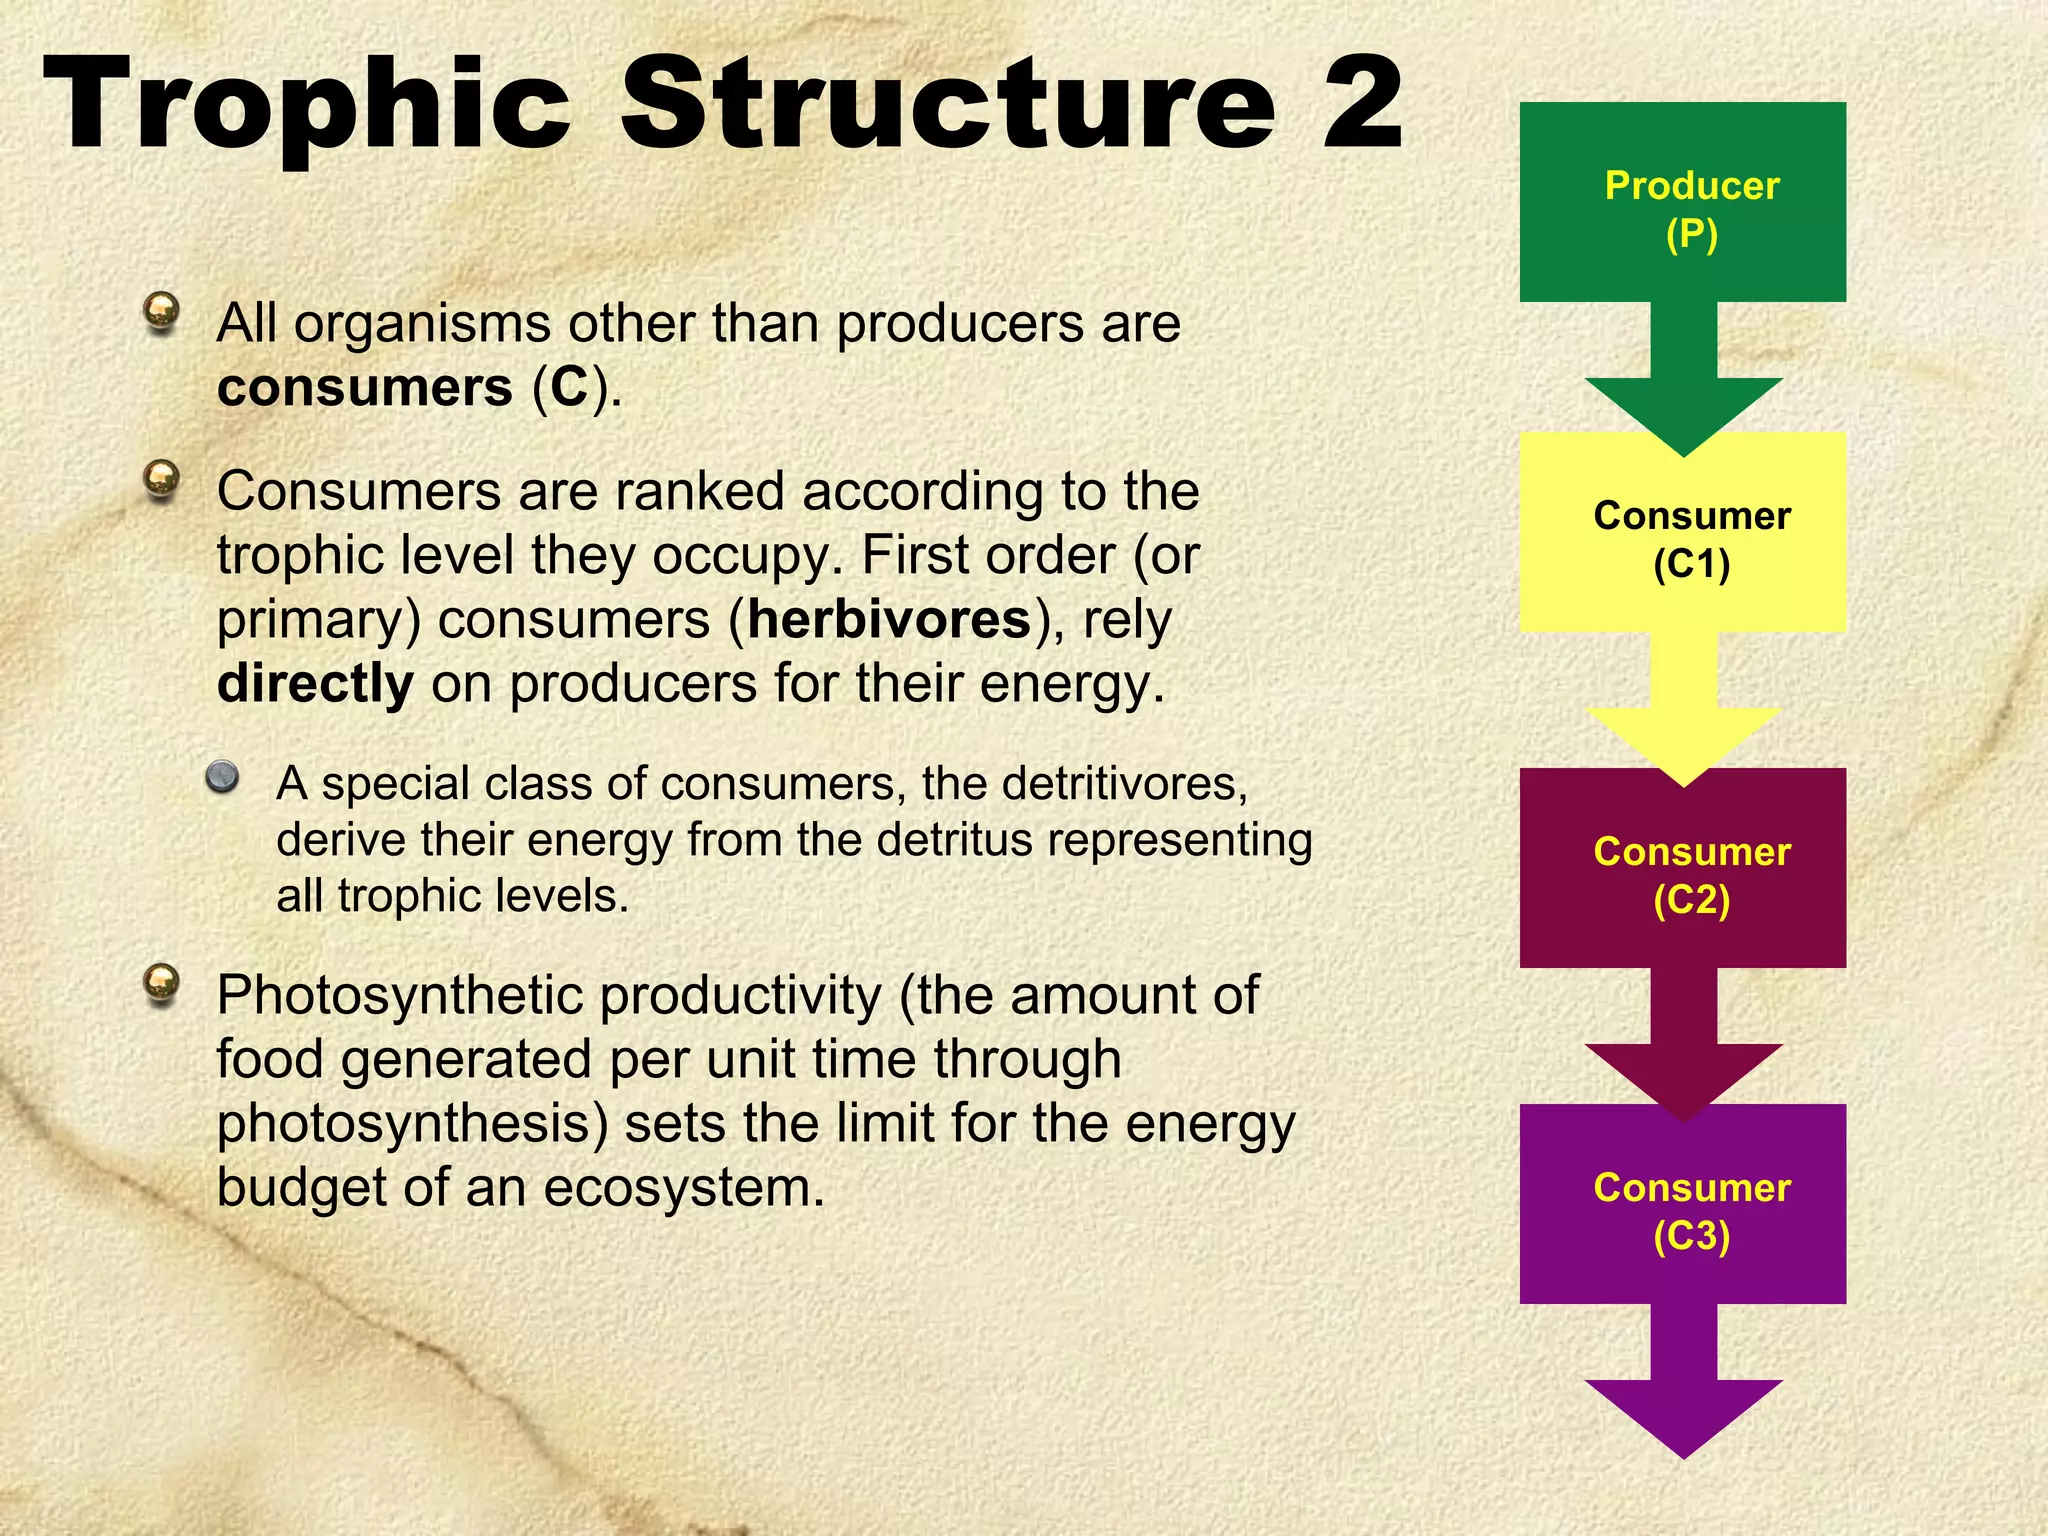
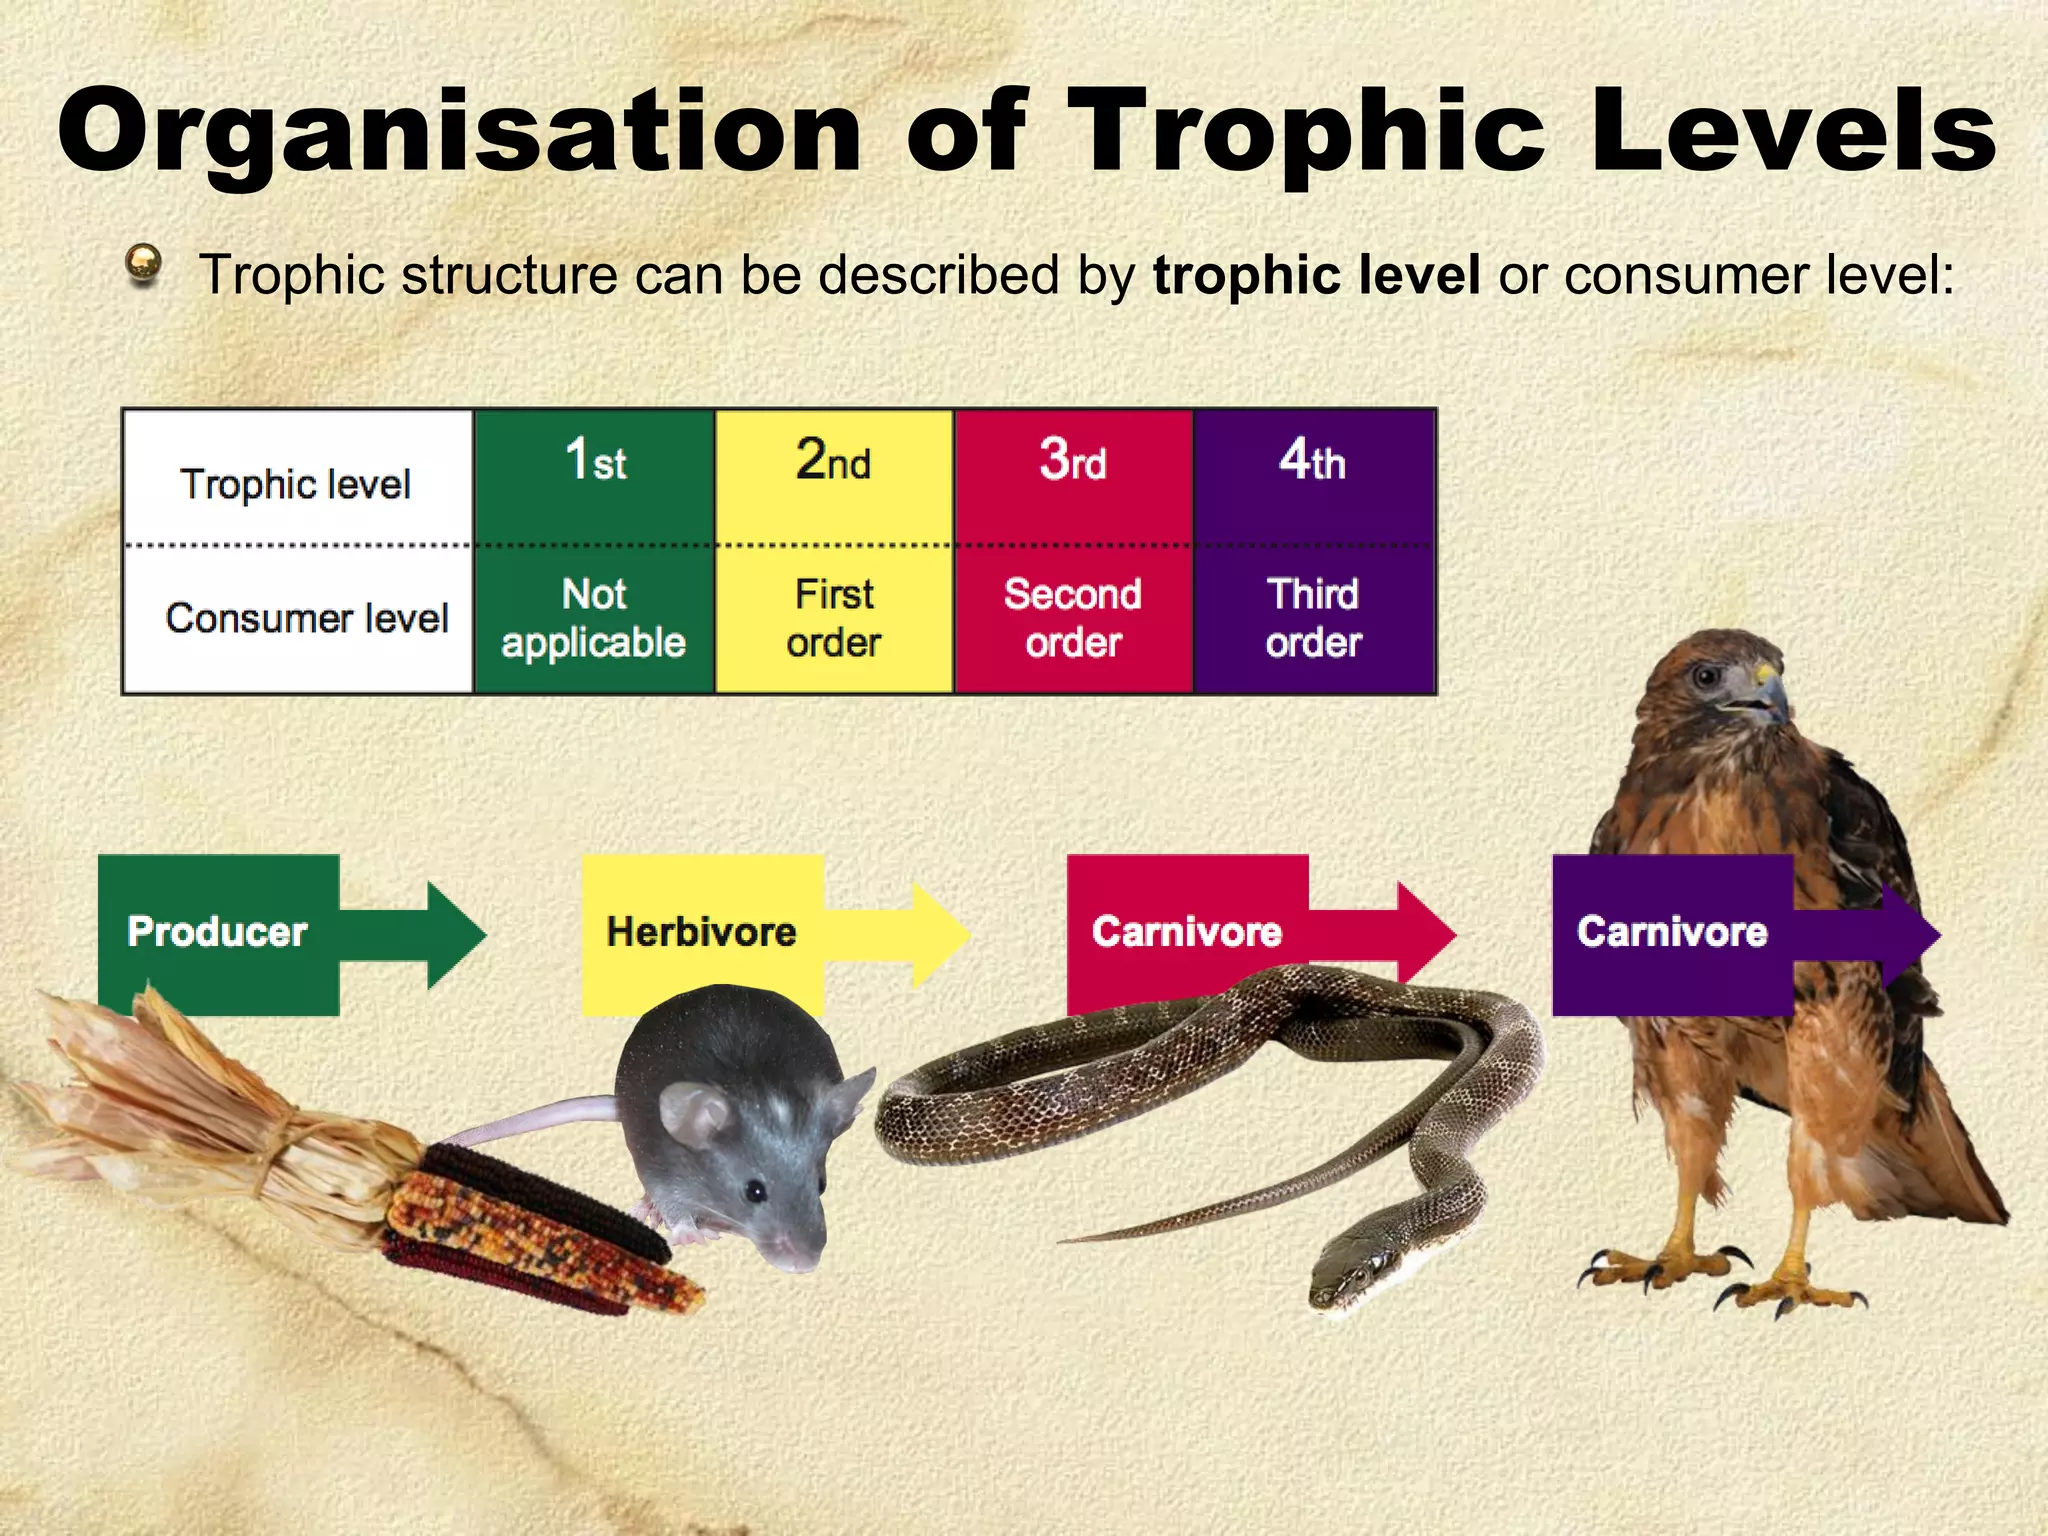
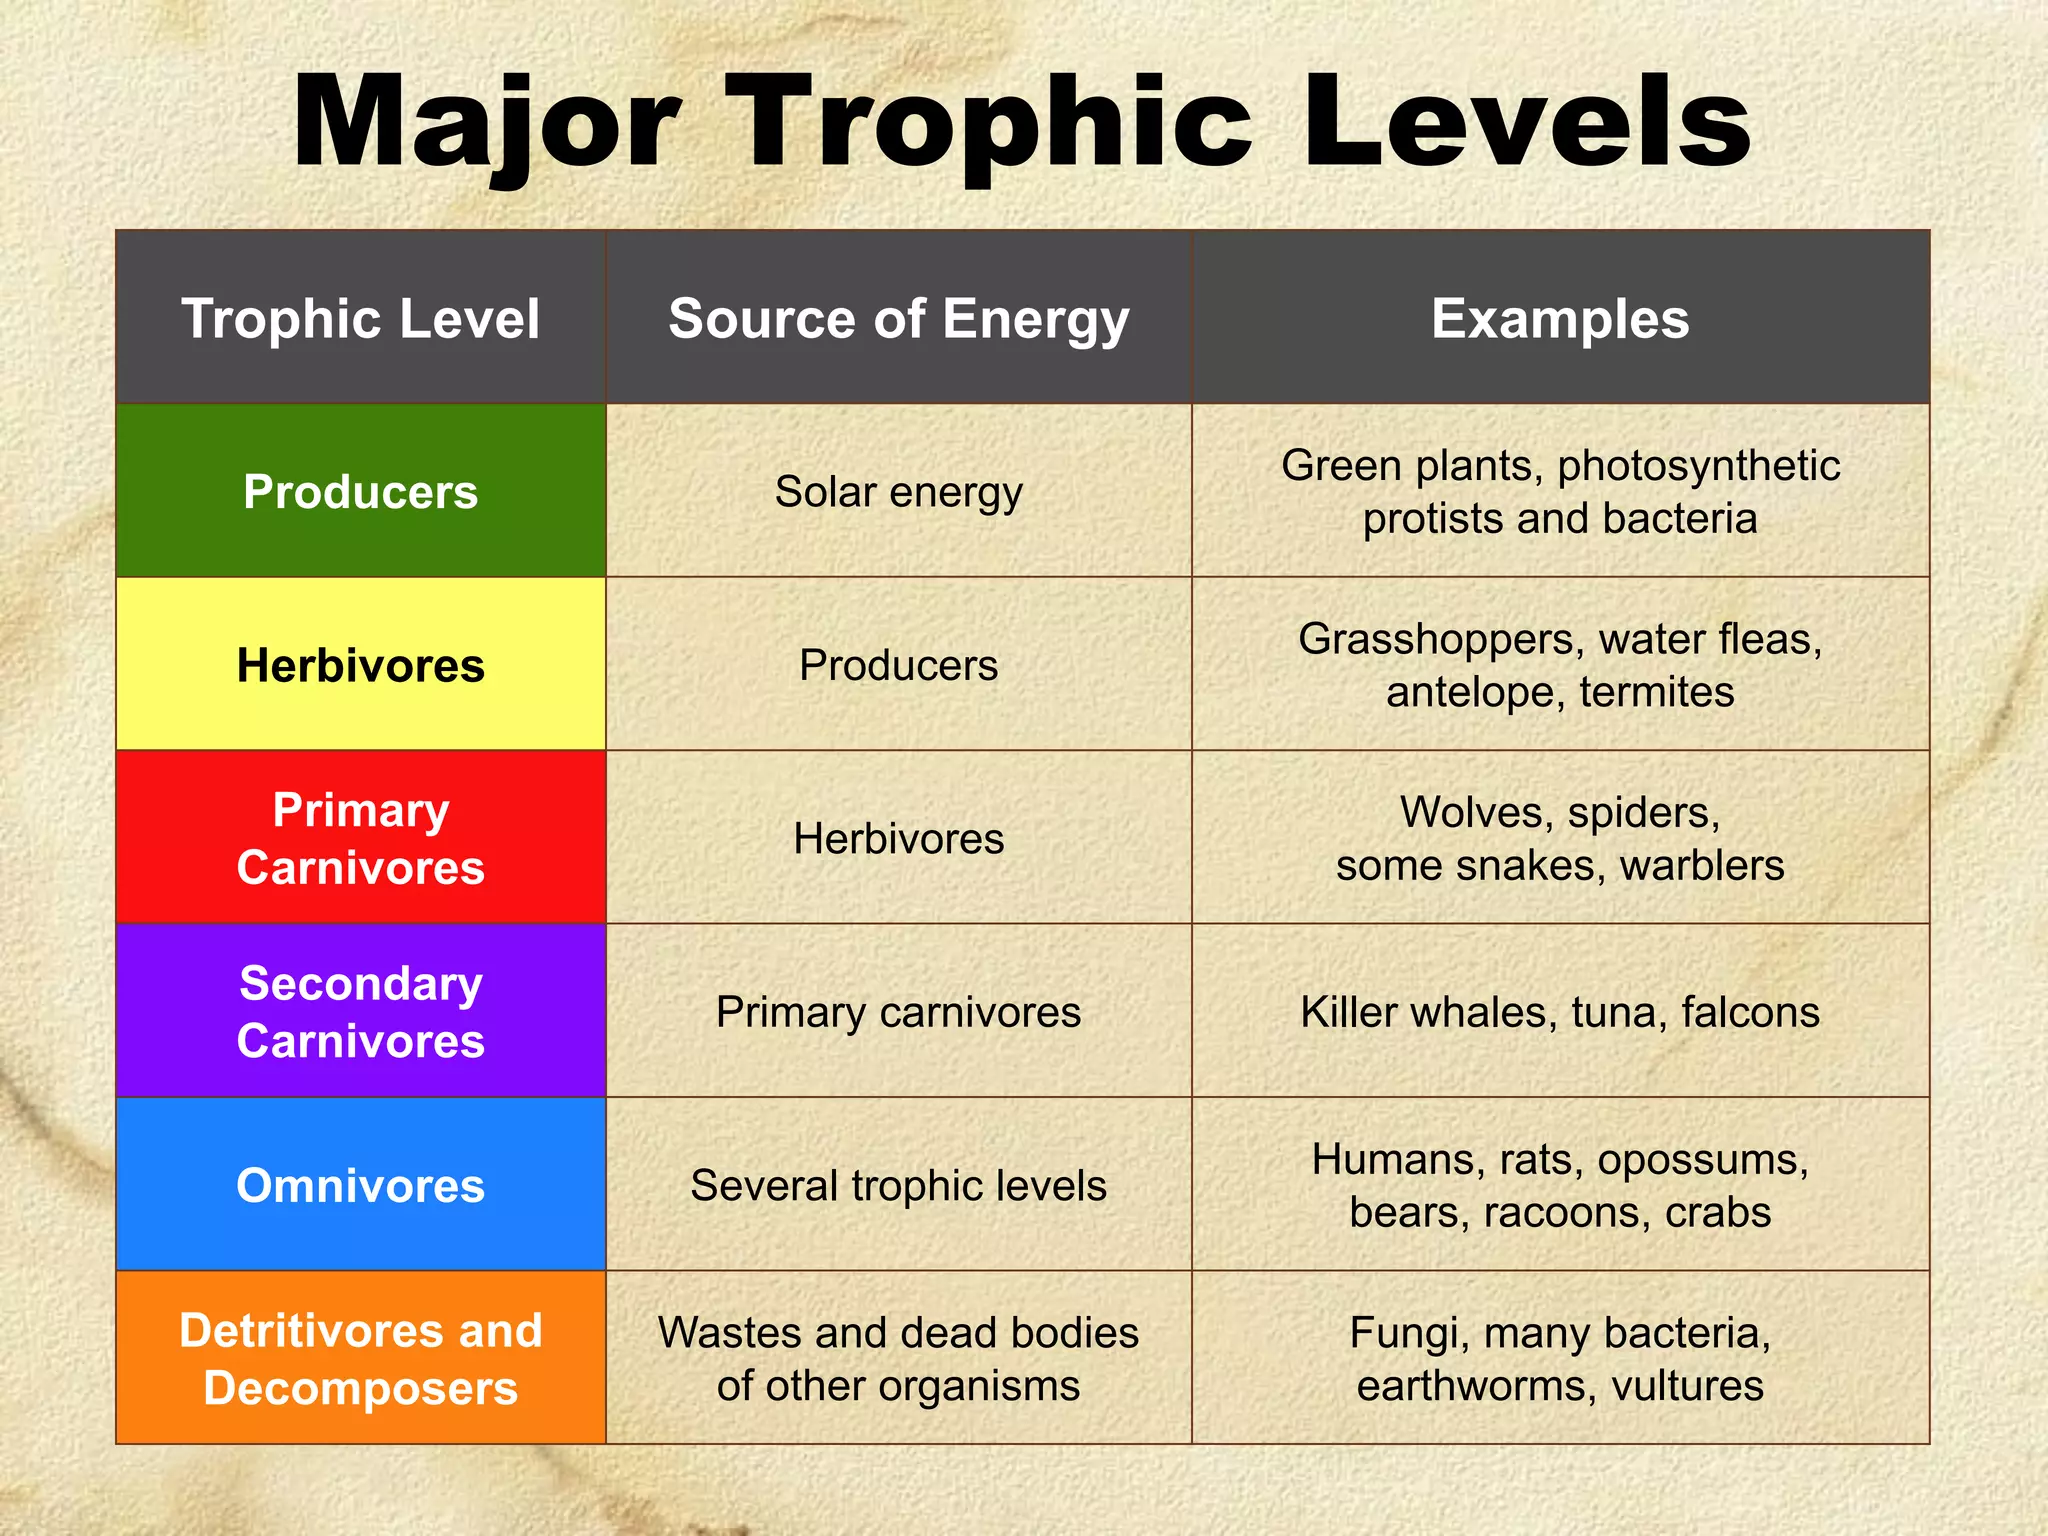
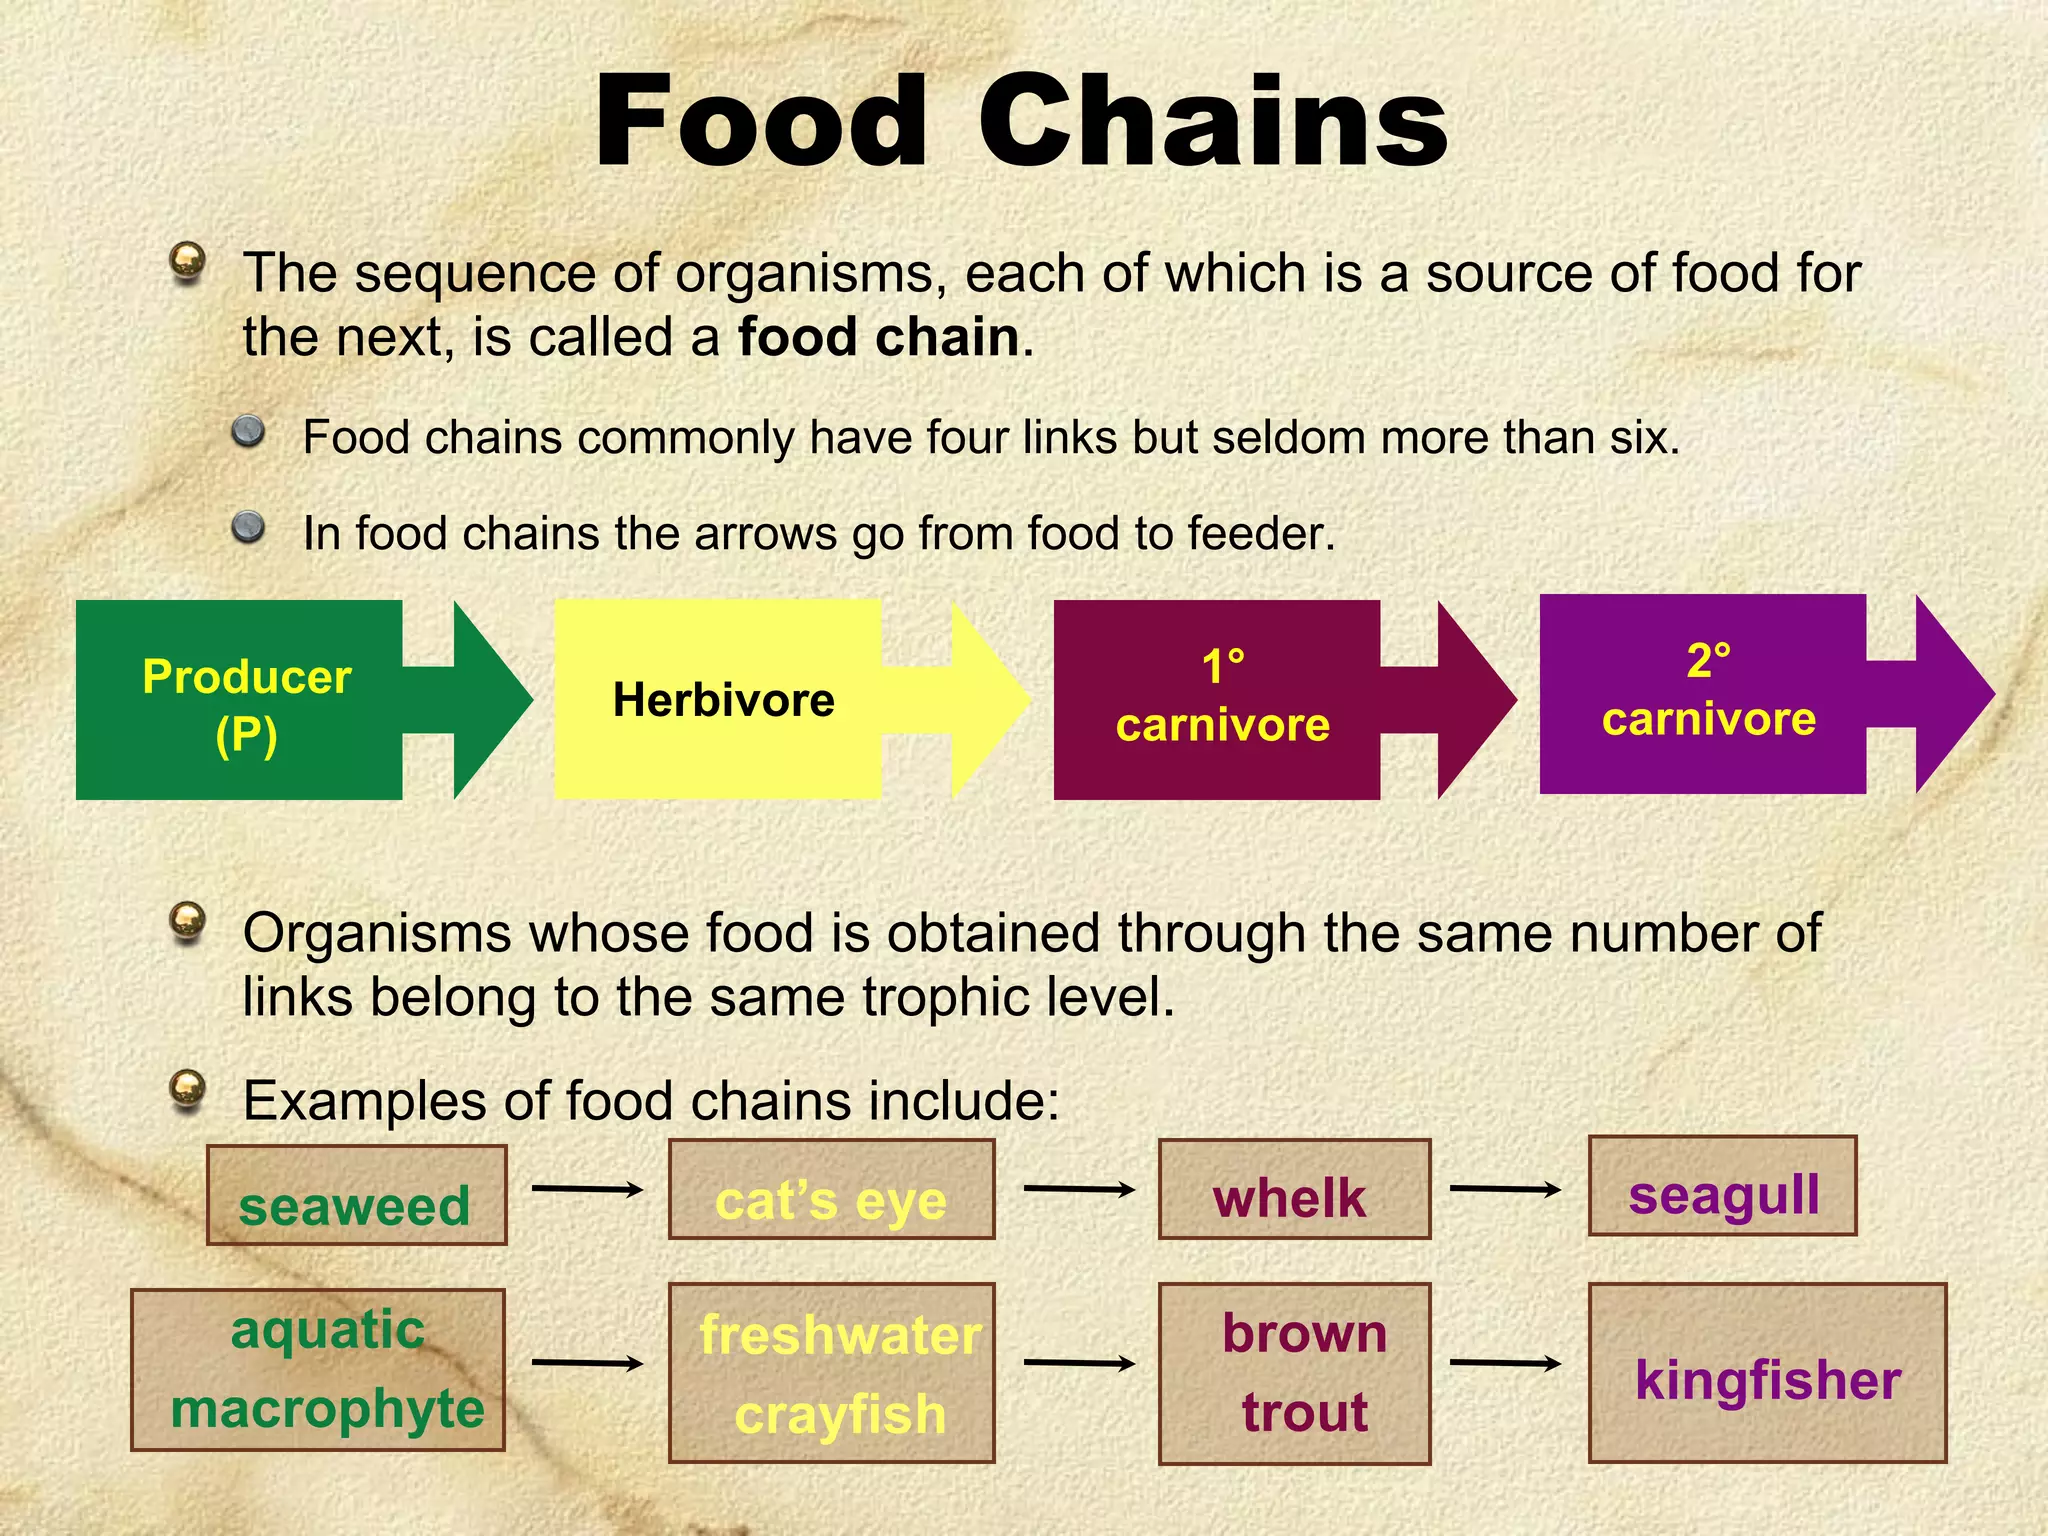
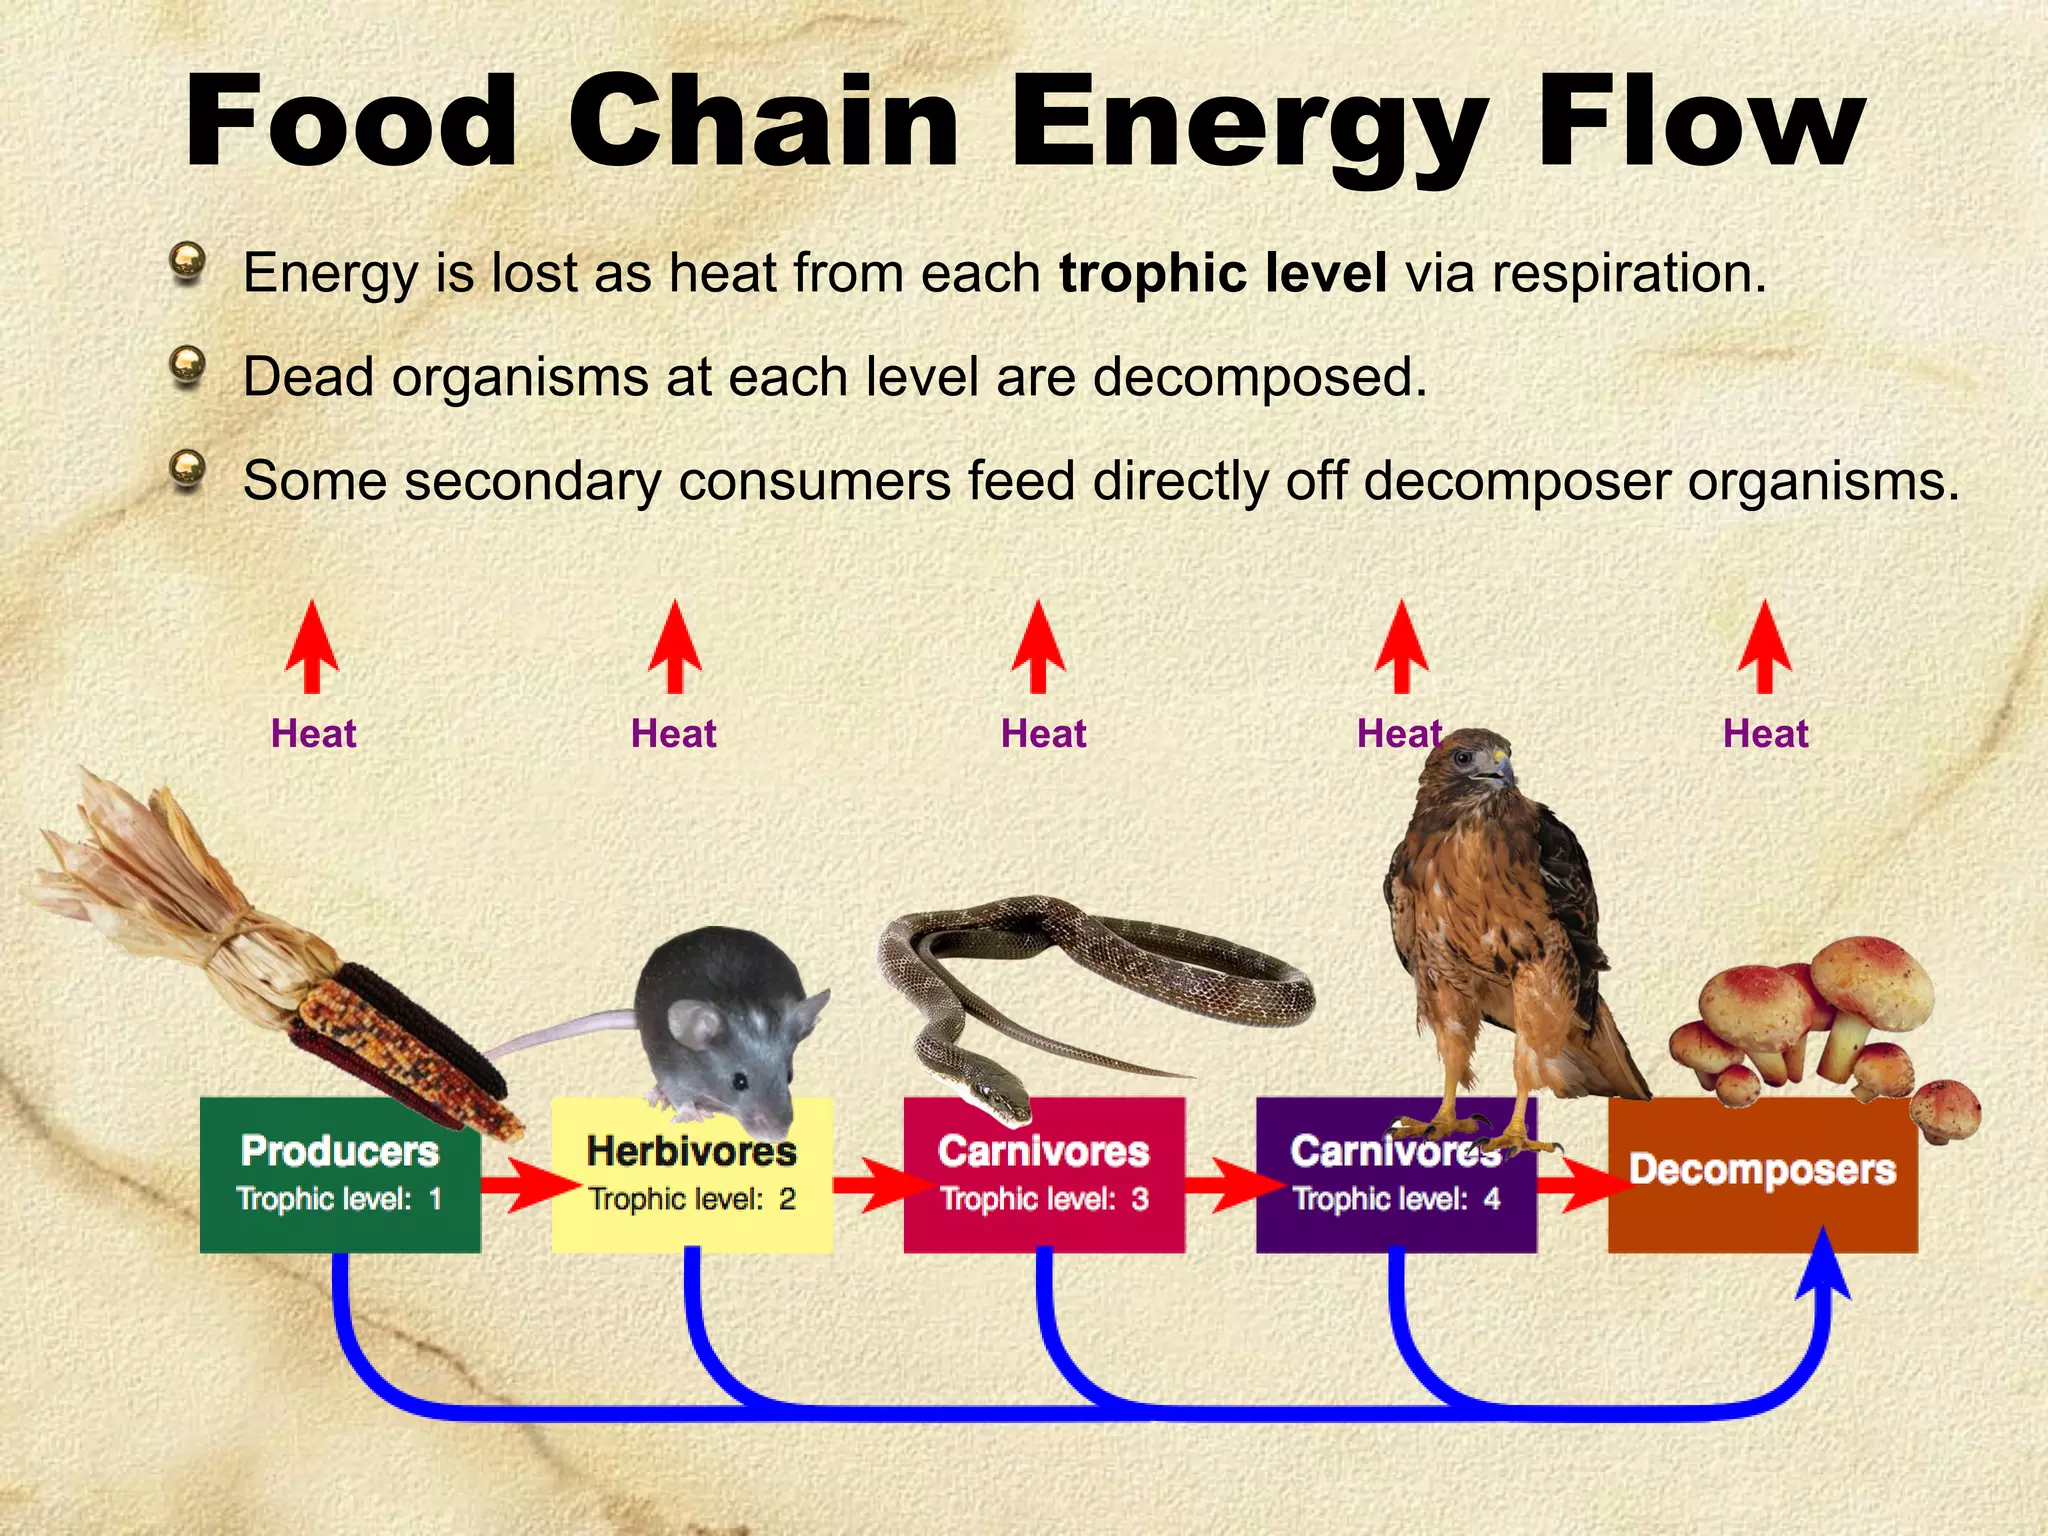
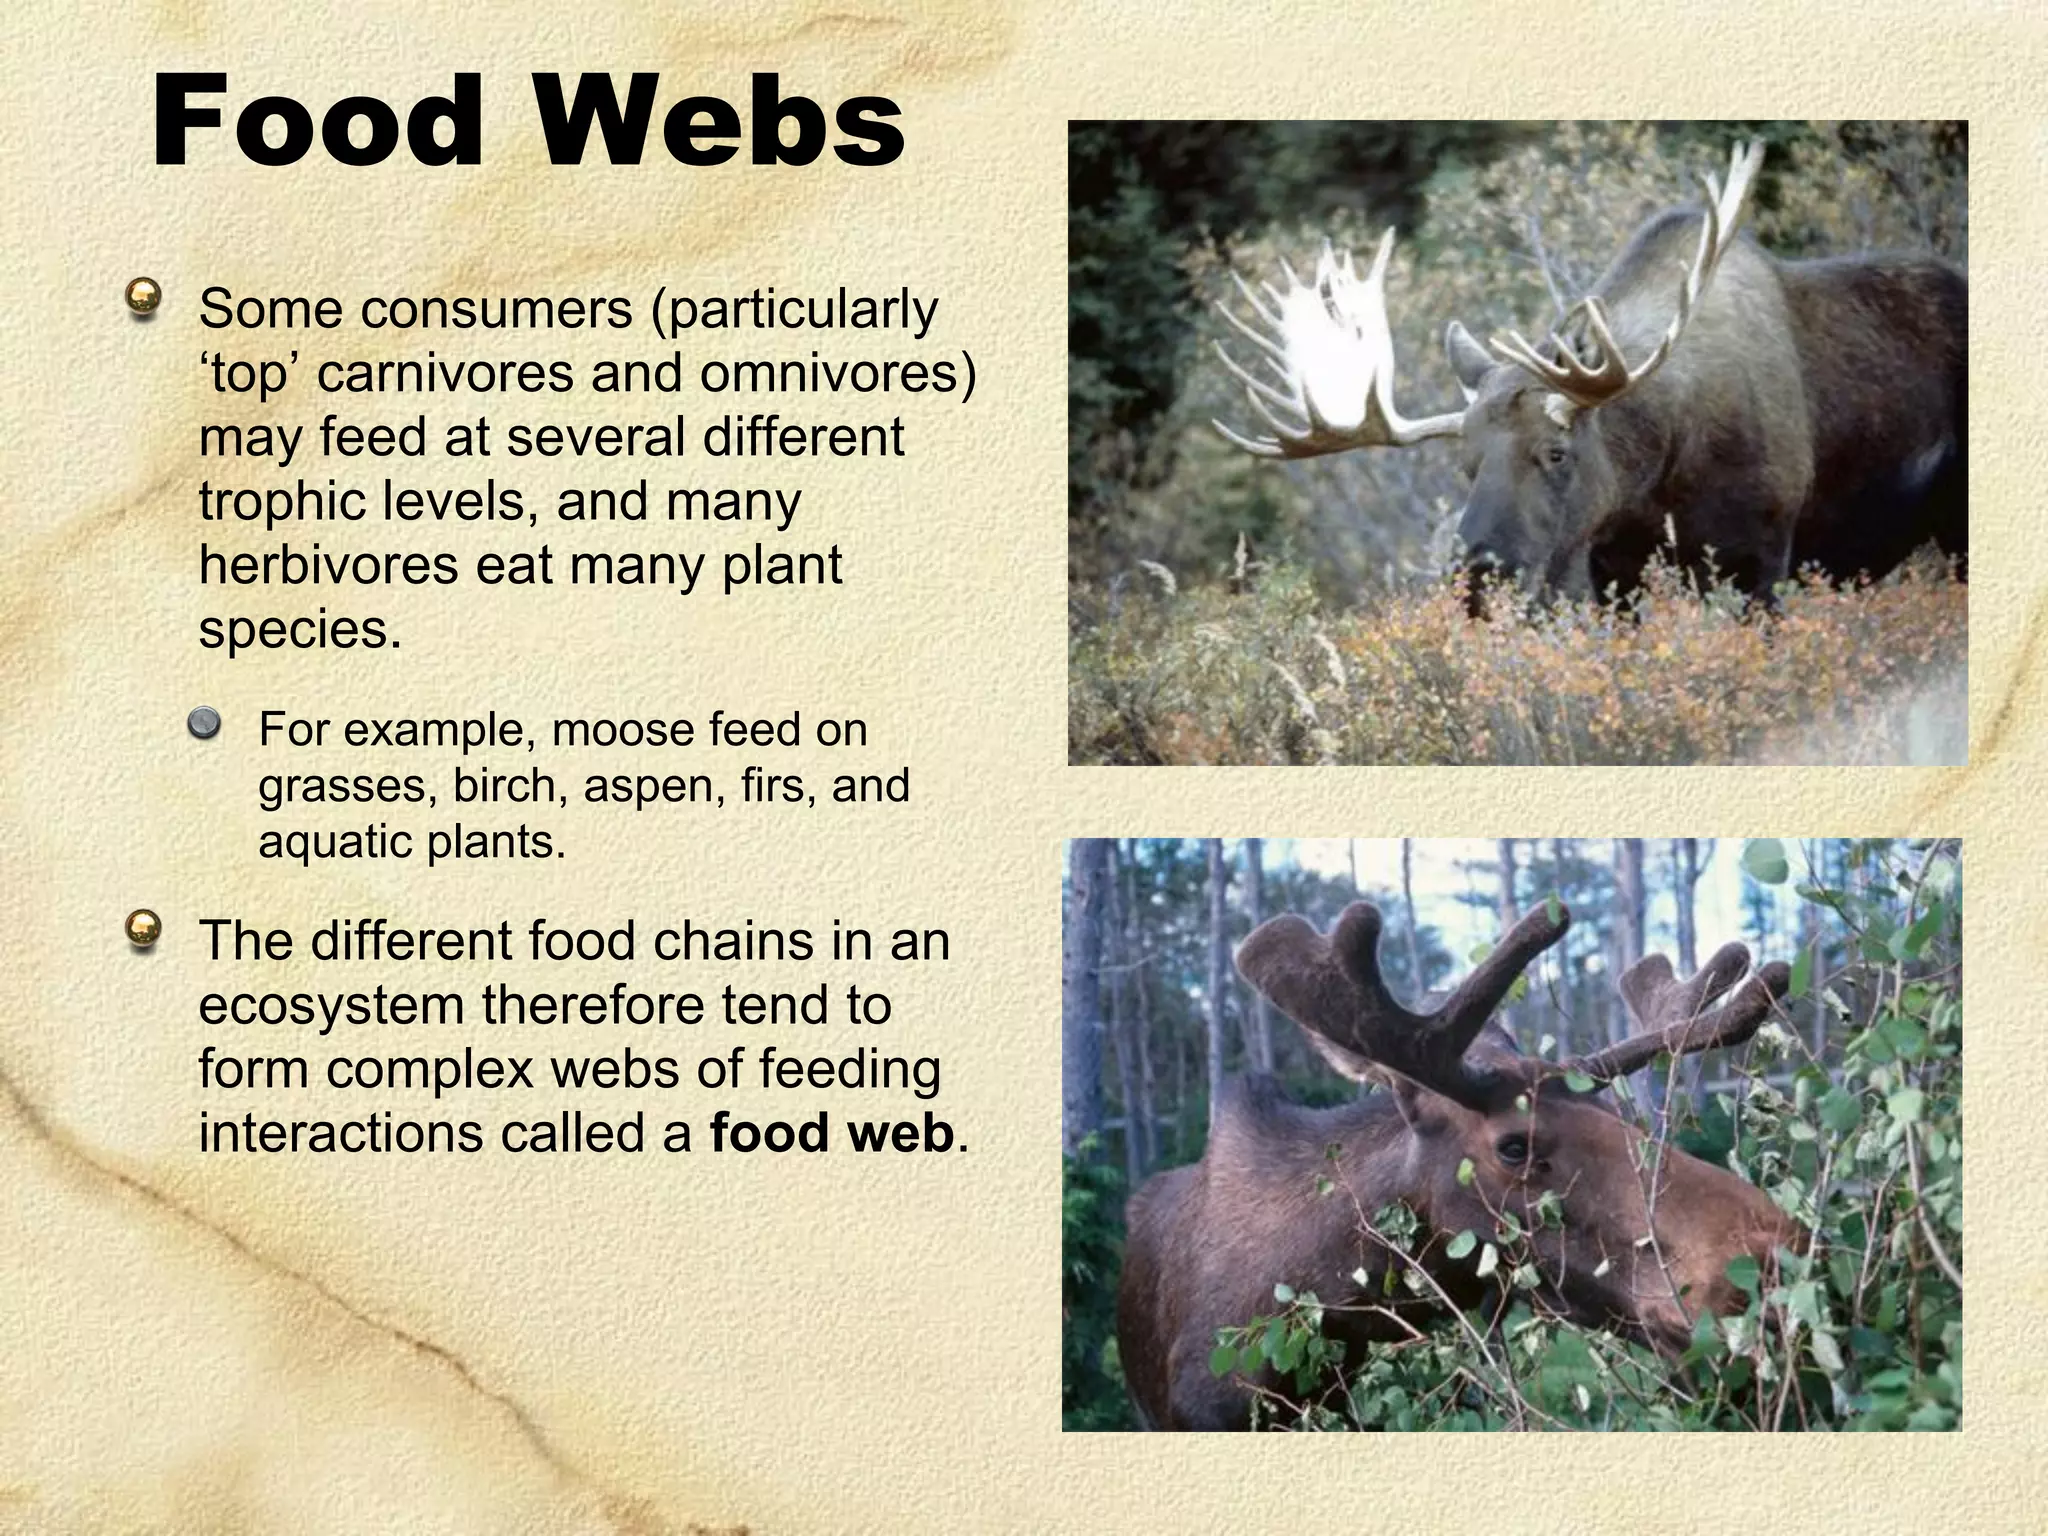
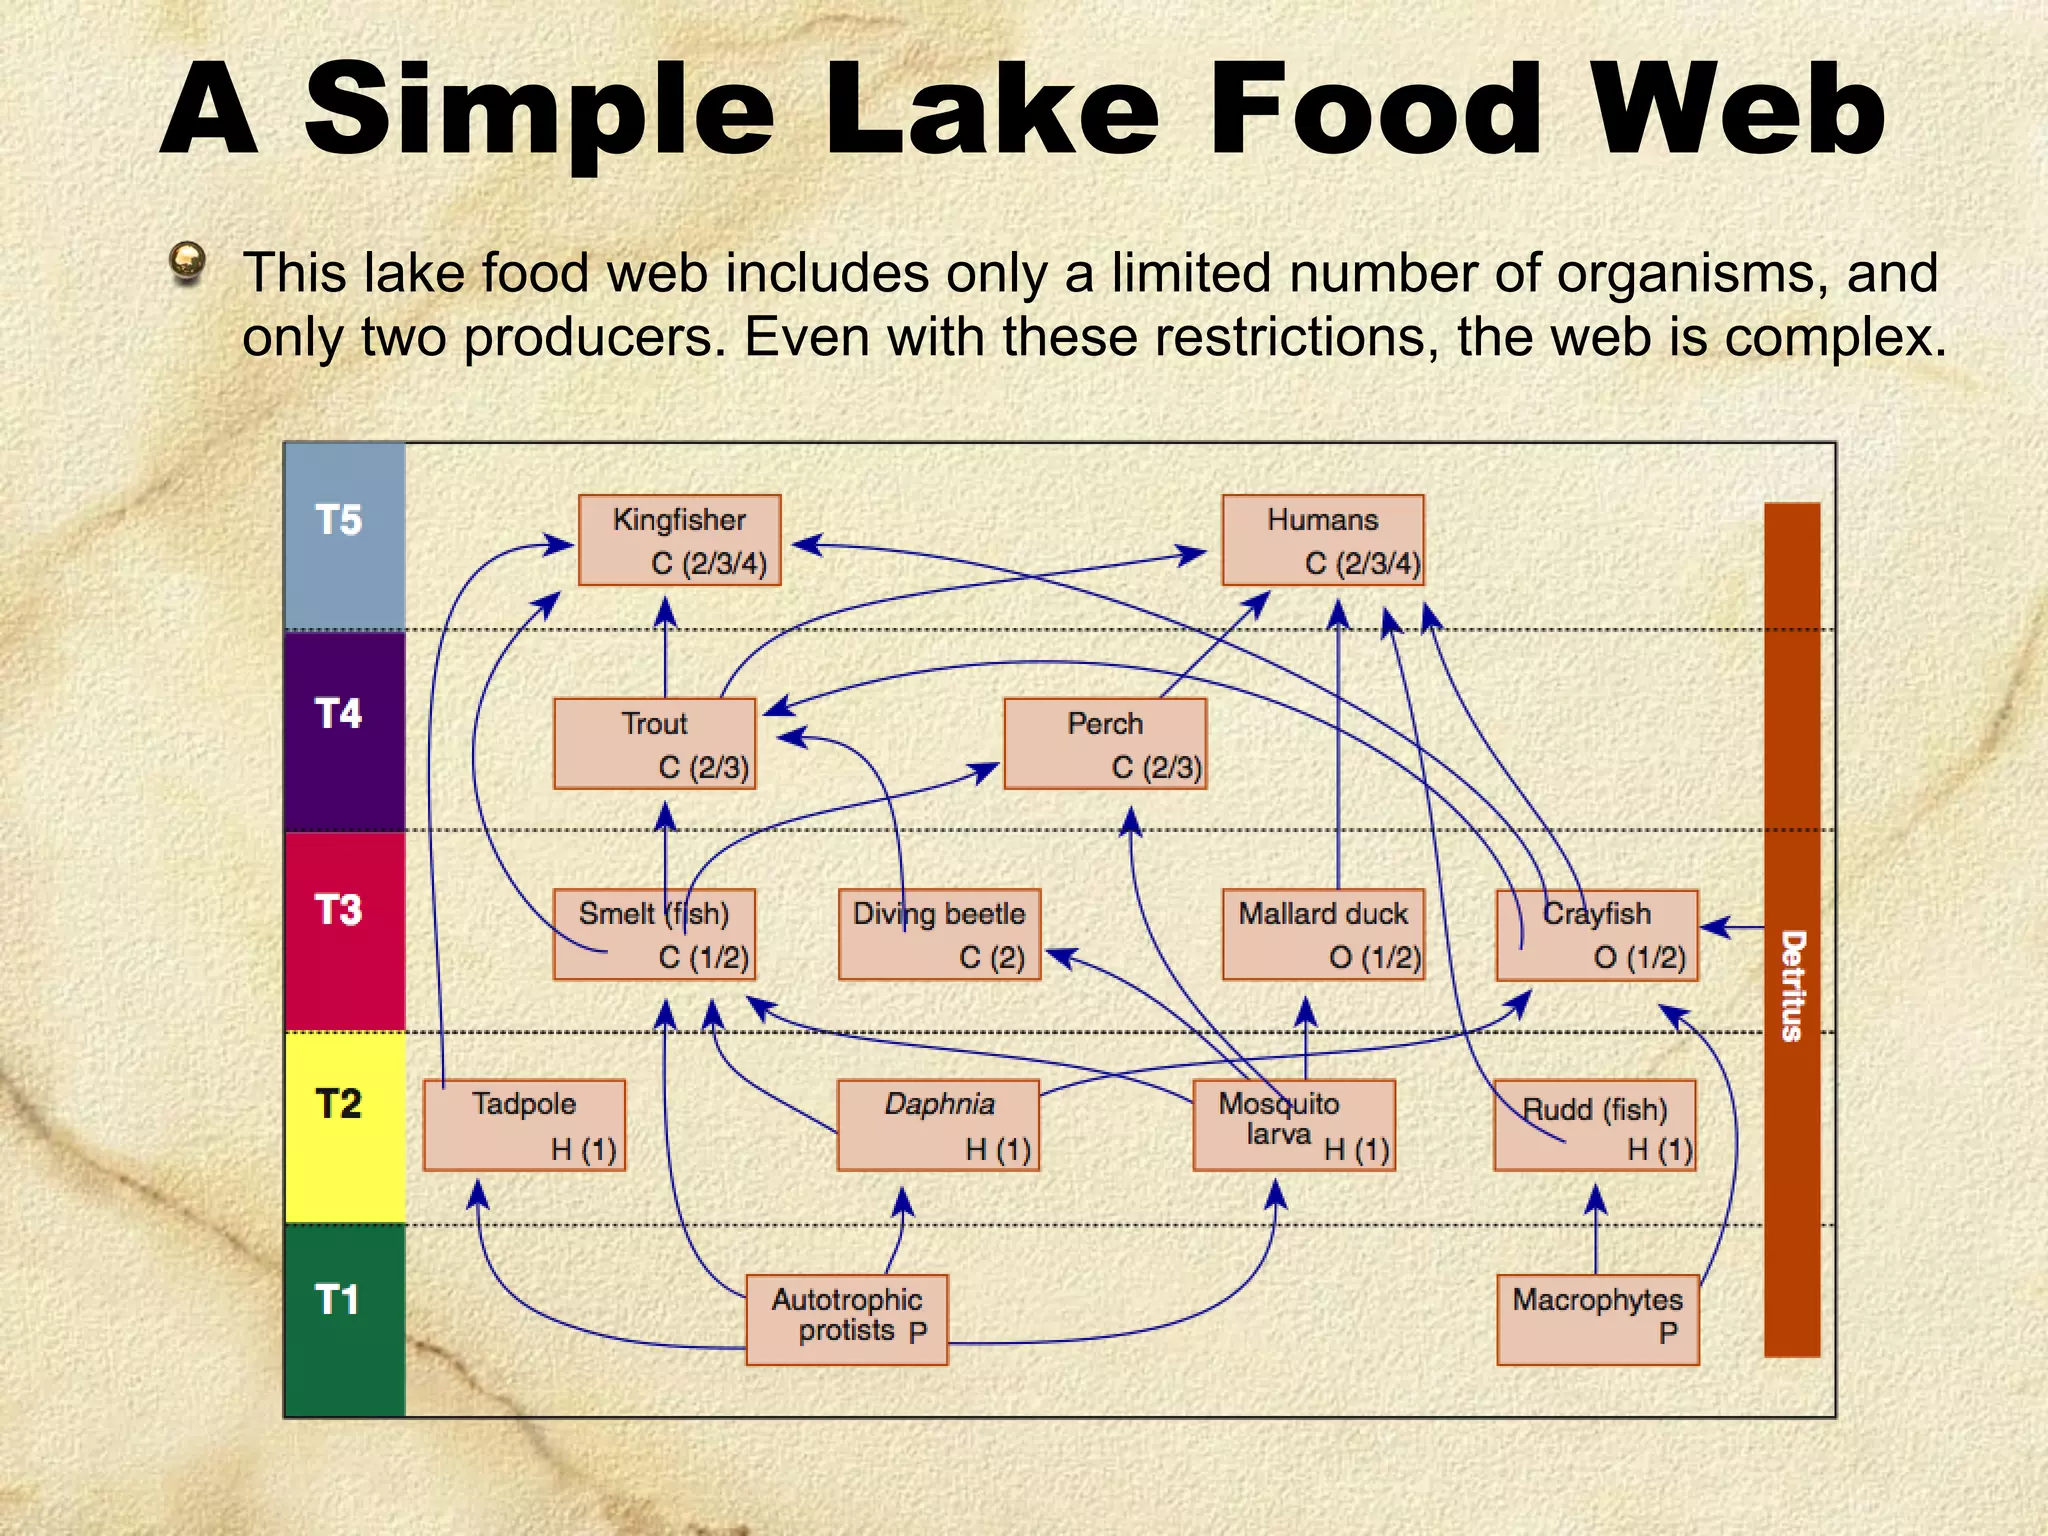
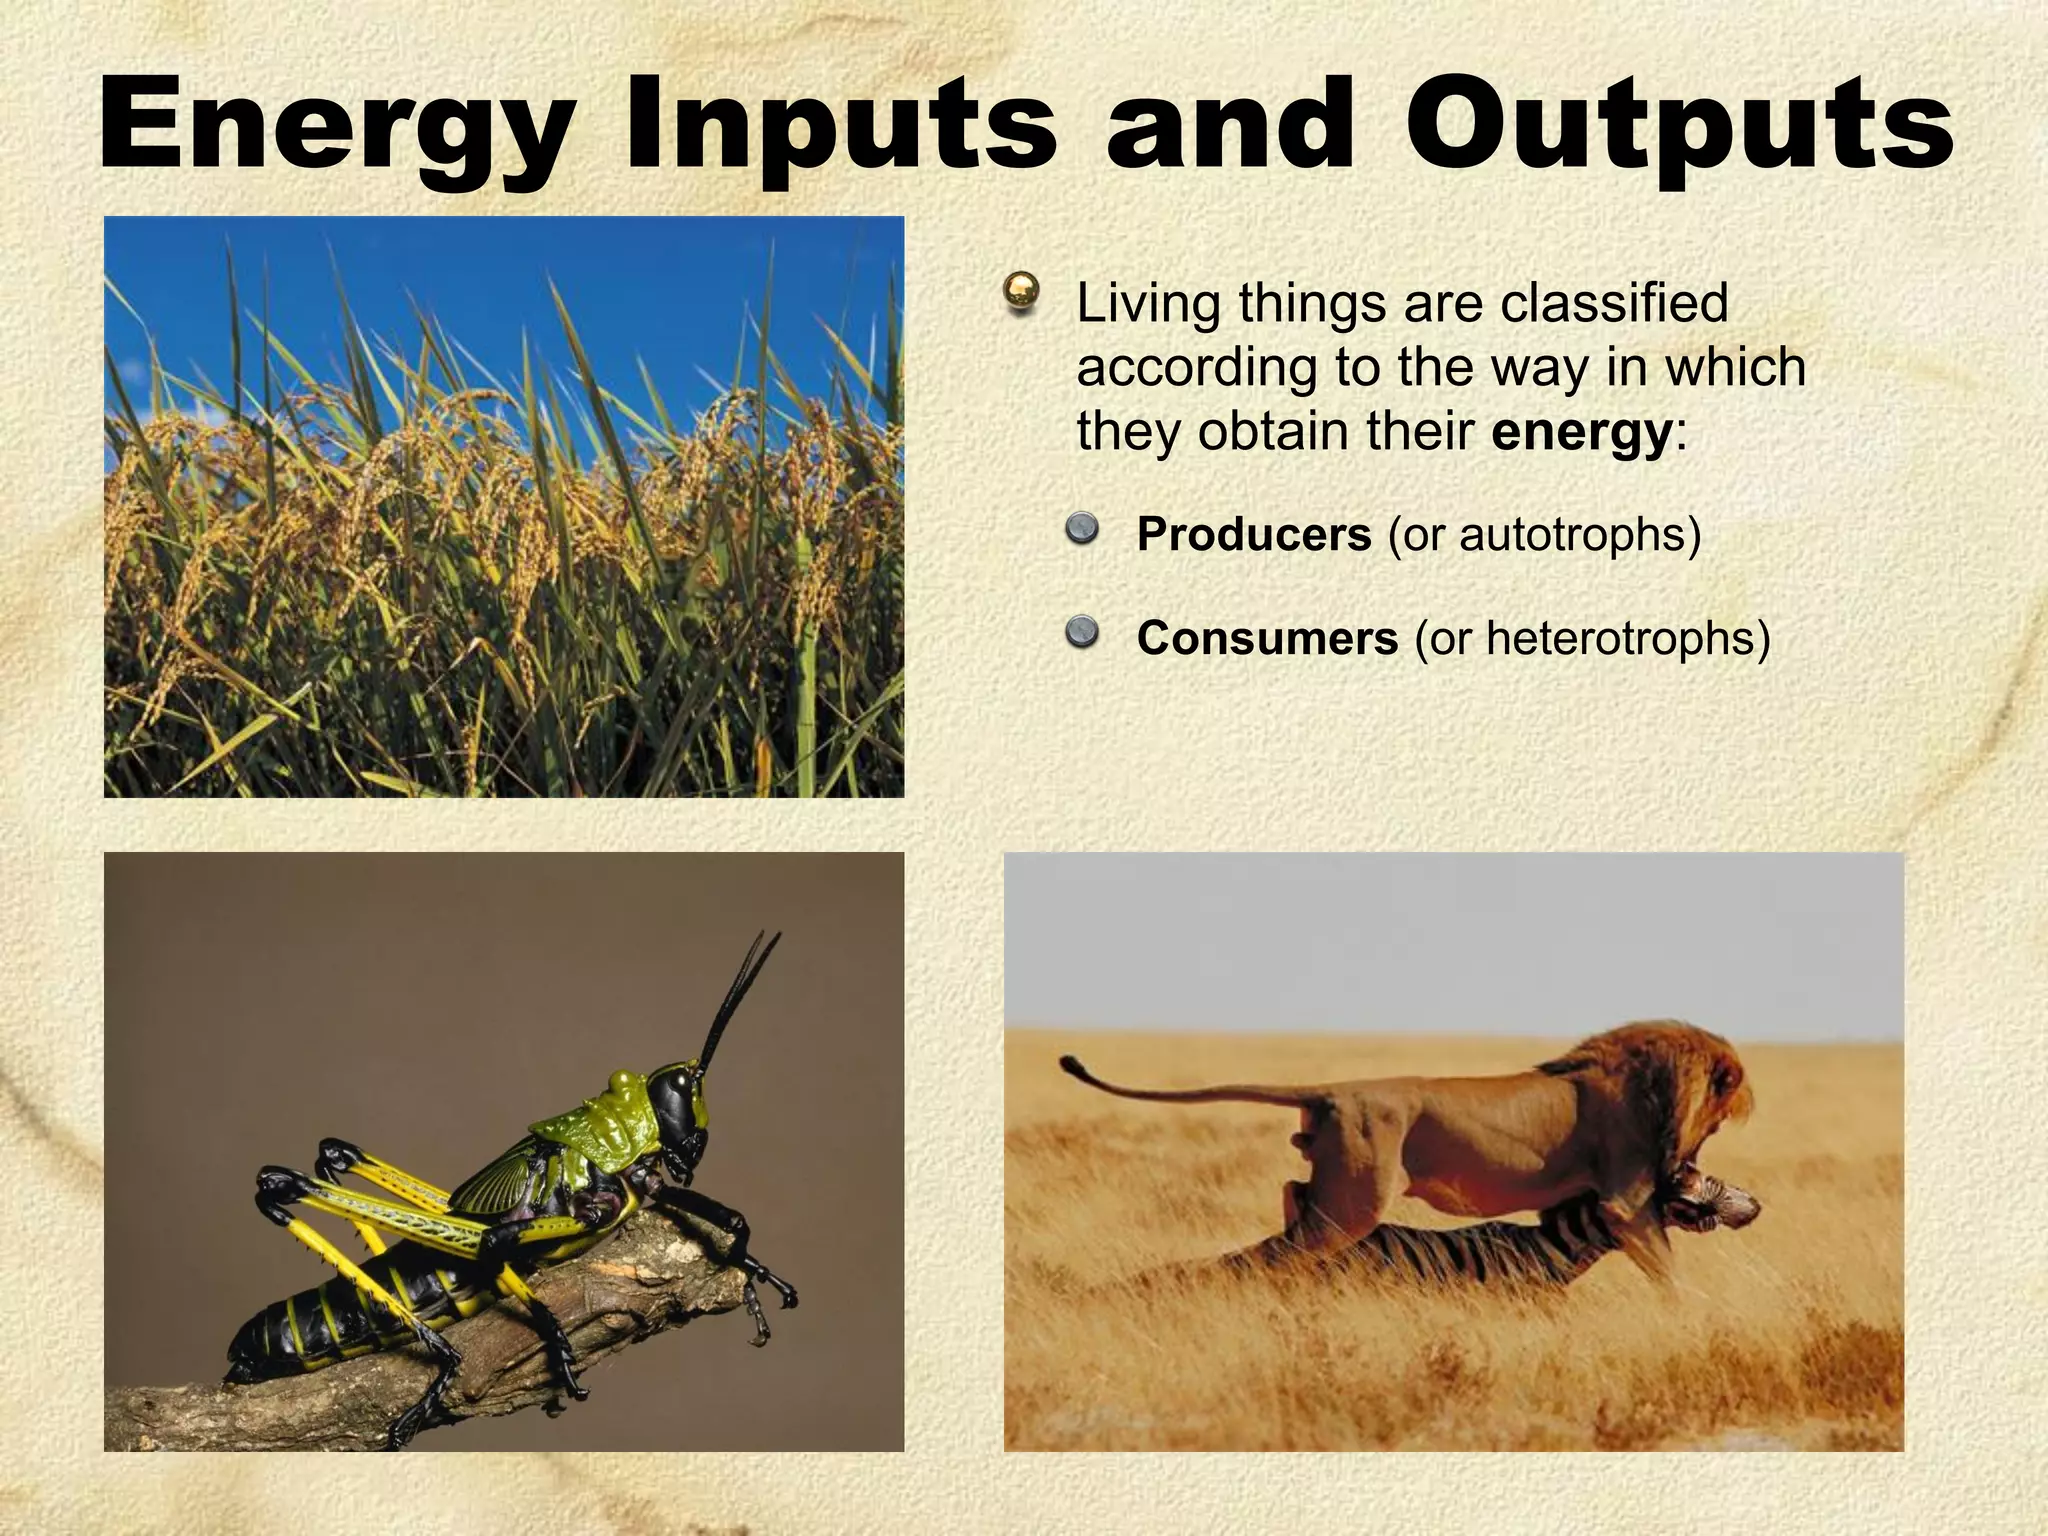
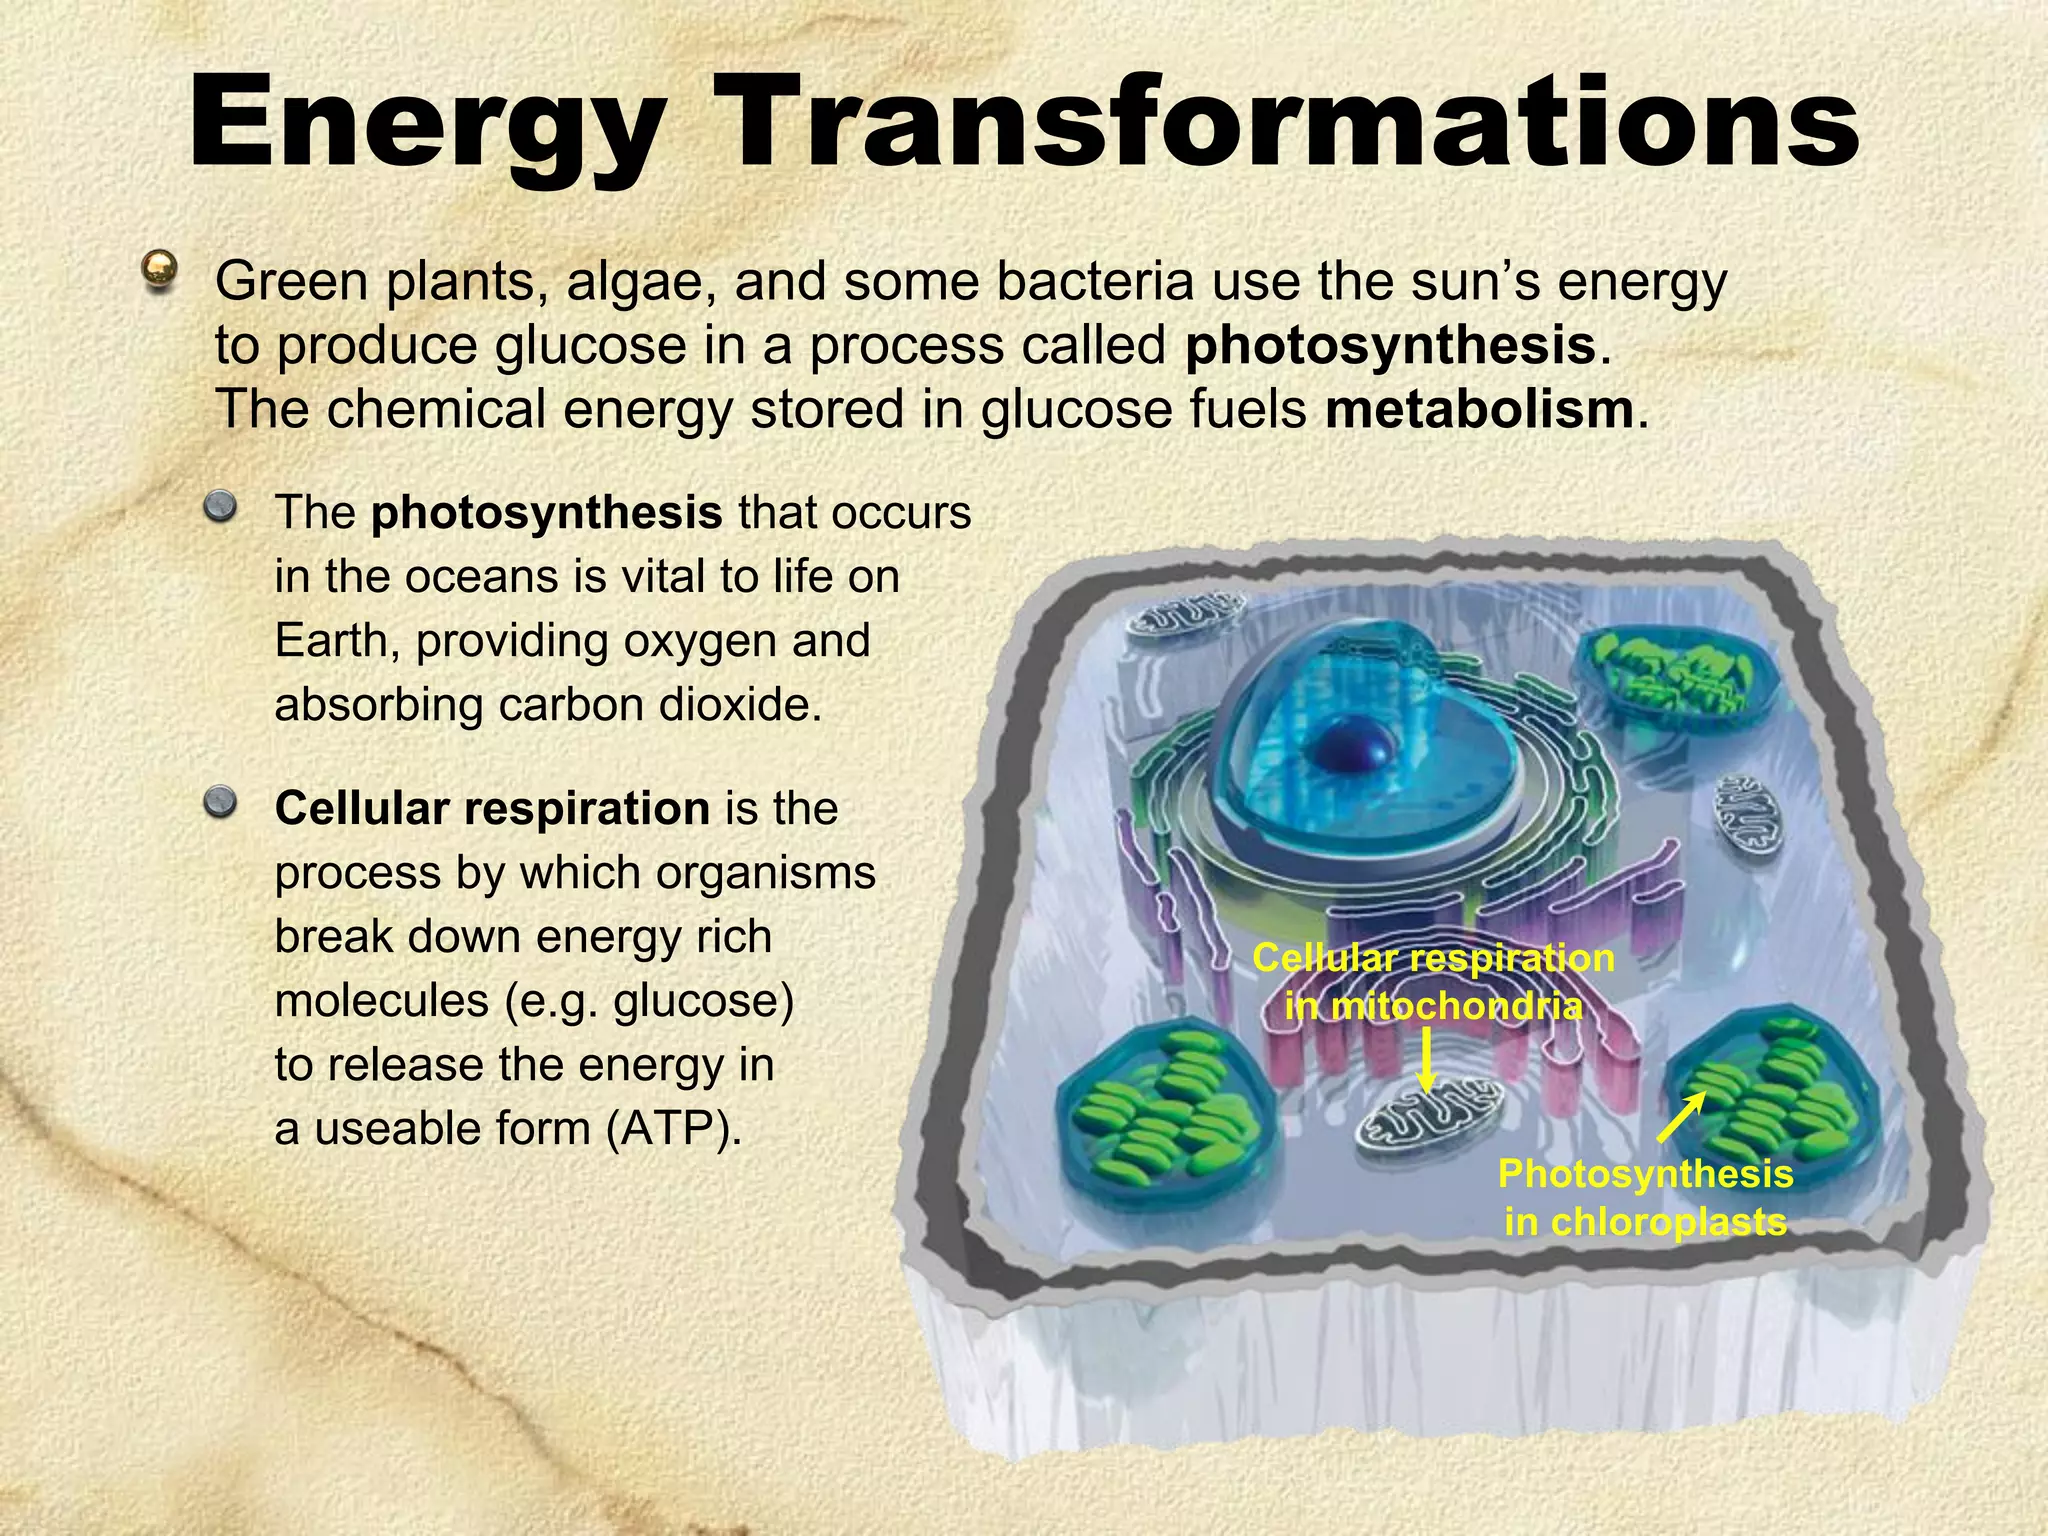
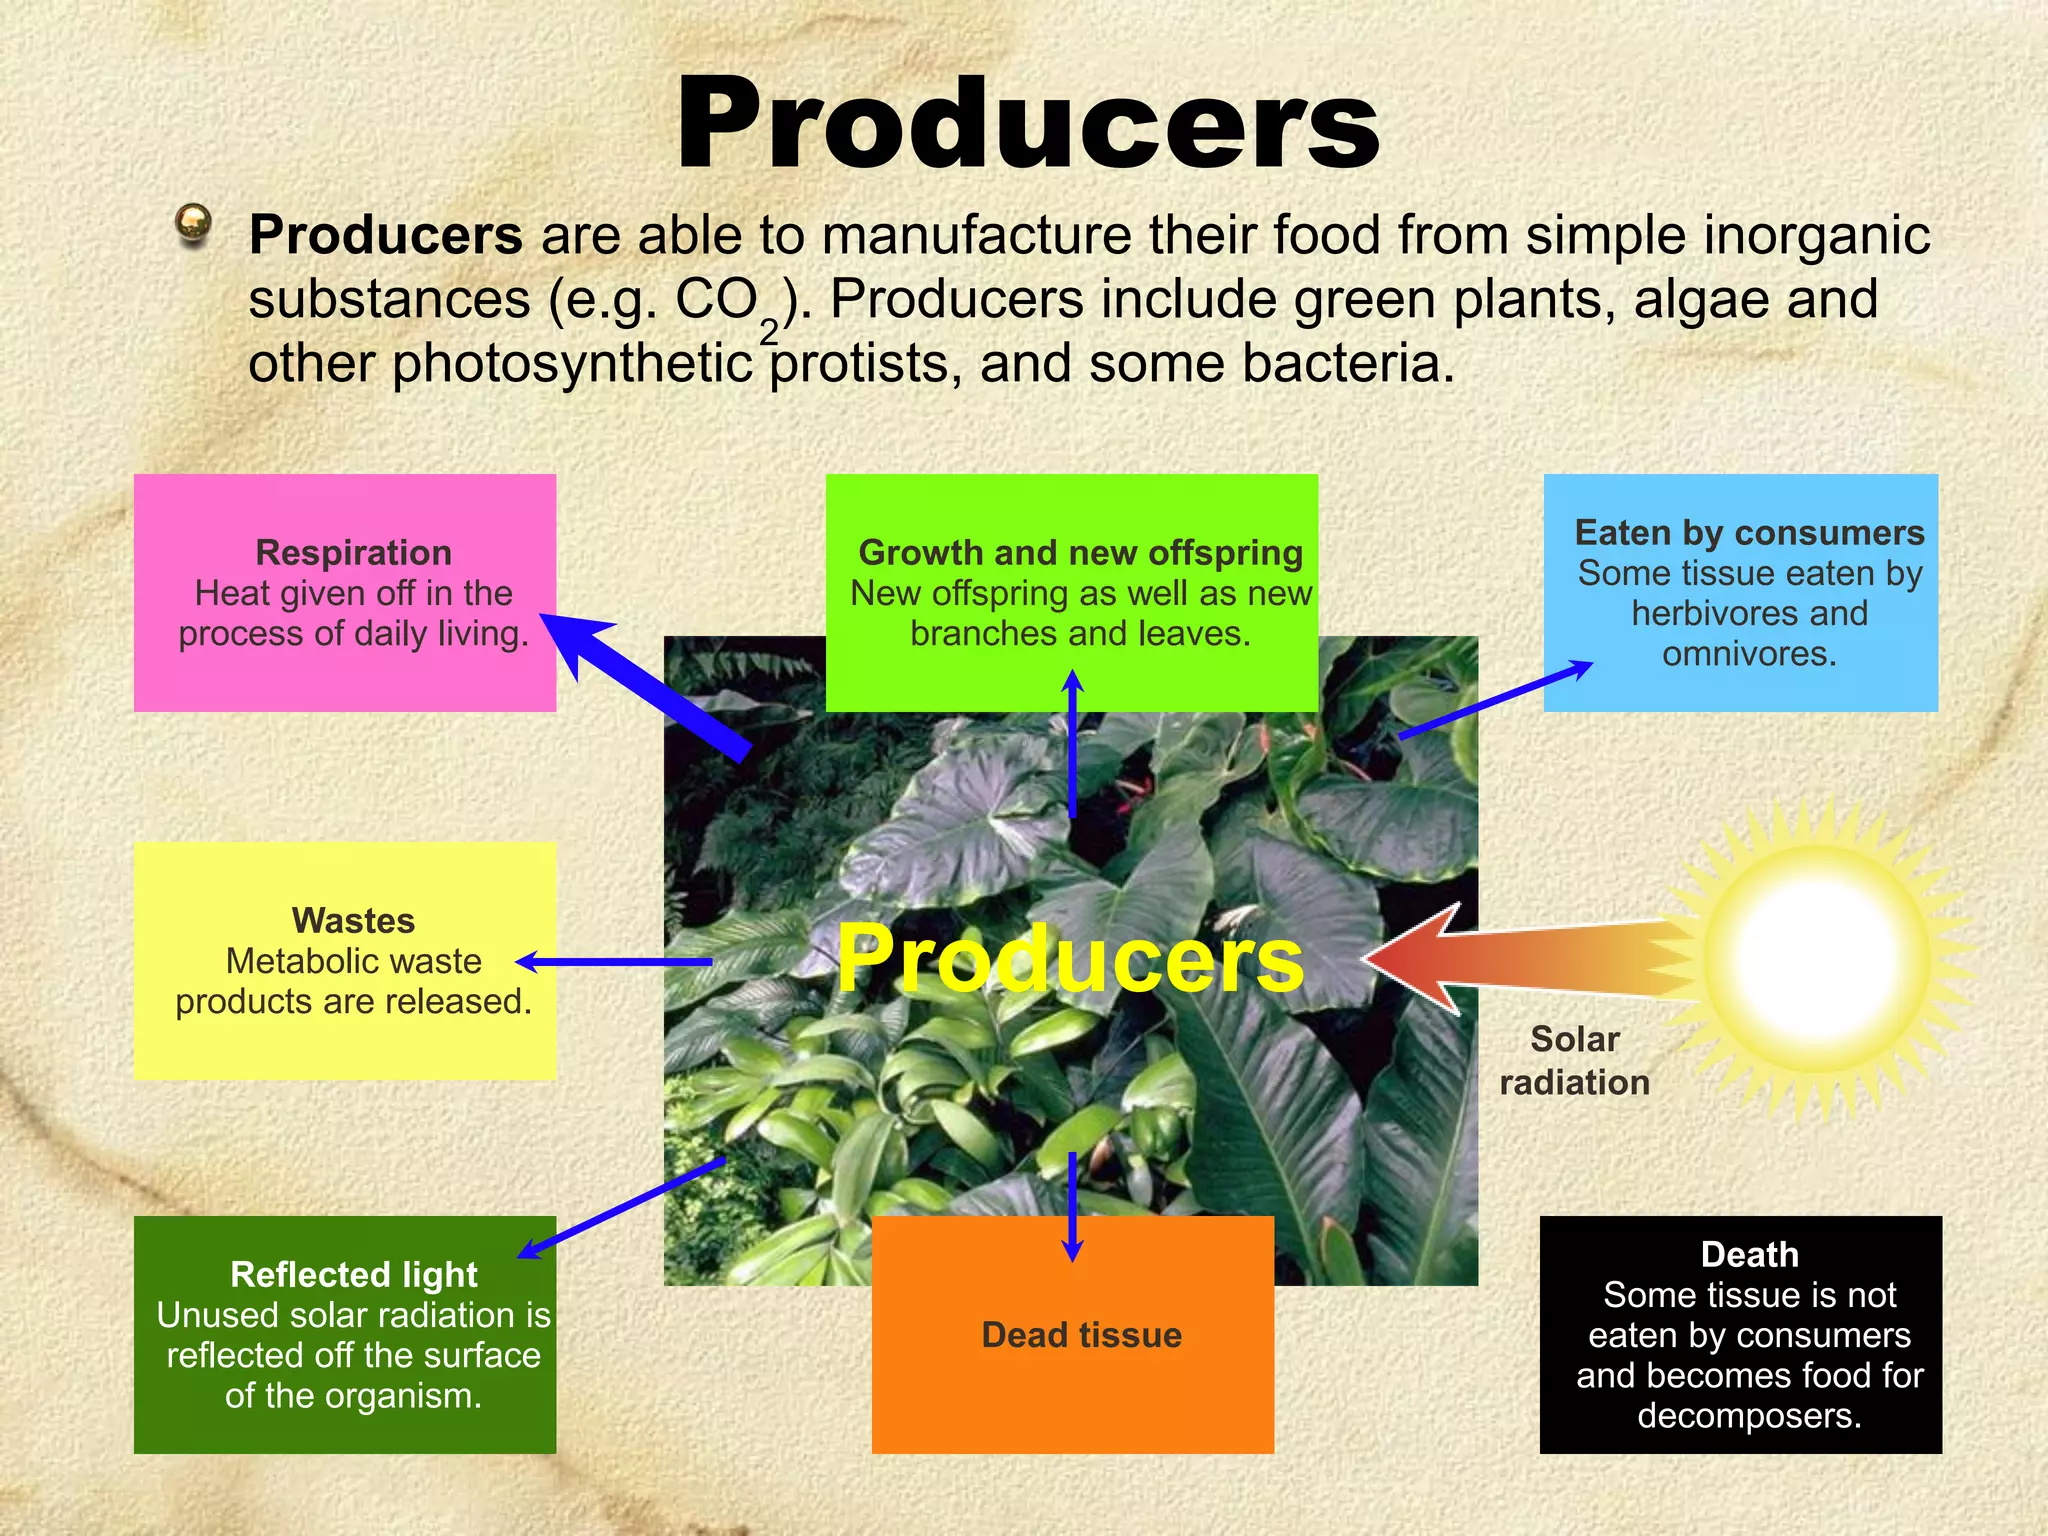
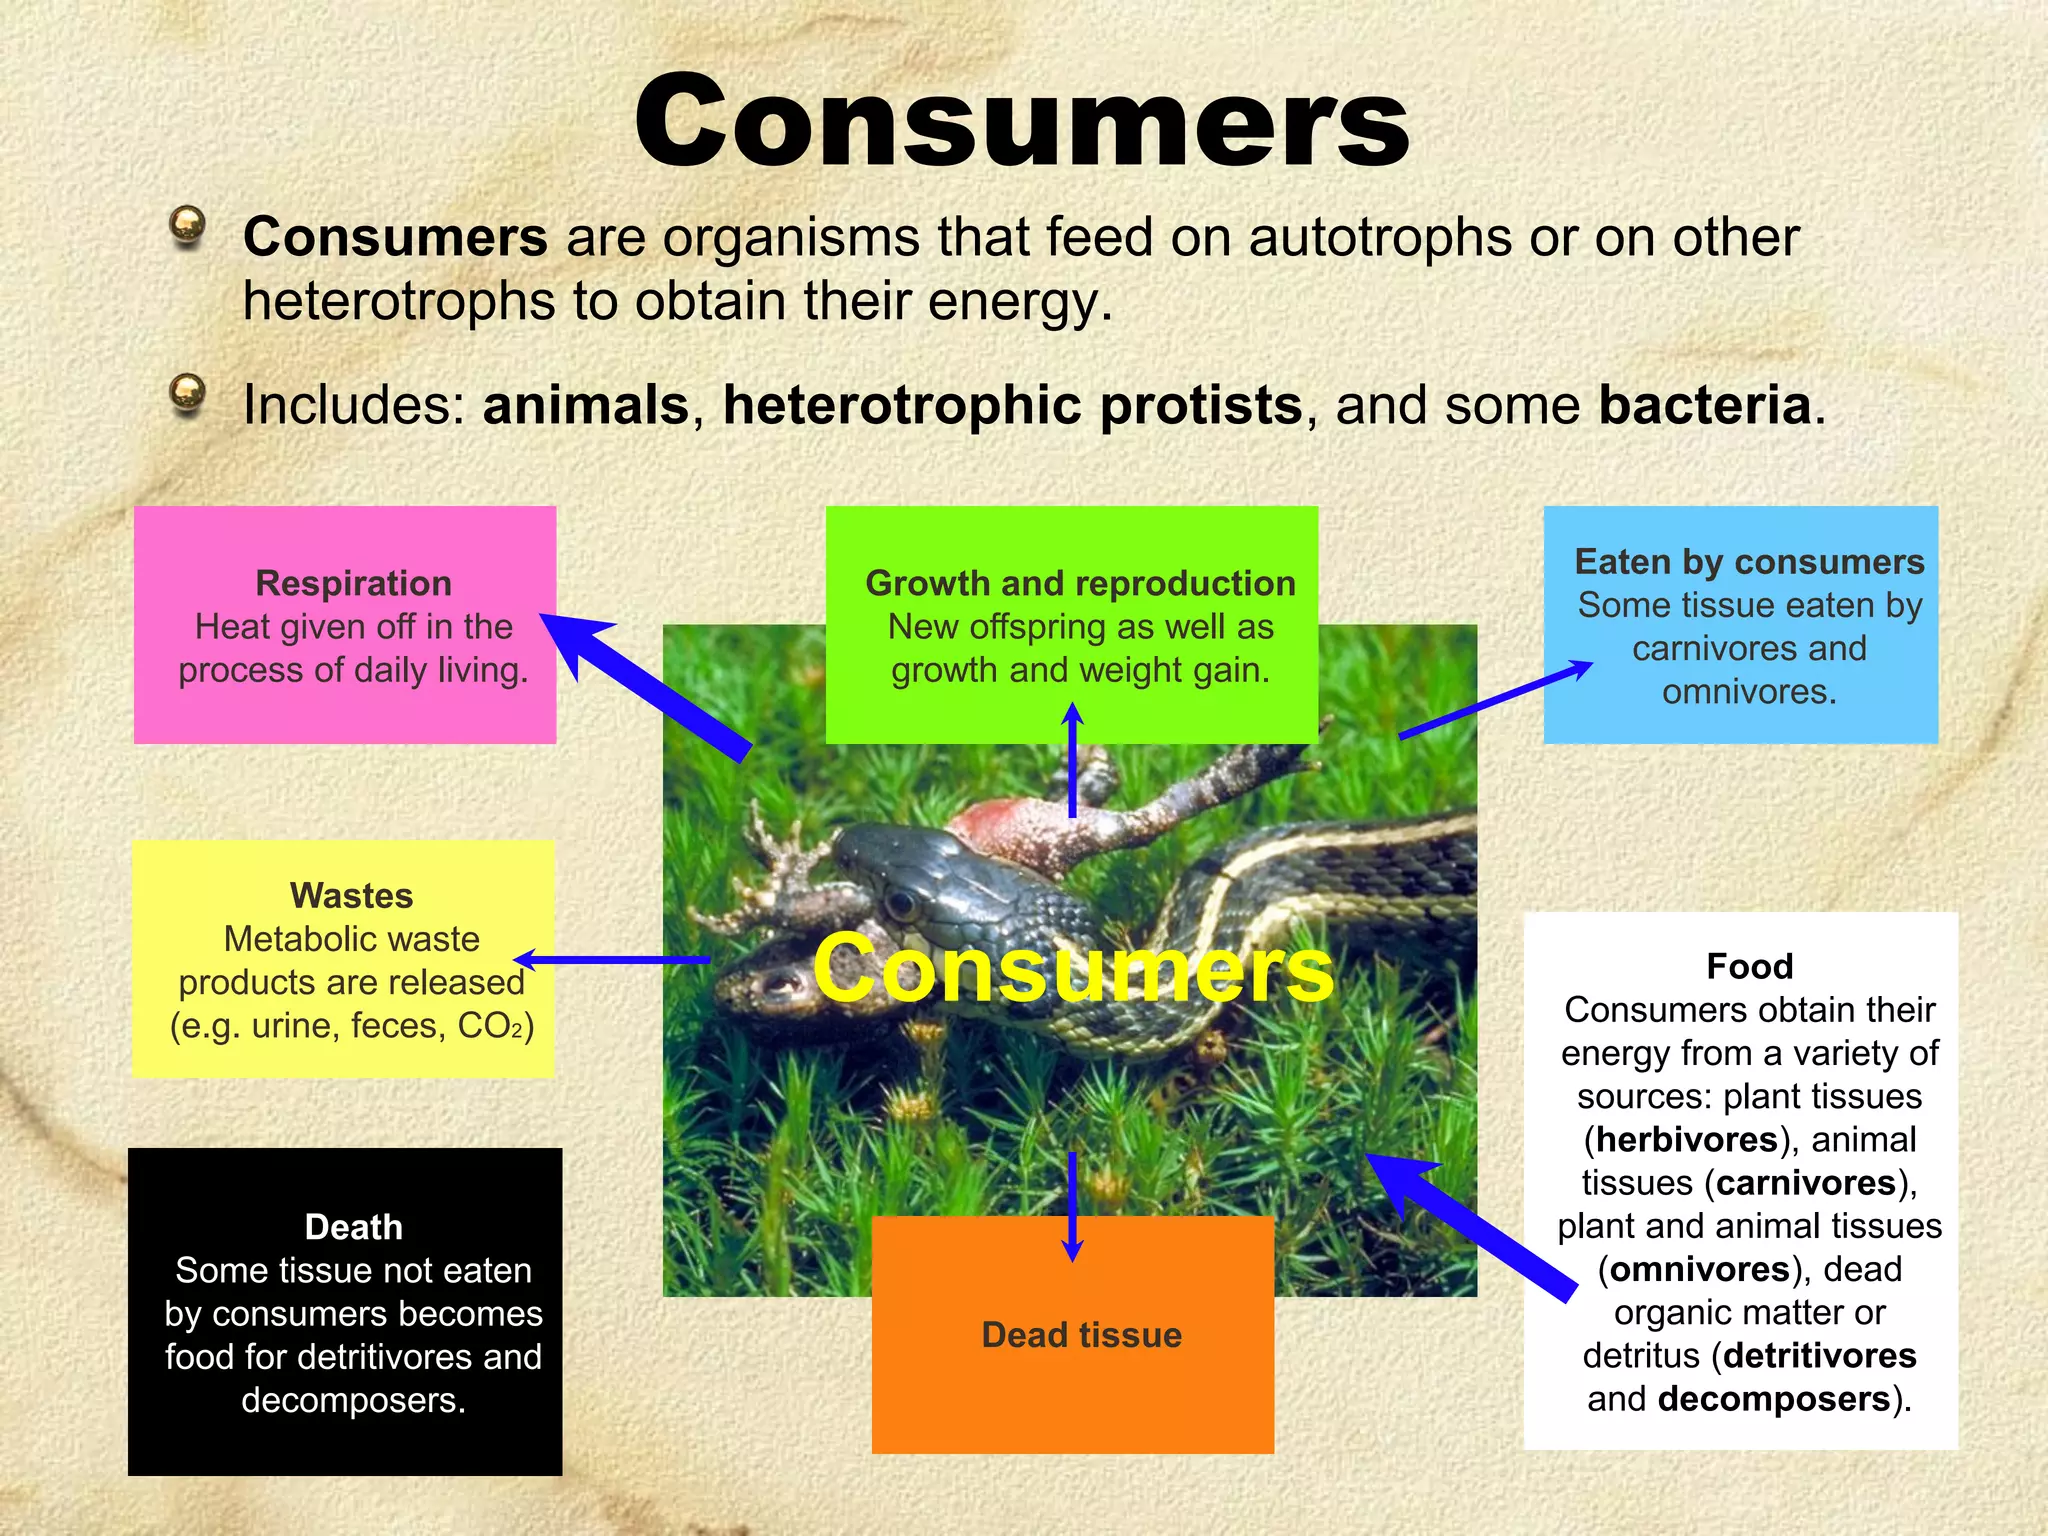
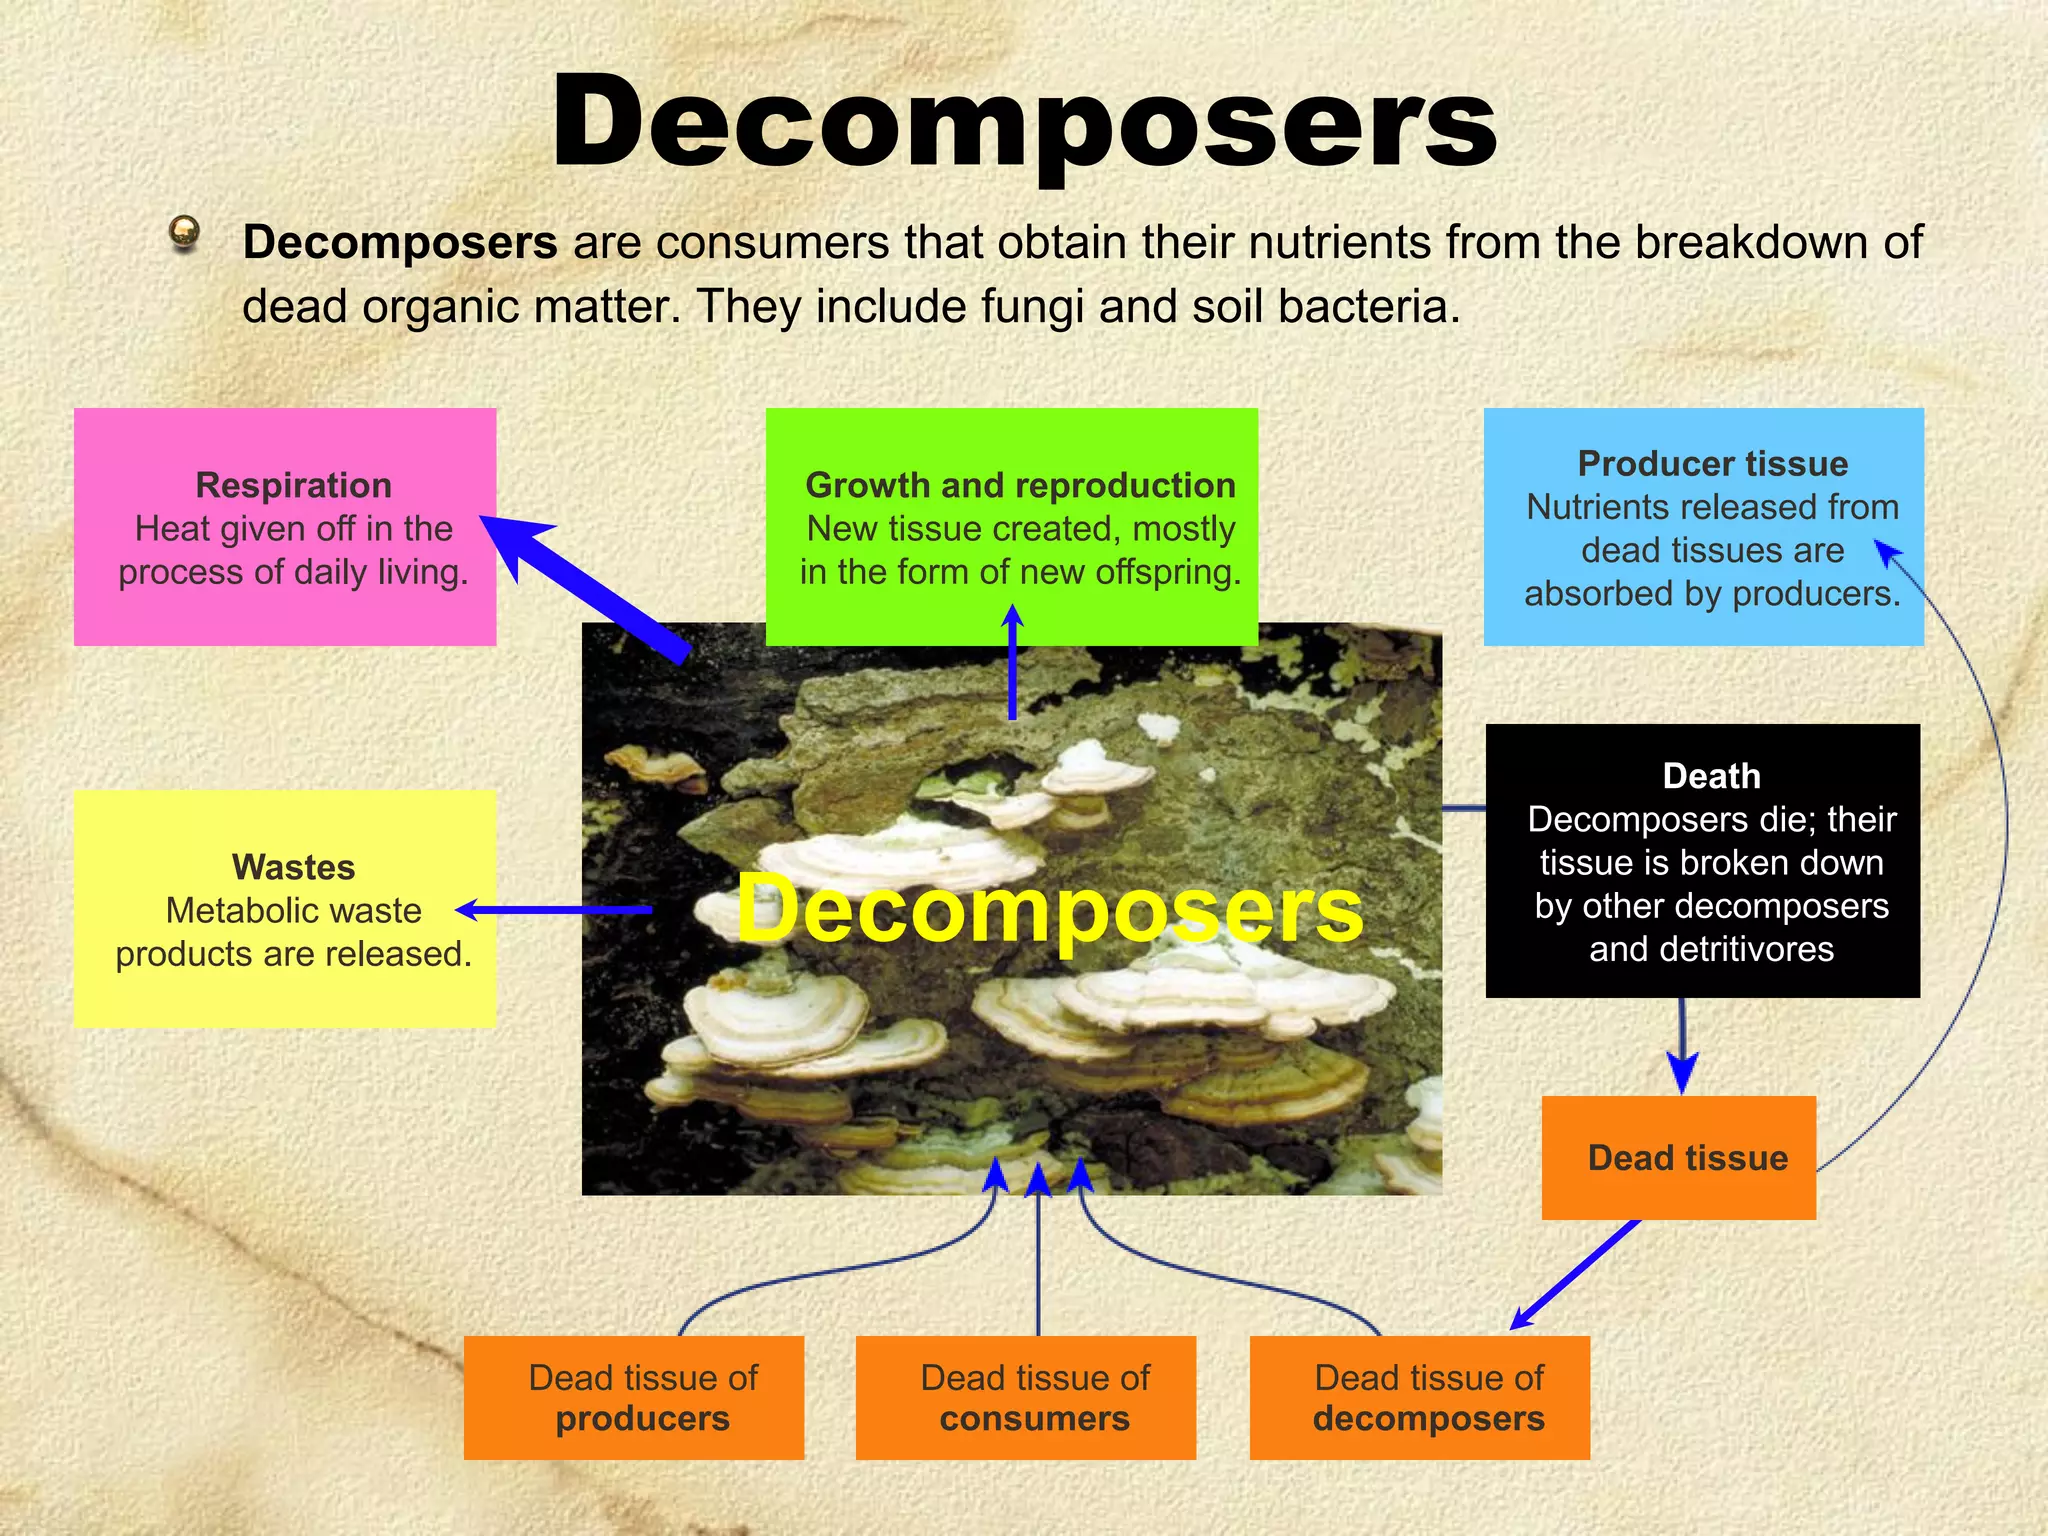
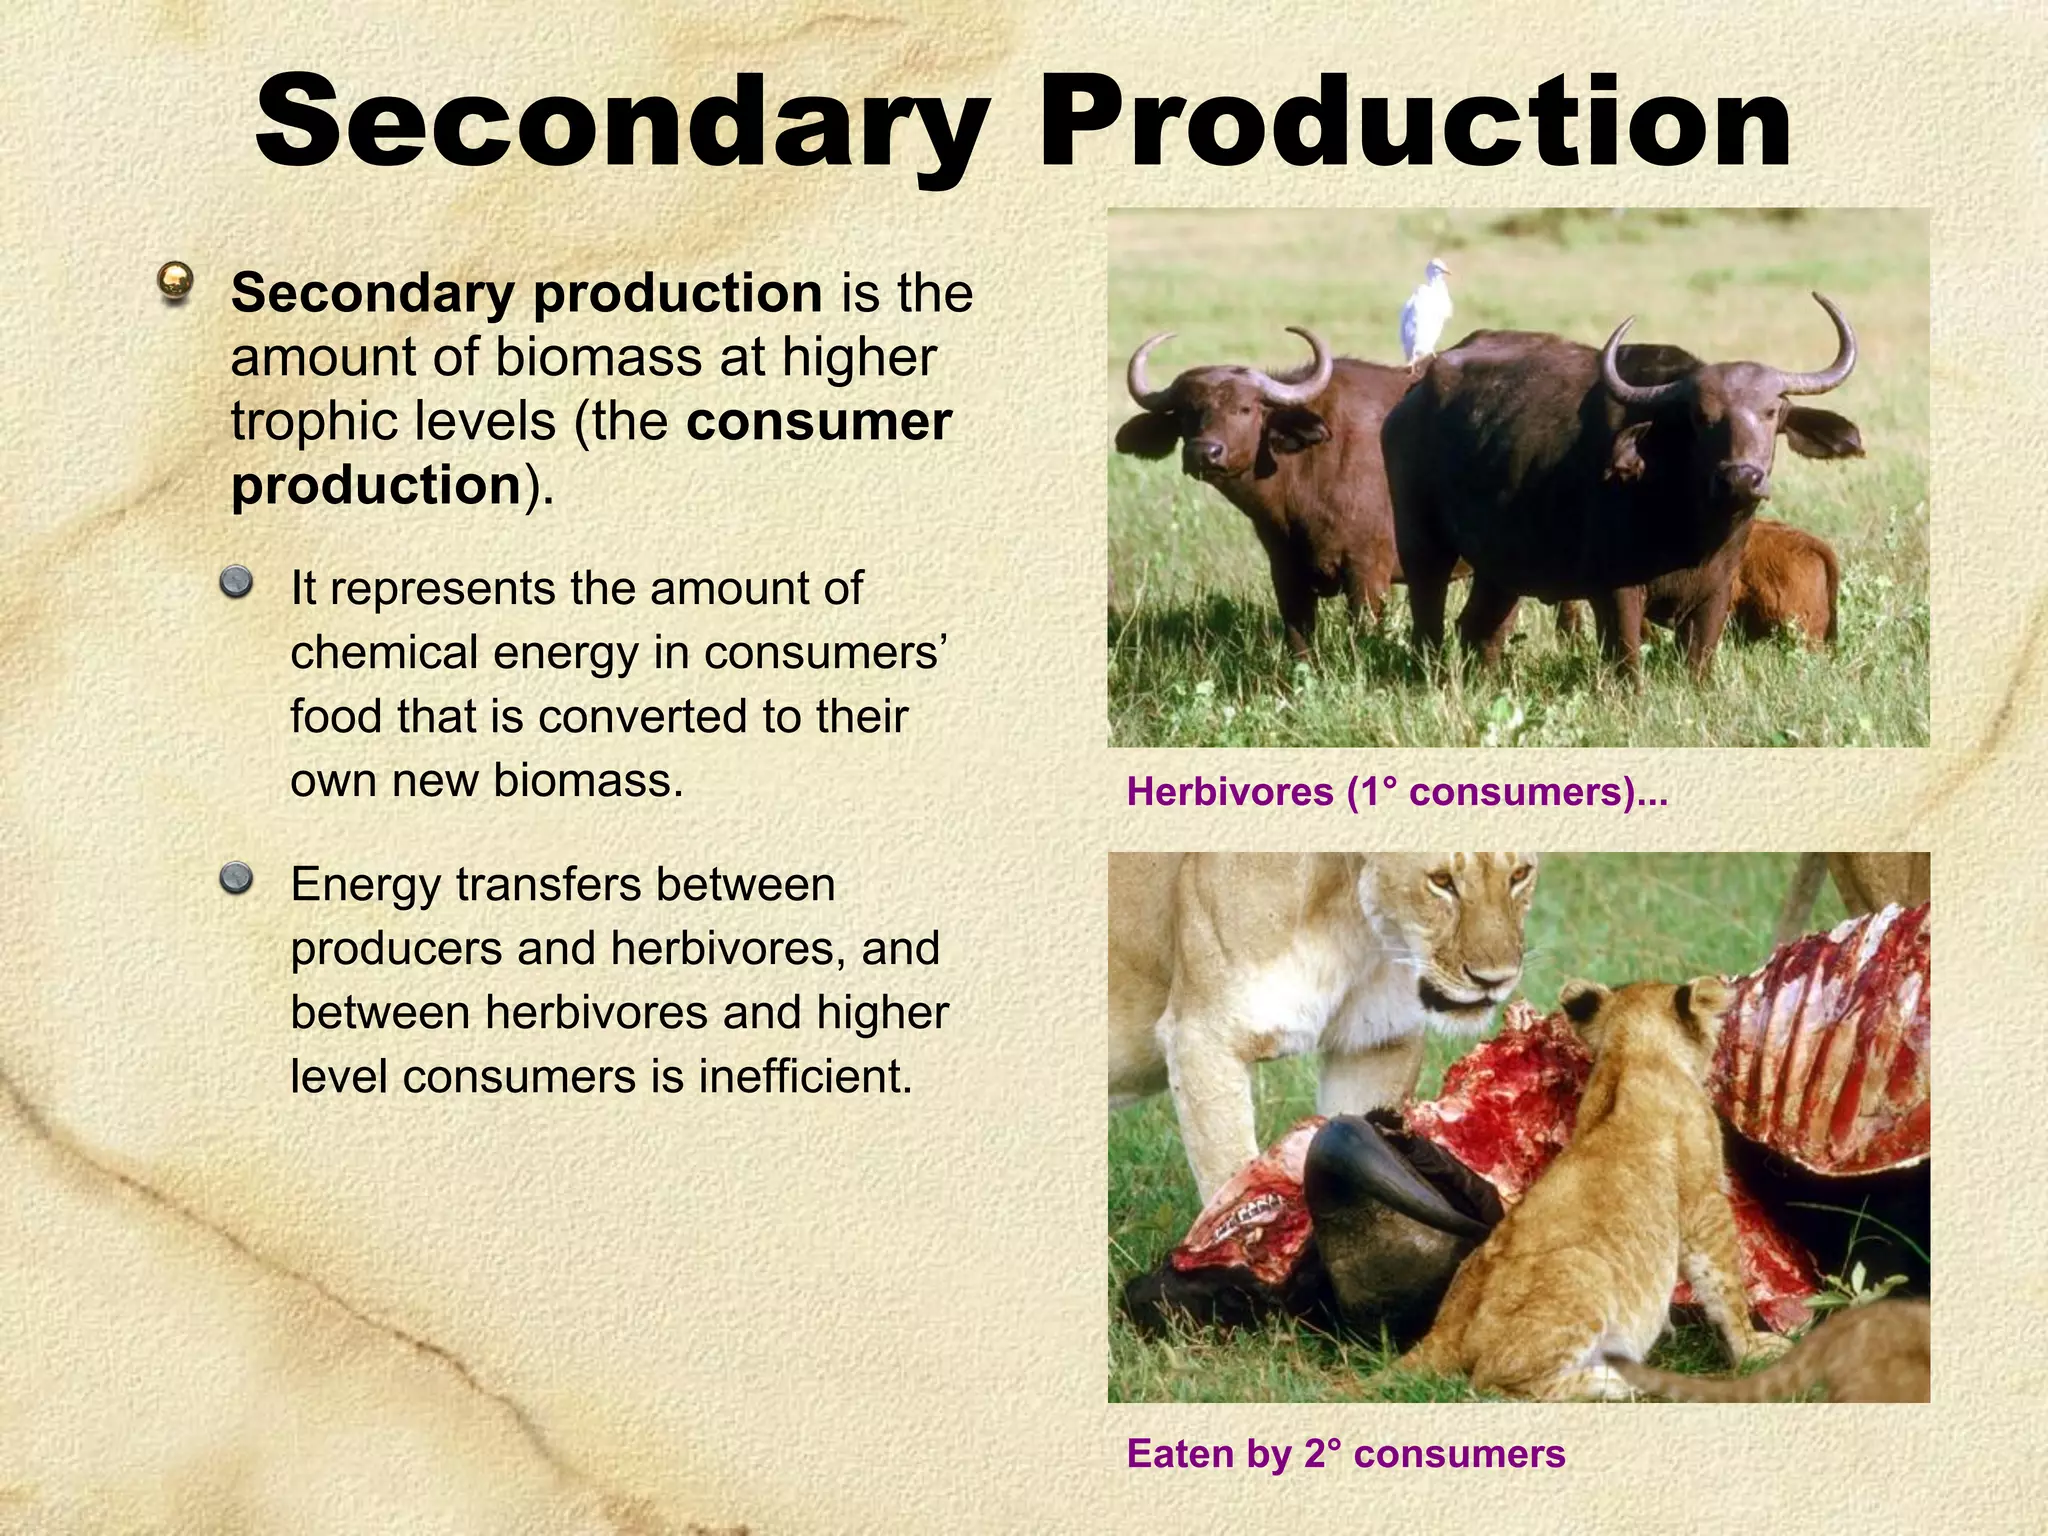
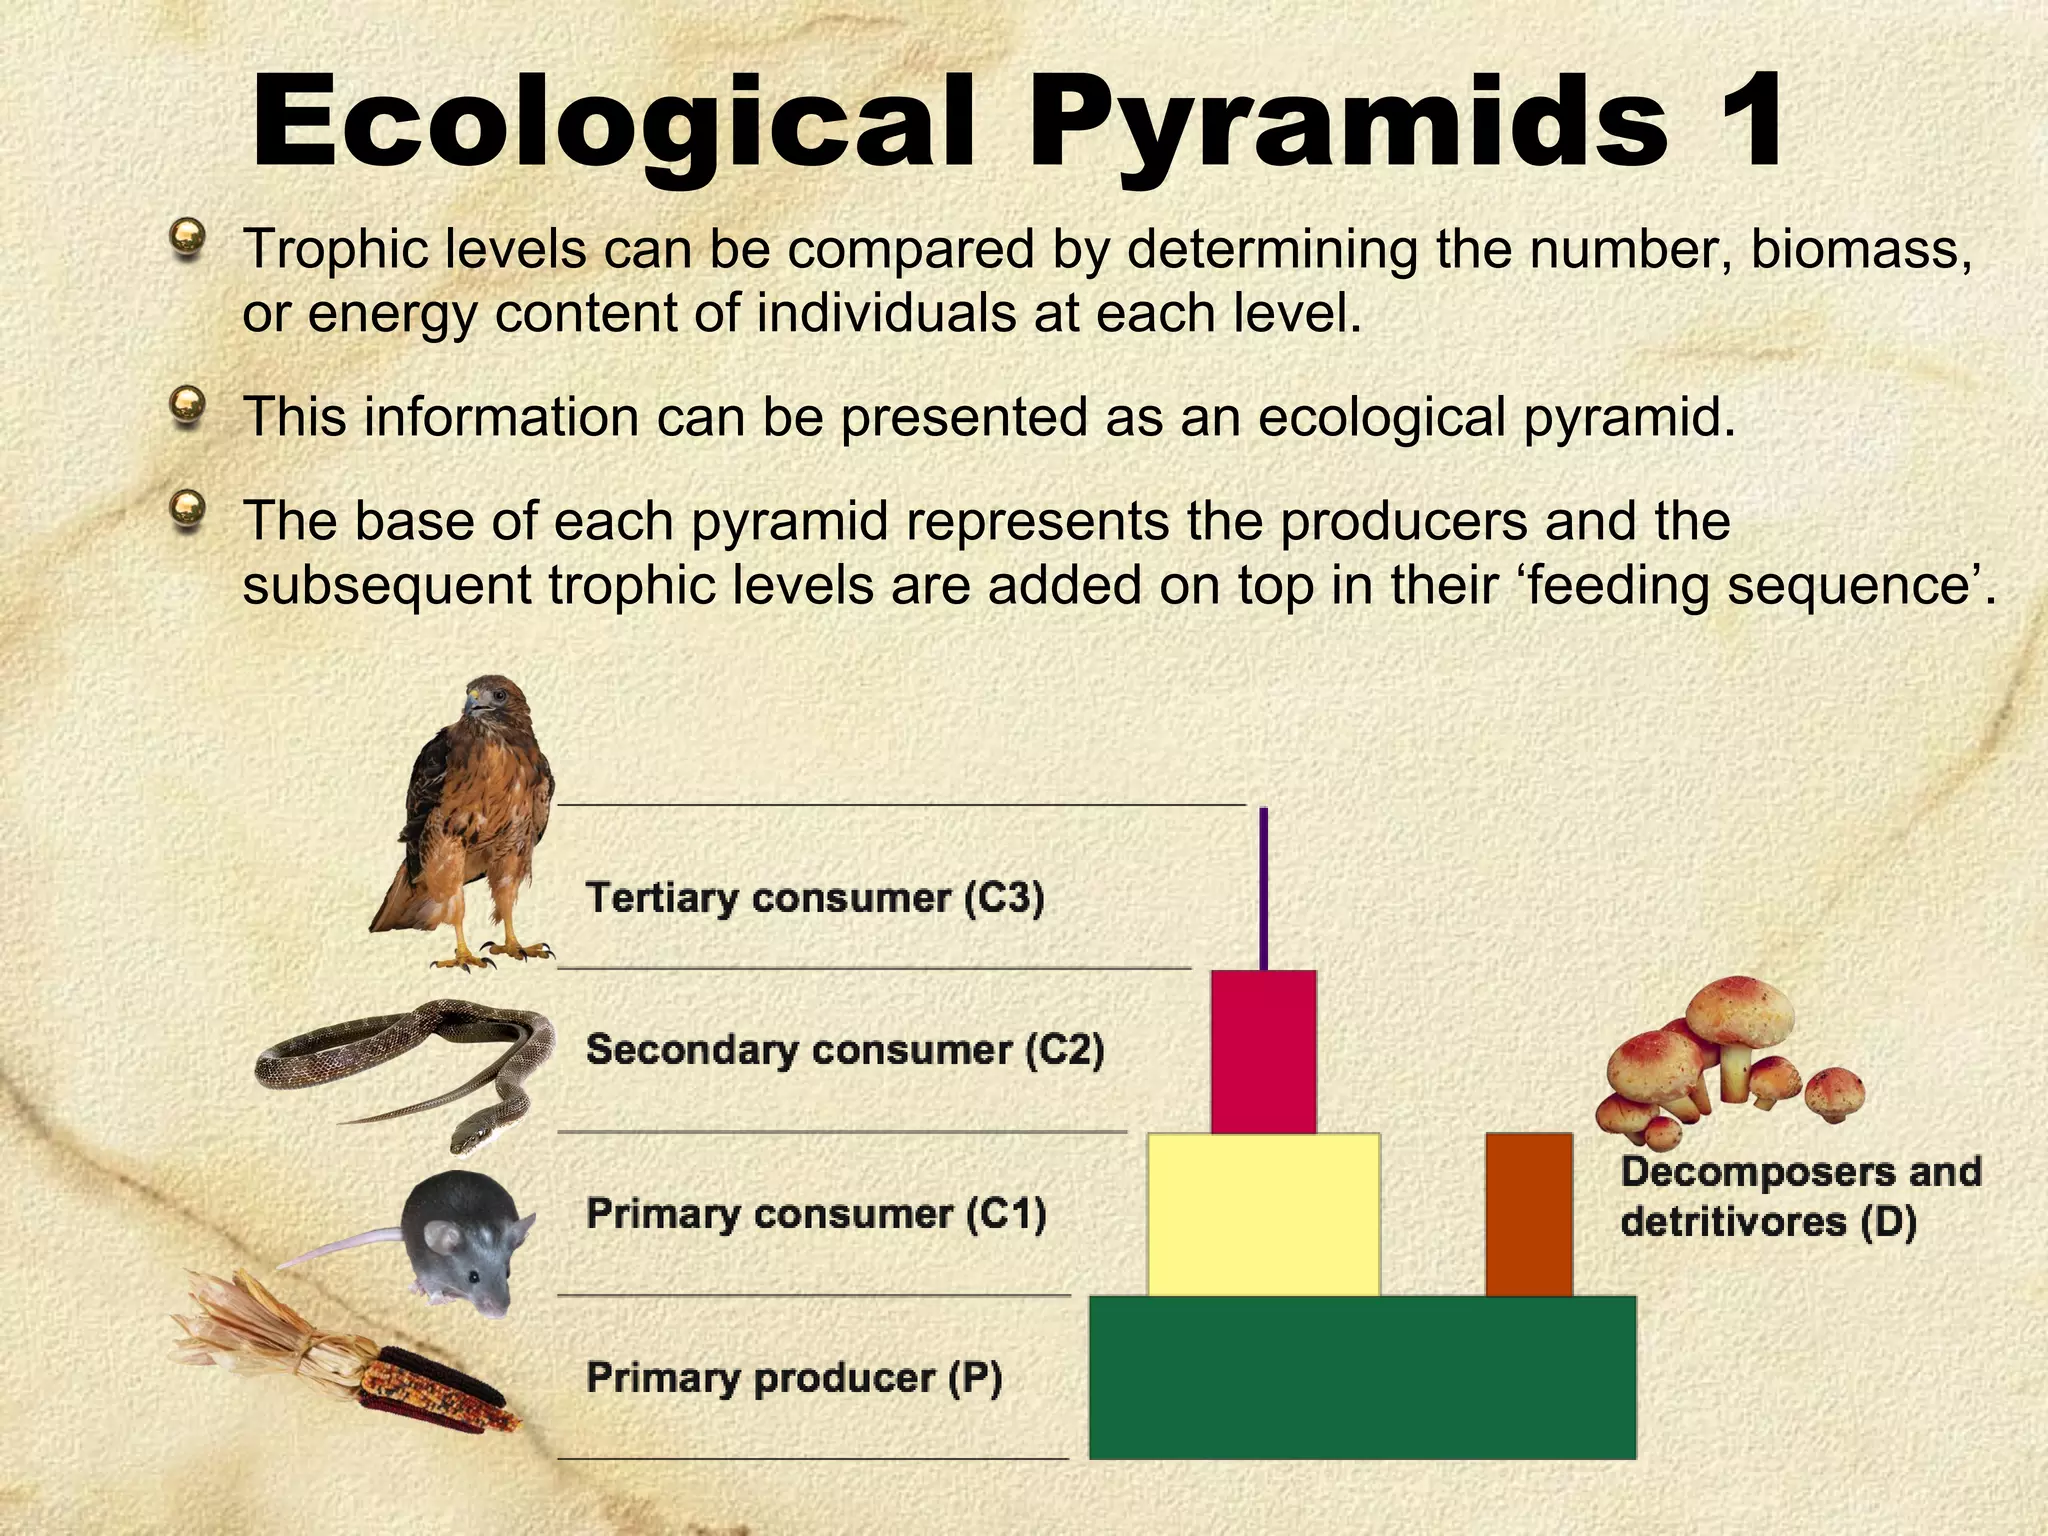
1) Ecosystems have trophic structures that determine energy flow and nutrient cycling through feeding relationships between species organized into trophic levels.
2) Producers, which include photosynthetic plants, algae, and bacteria, occupy the first trophic level and support all other levels by harnessing solar or chemical energy.
3) Consumers are organisms that feed on producers or other consumers and are ranked according to the trophic level they occupy, such as herbivores on the first level or carnivores on higher levels.
Ecology derived from two Greek word “oikos” means house, habitation or place of living & “logos” means study.
Definition: Ecology is the study of interrelationship between living organism and their physical and biological environment.
Ecology derived from two Greek word “oikos” means house, habitation or place of living & “logos” means study.
Definition: Ecology is the study of interrelationship between living organism and their physical and biological environment.
you will learn about the primary and secondary productivity involved in ecosystem and about its types. it includes gross and net primary productivity also.
It is quite interesting to note that the only producer of food in the entire world is PLANT. All others are consumers, and depend only on plants to provide food to all the living organisms and species.
This Presentation is about the various types of ecosystem which is present in our environment.....It is also for students who are interested in this topic
I am pleased to present an outstanding Sample ESS IA that secured an impressive 28 out of 30 marks, resulting in a remarkable 7-point score. This exemplar serves as a valuable reference and resource for your ESS class, offering comprehensive insights and invaluable guidance for both students and educators alike.
Key Points:
Exceptional Achievement: The IA achieved a remarkable 28 out of 30 marks, showcasing excellence in content, research, and presentation.
7-Point Performance: Scoring a perfect 7 points in the IA demonstrates a deep understanding of Environmental Systems and Societies.
Educational Resource: This exemplary IA serves as an educational resource, providing a model for structuring, researching, and presenting ESS projects.
Invaluable Insights: Reviewing this IA will offer invaluable insights into what constitutes a high-scoring ESS IA, helping students aim for excellence.
Guidance for Students: Students can utilize this IA as a reference to enhance their own IA projects, aiming for similarly outstanding results.
Educator's Tool: Educators can use this IA to exemplify quality work to their students, facilitating better understanding of assessment expectations.
We encourage you to make the most of this exemplary ESS IA as a guiding light in your pursuit of excellence in Environmental Systems and Societies studies.
Very interesting - Can you guess what is common between all these prominent temples.
If your answer is, they all are Shiva temples, you are only partially correct.
It is actually the longitude in which these temples are located.
They all are located in 79° longitudes. What is surprising and awesome is that how the architects of these temples many hundreds of kilometers apart came up with these precise locations without GPS
K.Guru Charan Kumar, IB ESS Teacher at Pathways World School, Aravali discusses the importance of taking his IB students on field trips that enhance the learning they do in the classroom. Over the past year, K. Guru has shared numerous adventures with the IB community and we asked him to reflect on why field experience is central to his teaching.
My mission is to deliver world-class international education power point presentation through the provision of high-quality curricula, assessment and services for the IGCSE EVM.
A wide range of materials and resources is available through my Slide share to support teachers and learners in Cambridge schools. Resources suit a variety of teaching methods in different international contexts.
The content of this power point presentation is designed to encourage reflection on the limits to growth and sustainable development for IGCSE EVM.
The content of this PowerPoint is structured as a series of learning outcomes that lay out what candidates should know, understand and be able to analyze and discuss.
Environmental Management is concerned not only with the impact of humankind on the planet but also with the patterns of human behavior necessary to preserve and manage the environment in a self-sustaining way. Study is linked to the areas of new thinking in environmental management, environmental economics and the quest for alternative technologies. Classroom studies and optional coursework allow candidates to obtain a local as well as a global perspective.
As part of the IB philosophy, one must understand that not everything can be taught within the classroom. Thus, field trips provide the perfect opportunity to apply ourselves fruitfully. Laden with their luggage, and appetite for knowledge, the group of ESS and Geography students readied themselves for the learning expedition to Sundarbans, West Bengal.
The most engaging component of ESS & Geo IBDP is the coursework/fieldwork which culminates in an Analytical report based on Primary Data which the students gather and work upon. In this context we are all set to embark on our journey to Sundarbans Delta (UNESCO World Heritage site) which is located in Kolkata. This year 41 IBDP students with 4 teachers ventured for the very first time in the country to visit the Sundarbans(Kolkata) for the field trip.
The IBDP ESS & Geography students studied “Ecological Footprints of Eco tourism & Environmental Sustainability, Quality and Patterns of Resource Consumption” with special reference to Mangrove forest of Sundarbans, West Bengal.
Farmers from Maldevta Village, who work in the lowest sector of the economy, have minimal land and resources to help them grow crops. This obligates them to enter the hills with their cattle to allow grazing. Farmers also clear some forest areas, to increase their farm land for more income, thus reducing the biodiversity. As a result of the reduced in forest area and resources, wild animals invade villages and destroy farmlands. In some cases, because of minimal knowledge of the chemical Pesticides, it’s overuse affects not only the farmland, but also nearby water resources as it leads to eutrophication. This relates to my RQ because after surveying the villagers and collecting the raw data from the Simpson’s Diversity index it allowed me to evaluate the effect of human intervention on the natural environment and thus evaluating the effect of Ecological Footprint.
This IA talks about research is to compare Simpson Diversity of four areas of Mahendrapur village based on the amount of sunlight received and the amount of nutrients found near the place where they are located (near the water body or away from the water body).
Synthetic Fiber Construction in lab .pptxPavel ( NSTU)
Synthetic fiber production is a fascinating and complex field that blends chemistry, engineering, and environmental science. By understanding these aspects, students can gain a comprehensive view of synthetic fiber production, its impact on society and the environment, and the potential for future innovations. Synthetic fibers play a crucial role in modern society, impacting various aspects of daily life, industry, and the environment. ynthetic fibers are integral to modern life, offering a range of benefits from cost-effectiveness and versatility to innovative applications and performance characteristics. While they pose environmental challenges, ongoing research and development aim to create more sustainable and eco-friendly alternatives. Understanding the importance of synthetic fibers helps in appreciating their role in the economy, industry, and daily life, while also emphasizing the need for sustainable practices and innovation.
Safalta Digital marketing institute in Noida, provide complete applications that encompass a huge range of virtual advertising and marketing additives, which includes search engine optimization, virtual communication advertising, pay-per-click on marketing, content material advertising, internet analytics, and greater. These university courses are designed for students who possess a comprehensive understanding of virtual marketing strategies and attributes.Safalta Digital Marketing Institute in Noida is a first choice for young individuals or students who are looking to start their careers in the field of digital advertising. The institute gives specialized courses designed and certification.
for beginners, providing thorough training in areas such as SEO, digital communication marketing, and PPC training in Noida. After finishing the program, students receive the certifications recognised by top different universitie, setting a strong foundation for a successful career in digital marketing.
Operation “Blue Star” is the only event in the history of Independent India where the state went into war with its own people. Even after about 40 years it is not clear if it was culmination of states anger over people of the region, a political game of power or start of dictatorial chapter in the democratic setup.
The people of Punjab felt alienated from main stream due to denial of their just demands during a long democratic struggle since independence. As it happen all over the word, it led to militant struggle with great loss of lives of military, police and civilian personnel. Killing of Indira Gandhi and massacre of innocent Sikhs in Delhi and other India cities was also associated with this movement.
Unit 8 - Information and Communication Technology (Paper I).pdfThiyagu K
This slides describes the basic concepts of ICT, basics of Email, Emerging Technology and Digital Initiatives in Education. This presentations aligns with the UGC Paper I syllabus.
Introduction to AI for Nonprofits with Tapp NetworkTechSoup
Dive into the world of AI! Experts Jon Hill and Tareq Monaur will guide you through AI's role in enhancing nonprofit websites and basic marketing strategies, making it easy to understand and apply.
Macroeconomics- Movie Location
This will be used as part of your Personal Professional Portfolio once graded.
Objective:
Prepare a presentation or a paper using research, basic comparative analysis, data organization and application of economic information. You will make an informed assessment of an economic climate outside of the United States to accomplish an entertainment industry objective.
Read| The latest issue of The Challenger is here! We are thrilled to announce that our school paper has qualified for the NATIONAL SCHOOLS PRESS CONFERENCE (NSPC) 2024. Thank you for your unwavering support and trust. Dive into the stories that made us stand out!
2. Trophic Structure 1
Every ecosystem has a trophic
structure: a hierarchy of feeding
relationships which determines the
pathways for energy flow and nutrient
cycling.
Species are assigned to trophic levels
on the basis of their nutrition.
Producers (P) occupy the first trophic
level and directly or indirectly support all
other levels. Producers derive their
energy from the sun in most cases.
Hydrothermal vent communities are an
exception; the producers are
chemosynthetic bacteria that derive energy
by oxidizing hydrogen sulfide.
Deep sea
hydrothermal vent
3. Trophic Structure 2
Producer
(P)
All organisms other than producers are
consumers (C).
Consumers are ranked according to the
trophic level they occupy. First order (or
primary) consumers (herbivores), rely
directly on producers for their energy.
A special class of consumers, the detritivores,
derive their energy from the detritus representing
all trophic levels.
Photosynthetic productivity (the amount of
food generated per unit time through
photosynthesis) sets the limit for the energy
budget of an ecosystem.
Consumer
(C1)
Consumer
(C2)
Consumer
(C3)
4. Organisation of Trophic Levels
Trophic structure can be described by trophic level or consumer level:
5. Major Trophic Levels
Trophic Level
Source of Energy
Examples
Producers
Solar energy
Green plants, photosynthetic
protists and bacteria
Herbivores
Producers
Grasshoppers, water fleas,
antelope, termites
Primary
Carnivores
Herbivores
Wolves, spiders,
some snakes, warblers
Secondary
Carnivores
Primary carnivores
Killer whales, tuna, falcons
Omnivores
Several trophic levels
Humans, rats, opossums,
bears, racoons, crabs
Detritivores and
Decomposers
Wastes and dead bodies
of other organisms
Fungi, many bacteria,
earthworms, vultures
6. Food Chains
The sequence of organisms, each of which is a source of food for
the next, is called a food chain.
Food chains commonly have four links but seldom more than six.
In food chains the arrows go from food to feeder.
Producer
(P)
Herbivore
1°
carnivore
2°
carnivore
Organisms whose food is obtained through the same number of
links belong to the same trophic level.
Examples of food chains include:
seaweed
aquatic
macrophyte
cat’s eye
whelk
seagull
freshwater
crayfish
brown
trout
kingfisher
7. Food Chain Energy Flow
Energy is lost as heat from each trophic level via respiration.
Dead organisms at each level are decomposed.
Some secondary consumers feed directly off decomposer organisms.
Heat
Heat
Heat
Heat
Heat
8. Food Webs
Some consumers (particularly
‘top’ carnivores and omnivores)
may feed at several different
trophic levels, and many
herbivores eat many plant
species.
For example, moose feed on
grasses, birch, aspen, firs, and
aquatic plants.
The different food chains in an
ecosystem therefore tend to
form complex webs of feeding
interactions called a food web.
9. A Simple Lake Food Web
This lake food web includes only a limited number of organisms, and
only two producers. Even with these restrictions, the web is complex.
10. Energy in
Ecosystems
Light energy
Energy, unlike, matter,
cannot be recycled.
Ecosystems must receive
a constant input of new
energy from an outside
source which, in most
cases, is the sun.
Photosynthesis
Organic
molecule
s and
oxygen
Carbon
dioxide
and
water
Cellular respiration
11. Energy in
Ecosystems
Energy is ultimately lost as heat
to the atmosphere.
Cellular respiration
Static biomass
locks up some
chemical energy
Growth and repair
of tissues
Muscle
contraction and
flagella movement
Active transport
processes, e.g.
ion pumps
Production of
macromolecules,
e.g. proteins
Heat Energy
Cellular work and accumulated biomass ultimately dissipates as heat energy
12. Energy Inputs and Outputs
Living things are classified
according to the way in which
they obtain their energy:
Producers (or autotrophs)
Consumers (or heterotrophs)
13. Energy Transformations
Green plants, algae, and some bacteria use the sun’s energy
to produce glucose in a process called photosynthesis.
The chemical energy stored in glucose fuels metabolism.
The photosynthesis that occurs
in the oceans is vital to life on
Earth, providing oxygen and
absorbing carbon dioxide.
Cellular respiration is the
process by which organisms
break down energy rich
molecules (e.g. glucose)
to release the energy in
a useable form (ATP).
Cellular respiration
in mitochondria
Photosynthesis
in chloroplasts
14. Producers
Producers are able to manufacture their food from simple inorganic
substances (e.g. CO2). Producers include green plants, algae and
other photosynthetic protists, and some bacteria.
Respiration
Heat given off in the
process of daily living.
Growth and new offspring
New offspring as well as new
branches and leaves.
Wastes
Metabolic waste
products are released.
Eaten by consumers
Some tissue eaten by
herbivores and
omnivores.
Producers
Solar
radiation
Reflected light
Unused solar radiation is
reflected off the surface
of the organism.
Dead tissue
Death
Some tissue is not
eaten by consumers
and becomes food for
decomposers.
15. Consumers
Consumers are organisms that feed on autotrophs or on other
heterotrophs to obtain their energy.
Includes: animals, heterotrophic protists, and some bacteria.
Respiration
Heat given off in the
process of daily living.
Growth and reproduction
New offspring as well as
growth and weight gain.
Wastes
Metabolic waste
products are released
(e.g. urine, feces, CO2)
Consumers
Death
Some tissue not eaten
by consumers becomes
food for detritivores and
decomposers.
Dead tissue
Eaten by consumers
Some tissue eaten by
carnivores and
omnivores.
Food
Consumers obtain their
energy from a variety of
sources: plant tissues
(herbivores), animal
tissues (carnivores),
plant and animal tissues
(omnivores), dead
organic matter or
detritus (detritivores
and decomposers).
16. Decomposers
Decomposers are consumers that obtain their nutrients from the breakdown of
dead organic matter. They include fungi and soil bacteria.
Respiration
Heat given off in the
process of daily living.
Wastes
Metabolic waste
products are released.
Producer tissue
Nutrients released from
dead tissues are
absorbed by producers.
Growth and reproduction
New tissue created, mostly
in the form of new offspring.
Decomposers
Death
Decomposers die; their
tissue is broken down
by other decomposers
and detritivores
Dead tissue
Dead tissue of
producers
Dead tissue of
consumers
Dead tissue of
decomposers
17. Primary Production
The energy entering ecosystems is
fixed by producers in photosynthesis.
Gross primary production (GPP) is the
total energy fixed by a plant through
photosynthesis.
Net primary production (NPP) is the
GPP minus the energy required by the
plant for respiration. It represents the
amount of stored chemical energy that
will be available to consumers in an
ecosystem.
Productivity is defined as the rate of
production. Net primary productivity
is the biomass produced per unit area
per unit time, e.g. g m-2y-1
Grassland: high productivity
Grass biomass available to consumers
18. Measuring Plant Productivity
The primary productivity
of an ecosystem depends
on a number of interrelated
factors, such as light
intensity, temperature,
nutrient availability,
water, and
mineral supply.
The most productive
ecosystems are
systems with high
temperatures, plenty of
water, and non-limiting
supplies of soil nitrogen.
19. Ecosystem Productivity
The primary productivity of oceans is lower than that of terrestrial
ecosystems because the water reflects (or absorbs) much of the
light energy before it reaches and is utilized by the plant.
kcal m-2y-1
Although the open ocean’s
kJ m-2y-1
productivity is low, the ocean
contributes a lot to the Earth’s total
production because of its large size.
Tropical rainforest also contributes a
lot because of its high productivity.
20. Secondary Production
Secondary production is the
amount of biomass at higher
trophic levels (the consumer
production).
It represents the amount of
chemical energy in consumers’
food that is converted to their
own new biomass.
Herbivores (1° consumers)...
Energy transfers between
producers and herbivores, and
between herbivores and higher
level consumers is inefficient.
Eaten by 2° consumers
21. Ecological Efficiency
The percentage of energy
transferred from one
trophic level to the next
varies between 5% and
20% and is called the
ecological efficiency.
Plant material
consumed by caterpillar
An average figure of 10% is
often used. This ten
percent law states that the
total energy content of a
trophic level in an
ecosystem is only about
one-tenth that of the
preceding level.
200 J
100 J
Feces
33 J
Growth
67 J
Cellular
respiration
22. Energy Flow in Ecosystems
Energy flow into and out of each trophic level in a food chain can be
represented on a diagram using arrows of different sizes to represent
the different amounts of energy lost from particular levels.
The energy available to each trophic level will always equal the
amount entering that trophic level, minus total losses to that level.
24. Ecological Pyramids 1
Trophic levels can be compared by determining the number, biomass,
or energy content of individuals at each level.
This information can be presented as an ecological pyramid.
The base of each pyramid represents the producers and the
subsequent trophic levels are added on top in their ‘feeding sequence’.
25. Ecological Pyramids 2
Various types of pyramid are used
to describe different aspects of an
ecosystem’s trophic structure:
Pyramids of numbers: In which the
size of each tier is proportional to the
number of individuals present at each
trophic level.
Pyramid of numbers
Pyramids of biomass: Each tier
represents the total dry weight of
organisms at each trophic level.
Pyramids of energy (production):
The size of each tier is proportional to
the production (e.g. in kJ) of each
trophic level.
Pyramid of biomass
Pyramid of energy
26. Pyramids of Numbers
In a typical pyramid of numbers, the number of
individuals supported by the ecosystem at successive
trophic levels declines progressively.
This reflects the fact that the smaller biomass of top
level consumers tends to be concentrated in a
relatively small number of large animals.
There are some exceptions. In some forests a few
producers (of a very large size) may support a larger
number of consumers, and the pyramid is inverted.
This also occurs in plant/parasite food webs.
Forest
Grassland
27. Pyramids of Biomass
In pyramids of biomass, dry weight is usually
used as the measure of mass because the water
content of organisms varies.
Organism size is taken into account so meaningful
comparisons of different trophic levels are possible.
Biomass pyramids may be inverted in some
systems (e.g. in some plankton communities)
because the algal (producer) biomass at any one
time is low, but the algae are reproducing rapidly
and have a high productivity.
A Florida bog community
The English Channel
28. Pyramids of Energy
Pyramids of energy (or production)
are often very similar in appearance
to pyramids of biomass.
The energy content at each trophic
level is generally comparable to the
biomass because similar amounts of
dry biomass tend to have about the
same energy content.
This example illustrates the similarity
between pyramids of biomass (gm-2)
and energy (kJ) in a freshwater lake
community. During warm months,
when algal turnover time is short,
pyramids of energy and biomass may
be inverted.
Zooplankton (C1)
29. Community Patterns
Communities typically show
patterns in both space and time.
These include:
Zonation: Changes in the
composition of a community which
occur in response to an
environmental gradient, e.g. with
altitude or on a shoreline.
Altitudinal zonation
Stratification: Layering of different
plant species into distinct strata.
Succession: Changes in the
species composition of a community
over time.
Succession on Maui, Hawaii
30. Zonation
Zonation refers to the
division of an ecosystem into
distinct zones that experience
similar abiotic conditions.
The gradient in the physical
environment is reflected in the
species assemblages found at
the different zones.
In a more global sense,
differences in latitude and
altitude create distinctive zones
of vegetation type, or biomes.
Rock pool
The Earth from space
31. Shoreline Zonation
Zonation is particularly clear on an
exposed rocky seashore, where
assemblages of different species form
a banding pattern approximately
parallel to the waterline.
Rocky shores exist where wave action
prevents the deposition of much sediment.
The rock forms a stable platform for the
secure attachment of organisms such as
large seaweeds and barnacles.
Sandy shores are less stable than rocky
shores and the organisms found there are
adapted to the more mobile substrate.
32. Zonation on a Rocky Shore 1
Northern hemisphere: In Britain,
exposed rocky shores occur along
much of the western coastlines. Where
several species are indicated in a zonal
band, they occupy the entire band.
SHT = Extreme spring High Tide Mark
SLT = Extreme spring Low Tide Mark
MHT = Mean High Tide Mark
MLT = Mean Low Tide Mark
33. Zonation on a Sandy Shore 1
Northern hemisphere (Britain):
Exposed sandy shores offer fewer
opportunities for several species to
coexist within the same zonal band.
SHT = Extreme spring High Tide Mark
SLT = Extreme spring Low Tide Mark
MHT = Mean High Tide Mark
MLT = Mean Low Tide Mark
35. Zonation on a Rocky Shore 2
Southern hemisphere: A similar
pattern to the Northern hemisphere,
but with Australasian species. Several
species coexist within the same zone.
SHT = Extreme spring High Tide Mark
SLT = Extreme spring Low Tide Mark
MHT = Mean High Tide Mark
MLT = Mean Low Tide Mark
36. Zonation on a Sandy Shore 2
Southern hemisphere: A similar pattern
to that seen in the Northern hemisphere,
but with Australasian species. Note that
there are fewer species occupying wider
zones than on the rocky shore.
SHT = Extreme spring High Tide Mark
SLT = Extreme spring Low Tide Mark
MHT = Mean High Tide Mark
MLT = Mean Low Tide Mark
38. Zonation With Altitude
Altitudinal zonation is clearly visible on the sides of mountains.
With increasing altitude, the vegetation changes in composition,
growth form, and height.
Zonation patterns may provide the basis for defining vegetation types in
the region.
39. Community Change With Altitude
Both vegetation and soil type may change with increasing altitude.
On Mount Kosciusko, Australia, low altitude soils have low levels of organic
matter supporting dry tussock grassland vegetation.
The high altitude alpine soils are rich in organic matter, largely due to slow
decay rates.
40. Stratification
Stratification describes a
pattern of vertical layering
where the layers (or strata)
comprise different vegetation
types.
Stratification is a feature of
both temperate and tropical
forest communities
throughout the world.
Species composition varies
according to local conditions
(altitude, soil type,
temperature, precipitation)
and vegetation history.
41. Tropical Rainforest Structure
Canopy
Tropical rainforests are
complex and can be divided
into four distinct strata
representing zones of
different vegetation.
The strata are:
Subcanopy
Canopy
Subcanopy
Understorey
Ground layer.
Understorey
Ground layer
In addition, epiphytes
(perching plants) and lianes
(climbing vines) occupy
several strata in the forest.
42. Epiphytes and Lianes
Perching plants, or epiphytes, cling
to the trunks of the canopy trees or
grow in the leaf litter that
accumulates between the
branching limbs of large trees.
Epiphytic species include many ferns
and orchids; about half of the world’s
estimated 30 000 orchid species are
epiphytic.
Lianes are rooted in the ground,
but clamber into the canopy where
higher light levels enable them to
develop extensive foliage.
Staghorn
fern
Fern
Orchid
Queensland tropical rainforest
43. Podocarp Forest
Structure
Lowland podocarpbroadleaf forests in
the Southern
Hemisphere have a
more complex
structure than the
temperate (cool)
forests of the Northern
Hemisphere, with at
least five strata as
well as epiphytes,
lianes, and
emergents.
Emergent
Canopy
Subcanopy
Epiphyte
Tree fern layer
Shrub layer
Ground layer
44. Ecological Succession
Ecological succession is the process by which communities
in a particular area change over time.
Succession takes place as a result of complex interactions of
biotic and abiotic factors.
Community composition changes with time
Past
community
Present
community
Future
community
Some species in the
past community were
out-competed or did
not tolerate altered
abiotic conditions.
The present community
modifies such abiotic factors as:
Changing conditions in the
present community will
allow new species to
become established.
These will make up the
future community.
• Light intensity and quality
• Wind speed and direction
• Air temperature and humidity
• Soil composition and water content
45. Early Successional
Communities
A succession (or sere) proceeds
in seral stages, until the formation
of a climax community, which is
stable until further disturbance.
Pioneer community, Hawaii
Early successional (or pioneer)
communities are characterized by:
Simple structure, with a small
number of species interactions.
Broad niches.
Low species diversity.
Broad niches
46. Climax
Communities
In contrast to early successional
communities, climax
communities typically show:
Complex structure, with a large
number of species interactions.
Climax community, Hawaii
Narrow niches.
High species diversity.
Large number of species interactions
47. Primary
Succession
Primary succession refers to colonization
of a region where there is no pre-existing
community. Examples include:
newly emerged coral atolls, volcanic islands
newly formed glacial moraines
islands where the previous community has
been extinguished by a volcanic eruption
A classical sequence of colonization
begins with lichens, mosses, and
liverworts, progresses to ferns, grasses,
shrubs, and culminates in a climax
community of mature forest.
In reality, this scenario is rare.
Hawaii: Local plants are able to
rapidly recolonize barren areas
48. Mount St Helens
Primary succession more typically
follows a sequence similar to the
revegetation of Mt St Helens, USA,
following its eruption on May 18, 1980.
The vegetation in some of the blast
areas began recovering quickly, with
fireweed growing through the ash
within weeks of the eruption.
Animals such as pocket gophers,
mice, frogs, and insects were
hibernating below ground and
survived the blast. Their activities
played an important role in spreading
seed and mixing soil and ash.
Revegetation: Mt St Helens
49. Secondary Succession
Cyclone
Secondary succession occurs
where an existing community has
been cleared by a disturbance
that does not involve complete
soil loss.
Such disturbance events include
cyclone damage, forest fires
and hillside slips.
Because there is still soil present,
the ecosystem recovery tends to
be more rapid than primary
succession, although the time
scale depends on the species
involved and on climatic and
edaphic (soil) factors.
Forest fire
50. Deflected Successions
Humans may deflect the natural course of succession, e.g. through
controlled burning, mowing, or grazing livestock. The resulting climax
community will differ from the natural (pre-existing) community.
A relatively stable plant community arising from a deflected (or
arrested) succession is called a plagioclimax.
Grassland and healthland in lowland Britain are plagioclimaxes.
51. Gap Regeneration
The reduced sunlight beneath large
canopy trees impedes the growth of
the saplings below. When a large
tree falls, a crucial hole opens in the
canopy, allowing sunlight to reach
the saplings below.
The forest regeneration following the
loss of a predominant canopy tree is
called gap regeneration.
Gap regeneration is an example of
secondary succession.
QuickTime™ and a
TIFF (U ncom pressed) decompressor
are needed to see this picture.
52. Gap
Regeneration
Cycle
Gap regeneration is an important
process in established forests in
temperate and tropical regions.
Gaps are the sites of greatest
understorey regeneration and
species recruitment.
The creation of a gap allows
more light to penetrate the
canopy and alters other factors
that affect regeneration, exposing
mineral soils and altering nutrient
and moisture regimes.
53. Wetland Succession 1
Wetland successions follow a relatively predictable sequence, with
the final species assemblages being dependent on local conditions.
Stage 1: An open body of water, with time, becomes silted up and is invaded
by aquatic plants. Emergent macrophyte species colonize the accumulating
sediments, driving floating plants towards the remaining deeper water.
54. Wetland Succession 2
Stage 2: The increasing density of rooted emergent, submerged, and
floating macrophytes encourages further sedimentation by slowing
water flows and adding organic matter to the accumulating silt.
55. Wetland Succession 3
Stage 3: The resulting swamp is characterized by dense growths
of emergent macrophytes and permanent (although not
necessarily deep) standing water.
As sediment continues to accumulate, the swamp surface may
dry off in summer.
56. Wetland Succession 4
Stage 4: In colder climates, low evaporation rates and high
rainfall favor invasion by species such as Sphagnum, leading to
the development of a peat bog: a low pH, nutrient poor
environment where acid-tolerant plants replace swamp species.
In warmer regions, bog species include sedges, restiad rushes,
and club mosses.
57. Processes in Carbon Cycling
Carbon cycles between the living
(biotic) and non-living (abiotic)
environments.
Burning fossil fuels
Gaseous carbon is fixed in the process
of photosynthesis and returned to the
atmosphere in respiration.
Carbon may remain locked up in biotic
or abiotic systems for long periods of
time, e.g. in the wood of trees or in
fossil fuels such as coal or oil.
Humans have disturbed the balance of
the carbon cycle through activities
such as combustion and deforestation.
Petroleum
59. Nitrogen in the Environment
Nitrogen cycles between the biotic
and abiotic environments. Bacteria
play an important role in this transfer.
Nitrogen-fixing bacteria are able to fix
atmospheric nitrogen.
Nitrifying bacteria convert ammonia to
nitrite, and nitrite to nitrate.
Denitrifying bacteria return fixed
nitrogen to the atmosphere.
Atmospheric fixation also occurs as
a result of lightning discharges.
Humans intervene in the nitrogen
cycle by producing and applying
nitrogen fertilizers.
60. Nitrogen Transformations
The ability of some bacterial species to fix
atmospheric nitrogen or convert it between
states is important to agriculture.
Nitrogen-fixing species include Rhizobium,
which lives in a root symbiosis with leguminous
plants. Legumes, such as clover, beans, and
peas, are commonly planted as part of crop
rotation to restore soil nitrogen.
Nitrifying bacteria include Nitrosomonas and
Nitrobacter. These bacteria convert ammonia
to forms of nitrogen available to plants.
NH3
NO2
Nitrosomonas
-
NO3
Nitrobacter
-
Root nodules in Acacia
Nodule close-up
62. Phosphorus
Cycling
Phosphorus cycling is very slow
and tends to be local; in aquatic and
terrestrial ecosystems, it cycles
through food webs.
Deposition as guano…
Phosphorous is lost from ecosystems
through run-off, precipitation, and
sedimentation.
A very small amount of phosphorus
returns to the land as guano (manure,
typically of fish-eating birds).
Weathering and phosphatizing
bacteria return phosphorus to the soil.
Loss via sedimentation…
Human activity can result in excess
phosphorus entering water ways and is
a major contributor to eutrophication.
Fertilizer production
64. Water Transformations
The hydrological (water) cycle,
collects, purifies, and distributes
the Earth’s water.
Precipitation
Over the oceans, evaporation
exceeds precipitation. This results
in a net movement of water vapor
over the land.
On land, precipitation exceeds
evaporation. Some precipitation
becomes locked up in snow and
ice for varying lengths of time.
Most water forms surface and
groundwater systems that flow
back to the sea.
Rivers and streams
65. The Water
Cycle
Transport overland: net movement of water vapor by wind
Condensationconversion of
gaseous water vapor into liquid
water
Precipitation
(rain, sleet, hail, snow, fog)
Rain clouds
Evaporation
from inland lakes
and rivers
Precipitation
to land
Transpiration
Evaporation
from the land
Precipitation
Precipitation
over the
ocean
Surface
runoff (rapid)
Transpiration
from plants
Evaporation
Evaporation
from the ocean
Rivers
Water locked up
in snow and ice
Lakes
Infiltration: movement
of water into soil
Ocean storage
97% of total water
Aquifers: groundwater
storage areas
Percolation: downward
flow of water
Groundwater movement (slow)
66. The Demand
for Water
Hydroelectric power generation…
Humans intervene in the water cycle by
utilizing the resource for their own needs.
Water is used for consumption, municipal
use, in agriculture, in power generation,
and for industrial manufacturing.
Irrigation…
Industry is the greatest withdrawer of
water but some of this is returned.
Agriculture is the greatest water consumer.
Using water often results in its
contamination. The supply of potable
(drinkable) water is one of the most
pressing of the world’s problems.
Washing, drinking,bathing…
67.
68. Terms of Use
1. Biozone International retains copyright to the intellectual property included in this presentation file, with
acknowledgement that certain photos are used under license and are credited appropriately on the
next screen.
2. You MAY:
a. Use these slides for presentations in your classrooms using a data projector, interactive
whiteboard, and overhead projector.
b. Place these files on the school’s intranet (school computer network), but not in contradiction of
clause 3 (a) below.
c.
Edit and customize this file by adding, deleting, and modifying information to better suit your needs.
d. Place these presentation files on any computer within the school, including staff laptops.
e. Print out this file in PowerPoint “Handouts” format as per the print dialogue box, for the express
purpose of allowing students to make their own notes about the presentation.
3. You MAY NOT:
a. Put these presentation files onto the internet or on a service that may be accessed offsite from
the campus, unless access to the service is protected by a user login and password protocol.
b. Print these files onto paper to make your own worksheets for distribution to students.
c. Create a NEW document using any of the graphics/images in this presentation file.
d. Incorporate any part of this presentation file for the production of another commercial product.
e. REMOVE any of the references to Biozone, the copyright notices, photo credits, or terms of
use from this file.