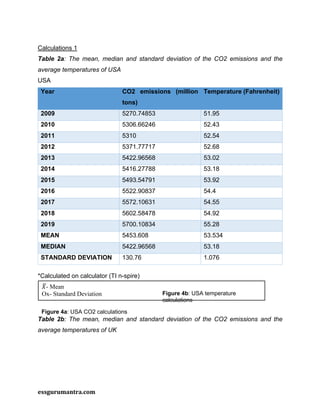
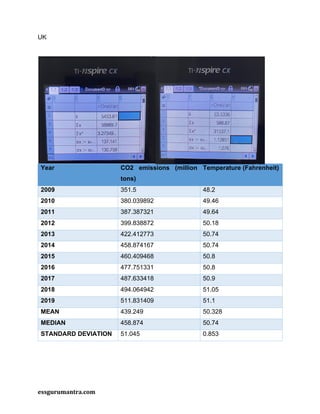
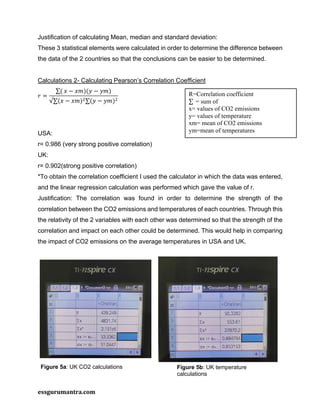
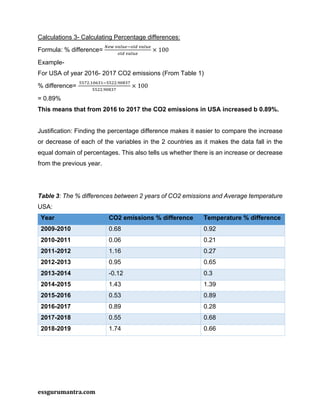
I am pleased to present an outstanding Sample ESS IA that secured an impressive 28 out of 30 marks, resulting in a remarkable 7-point score. This exemplar serves as a valuable reference and resource for your ESS class, offering comprehensive insights and invaluable guidance for both students and educators alike.
Key Points:
Exceptional Achievement: The IA achieved a remarkable 28 out of 30 marks, showcasing excellence in content, research, and presentation.
7-Point Performance: Scoring a perfect 7 points in the IA demonstrates a deep understanding of Environmental Systems and Societies.
Educational Resource: This exemplary IA serves as an educational resource, providing a model for structuring, researching, and presenting ESS projects.
Invaluable Insights: Reviewing this IA will offer invaluable insights into what constitutes a high-scoring ESS IA, helping students aim for excellence.
Guidance for Students: Students can utilize this IA as a reference to enhance their own IA projects, aiming for similarly outstanding results.
Educator's Tool: Educators can use this IA to exemplify quality work to their students, facilitating better understanding of assessment expectations.
We encourage you to make the most of this exemplary ESS IA as a guiding light in your pursuit of excellence in Environmental Systems and Societies studies.
1. Please refrain from copying any content directly from the material provided, as all the content
contained therein belongs to the essgurumantra website. Plagiarism is a serious matter and goes
against the principles of academic integrity and intellectual property rights.
It is crucial that you engage with the material in a responsible and ethical manner, using it as a valuable
resource for learning and reference, but ensuring that you create your own original work and properly
attribute any ideas or concepts you may draw from it. Respecting the source and adhering to copyright
regulations is of utmost importance.
Guru Charan Kumar
IB ESS & TOK Teacher
International Baccalaureate
Environmental Systems and Societies
Internal Assessment
Title:
To investigate the effect of carbon dioxide emissions on temperature in USA
and UK.
Research Question :
To what extent do different levels of CO2 concentration in USA v/s UK from
2009-2019 affect the average temperature?
Word Count: 2200
2. essgurumantra.com
Table of Contents
Sr. No. Table of Contents Page Number
1 Aim 2
2 Research Question 2
3 Introduction 2-3
4 Connections with Environmental Issue 3
5 Environmental Context 3-4
6 Background Information 4-5
7 Hypothesis 5
8 Scientific Justification 5-6
9 Independent Variable 6
10 Dependent Variables 6
11 Controlled Variables 7
12 List of Apparatus 7
13 Procedure 8
14 Sampling Strategy 8-9
15 Ethical Considerations 9
16 Risk Assessment 9
17 Data collection and raw data 10-11
18 Processing raw data 11-15
19 Discussion and presentation of processed data 16-18
20 Discussion in relation to RQ and environmental issue 18-19
21 Real Life situation 19-20
22 Evaluation and improvements 20-21
23 Conclusion 21-23
24 Applications 23-24
25 Bibliography 25-26
*All image citations in bibliography*
3. essgurumantra.com
Identifying the Context
AIM
The aim of this investigation is to determine the effect of carbon dioxide emissions on
temperature in USA and UK. Then, comparing the results of both the countries and
determine that how do the different levels of CO2 concentrations affect the temperature.
This will be conducted by investigating the relation between the CO2 emissions and
average temperature and then comparing the dependency of one factor over the other.
RESEARCH QUESTION
To what extent do the different levels of CO2 concentration in USA v/s UK from 2009-
2019 affect the average temperature?
Rationale behind choosing the Research question
I have selected this topic for my internal assessment because of the rising concern around
the world for increase temperature and global warming. I wanted to investigate in depth
about the role of CO2 emission which is a part of our day-to day on the average
temperature that they increase or decrease. The range of years from 2009-2019 is
selected particularly because since 2009 only there has been a significant discussion
globally about the CO2 emissions and its impacts and 2019 is the most recent year.
INTRODUCTION
For my Internal Assessment, I am going to conduct a secondary research through which
I will be able to derive the relevant data for the countries in consideration. The countries
that will be considered are USA and UK because they have different levels of the
consumption of CO2 emitting resources and their energy consumption also varies. I will
examine the CO2 emissions of the countries and the global temperature over the time
period of 10 years. Further, examining the effect of it on the trend of average temperature
of the particular countries.
4. essgurumantra.com
CONNECTIONS WITH ENVIRONMENTAL ISSUE
The issue of rising temperatures is affecting the world and one of the major factors is the
CO2 emissions due to which the CO2 concentration in the atmosphere rises hence,
causing greenhouse effect. This greenhouse effect further traps the UV radiation
decreasing the reflectivity and hence the temperature increases as there is warmer
atmosphere. The RQ encompasses this issue and hence, by answering this RQ the
reasons behind the increasing temperature will be revealed the results will show the
increase or decrease in temperature with the increase in the CO2 emissions, helping in
reaching a conclusion of the possible solutions to combat this issue and the applications
of it around the world.
ENVIRONMENTAL CONTEXT
Local
Changes in the average temperature of each of the countries has become a problem
because of the uninvited variations in weather and the unpredictable environmental
catastrophes. As I live in India so, the local impacts on the CO2 concentration variations
like the use of transportation by the local population, the daily electricity usage and uses
of appliances like refrigerators and air conditioners has caused the effects on the average
temperature making the national capital region of India one of the most polluted cities in
the world. Locally, the people are facing the problems of pollution which lead to health
problems like asthma, skin diseases, lung cancer, problems with senses especially eyes
etc. and this relates to UK and USA as well.
Global
The global contribution in the changes in average temperatures has been immense
because of the use of more coal and combustion of fuels in production and manufacturing.
This is a global problem as it is causing the ozone layer to deplete, glaciers and ice caps
to melt.
This makes changes in CO2 concentrations one of the major issues on the global and
local basis and the difference between the CO2 emissions of US and UK would give a
clearer picture of its effects on the average temperatures whether increasing or
decreasing and hence, the global contribution of it as a whole.
5. essgurumantra.com
BACKGROUND INFORMATION
USA is one of the most developed countries in the world and the average carbon footprint
per person in the US s 16 tons which is one of the highest rates in the world.1
US is a
country on North America and it is well known for its advancement in technology and
diversification of cultures. The US supports high standard of living for the people and the
energy consumption is also high along with the carbon
emitting sources of food. These factors make this
country a major carbon emitting country.
UK is one of the highly advanced countries in terms of
technology and it is also a developed country and the
average carbon footprint per person in UK is 8.34 tons per person.2
However, over the
recent years, UK has shifted to the use of more renewable sources of energy which emit
least amounts of carbon and also the use of smart technology an lower population has
facilitated this clause.
Carbon dioxide concentration is one of the major factors while considering pollution and
the effects on climate change. In the recent years, some
countries have highly used carbon emitting sources like coal
and petroleum while some countries have advanced in
technology and they have shifted to more renewable sources
of energy like solar panels and electric cars. However, the CO2
concentrations have contributed a lot on the global temperature
increase in the past years of the major development in the
industrial sector and hence, becoming a major cause of global
warming and negative impacts on the environment.
1
âWhat Is Your Carbon Footprint?â The Nature Conservancy, www.nature.org/en-us/get-involved/how-to-
help/carbon-footprint-calculator/#:~:text=The average carbon footprint for,is closer to 4 tons.
2
âAverage British Person Emits More CO2 in Two Weeks than Some People in Africa Do in a Year, Research
Shows.â The Independent, Independent Digital News and Media, 8 Jan. 2020,
www.independent.co.uk/environment/british-carbon-footprint-africa-emissions-oxfam-climate-change-
a9271861.html.
Figure 1: Map of USA
Figure 2: Map of UK
6. essgurumantra.com
HYPOTHESIS
The hypothesis of my research is that there is a correlation between the CO2
concentrations and the trends in the average temperature. There will be a difference in
the levels of CO2 concentrations of US and UK which will result in the different trends in
the average temperature. This is because the carbon emissions by each of the countries
is different and they have different effects on the CO2 concentrations. Furthermore, the
results will show the numeric difference which will describe the disparity between the
effects of the difference levels of CO2 concentrations.
The hypothesis clearly relates with the research question as the question demands the
impact of different CO2 levels on the average temperatures and hence, the different levels
of CO2 is considered by the comparison drawn between the trends of USA and UK and
the impact would be shown b tr increase or decrease in the average temperatures.
SCIENTIFIC JUSTIFICATION
This hypothesis has been derived after I came across a report by NASAâs Earth
Observatory, âEffects of Changing of Carbon Cycleâ3
which states that rise in carbon
dioxide concentrations are already causing the Earth to heat up. The average global
temperatures have risen to 0.8 degree Celsius. The carbon dioxide emissions account
for the earthâs 20% greenhouse gases which means that as the CO2 concentrations goes
up the earthâs temperature rises which cause more water to evaporate and hence,
greenhouse effect increases, negatively affecting the environment.
3
Effects of Changing of Carbon Cycle, NASA Earth's Observatory ,
earthobservatory.nasa.gov/features/CarbonCycle/page5.php#:~:text=Rising carbon dioxide concentrations are,1.4
degrees Fahrenheit) since 1880.
7. essgurumantra.com
Planning
VARIABLES
Variable What
variable?
Why dependent or
independent?
Justification
Independent CO2
concentration
This is independent
variable because the CO2
emissions will change
independently, and it
cannot be controlled or
determined because of the
level of use by the
countries.
Since, secondary
research will be
conducted, the changes in
the level of CO2
concentration of US and
UK will determine the
effects
Dependent Average
temperature
This is dependent
because this reacts
according to the changes
in the independent
variable.
The trends of average
temperature will depend
on the changes in the
CO2 concentration levels
and hence, the results of
this becomes dependent
on CO2 concentration
levels.
8. essgurumantra.com
Control variable Why is it controlled? How was it controlled?
Source of Data To ensure the credibility
and reliability of the results
gathered from the
mathematical reasoning
and the conclusions
derived for future
references.
Using credible sources like
World Data bank and
Statista.
Years of data collected The variables in
consideration can vary
overtime which can make
the results unreliable
hence, I have chosen
specific time period to
derive reliable results.
All the data was collected
within the year span of
2009-2019 i.e. 10 years
time period
LIST OF APPARATUS
Equipment Quantity Purpose
Laptop 1 To carry out the secondary
research
Notebook 1 To derive mathematical
findings and verify the
results
Internet To use the search engine in
order to collect
data/statistics from the
various websites.
Pen/pencil 1 To record the findings
9. essgurumantra.com
PROCEDURE
The investigation involved secondary sources because my internal Assessment involved
the exploration of data on the international basis and the countries chosen were of
different backgrounds and the locations were also different which would give desirable
conclusions.
1. The data was collected through online sources like world data bank and then
entered into the raw data table for the carbon dioxide emissions for US and UK
over the time period of 2009-2019.
2. Then the annual average temperaturesâ data was collected through online sources
like world data bank and Statista, and then was arranged in a tabular format for
the same time period to do the investigation.
3. Finding the mean, median and standard deviation of the CO2 emissions and the
average temperatures of the 2 countries
4. The correlation was calculated between the CO2 concentration and the average
temperature rate to understand the level of impact of CO2 concentration on the
temperature for the 2 countries.
5. The percentage increase or decrease over the years in the CO2 emissions and
average temperature was calculated and arranged in a table for each country.
6. Pie charts and bar graphs were made for each of the countriesâ calculations so
that there can be visual comparison of the data for easier conclusions.
7. Plotting the correlation through a scatter plot to see the distinctive differences
between the effect of the variables on one another in each country,
8. Finally, the results were compared, and meaningful conclusions were made to
check whether the hypothesis is proven right or wrong. The data was
standardized as the percentage change was found which made the data
comparable and also there were more than 10 sites used to derive the data
for validity of the data.
10. essgurumantra.com
SAMPLING STRATEGY
After understanding the research aim and designing the procedure, I chose to do self-
section sampling which gave me the freedom to choose the countries and the time period
so that all the factors are kept in mind and the sample is specific to the question
requirements.
The 2 countries chosen has a share in the mass carbon emissions in the world. US has
been found to emit 15% of the total and UK has been considered to emit 1% of the worldâs
total carbon emissions.4
This has been classified by the âUnion of Concerned scientistsâ
and this helps the countries chosen to give more reliable conclusions to my research.
Justification:
The time chosen is of 10 years so that the data is reliable with the varying trends which
could occur because of new governmental policies or new technological advancements.
Self-selection sampling is a type of non-probability sampling5
that follows qualitative
sampling and because the RQ requires to examine the data for the specific countries it is
a helpful sampling method because the research design is unique and does not relate to
any other research paper.
ETHICAL CONSIDERATIONS
Secondary research, being the basis for my investigation, brought a lot of ethical issues
along with it as the data derived is already published by someone on global platforms.
So, keeping the ethical morals in mind, I made it a pact to ensure and cite each of the
sites used in MLA format. This will help me to reveal the credibility of the publisher and
the website which incorporates the relevant data and information.
Furthermore, while drawing conclusions about the investigation conducted and results
obtained, I will ensure to take the other factors in consideration so that the evaluation is
not bias and there are no problems or establishing a reliable report.
4
âEach Countrys Share of CO2 Emissions.â Union of Concerned Scientists, www.ucsusa.org/resources/each-
countrys-share-co2-emissions.
5
âNon-Probability Sampling: LĂŠrd Dissertation.â Non-Probability Sampling | LĂŠrd Dissertation,
dissertation.laerd.com/non-probability-sampling.php.
11. essgurumantra.com
RISK ASSESSMENT
There is a risk of copying direct information from online which would lead to academic
dishonesty so to avoid it I will be adding in-text citations wherever I have taken direct
reference from the online sources to ensure that there is no risk of plagiarism.
Results, analysis and conclusion
DATA COLLECTION
The data was collected through secondary sources. The sites used were World Data and
Statista for finding the CO2 emissions in UK and USA and the average daily temperatures
for the 2 countries, respectively.
RAW DATA
Table 1: CO2 emissions and Temperature through 2009-2019 of USA and UK
*No uncertainties were given
USA:
Year CO2 emissions (million
tons)
Temperature (Fahrenheit)
2009 5270.74853 51.95
2010 5306.66246 52.54
2011 5310 52.54
2012 5371.77717 52.68
2013 5422.96568 53.02
2014 5416.27788 53.18
2015 5493.54791 53.92
2016 5522.90837 54.4
2017 5572.10631 54.55
2018 5602.58478 54.92
2019 5700.10834 55.28
12. essgurumantra.com
UK
Year CO2 emissions (million
tons)
Temperature (Fahrenheit)
2009 351.5 48.2
2010 379.039892 49.46
2011 387.387321 49.64
2012 399.838872 50.18
2013 422.412773 50.54
2014 438.874167 50.74
2015 469.609468 50.9
2016 477.751331 51.28
2017 487.633418 51.38
2018 494.064942 51.76
2019 511.831409 52.32
PROCESSING RAW DATA
The data was processed with the use of various calculations like mean, median, standard
deviation and Pearsonâs correlation coefficient. This would help in drawing meaningful
comparisons and conclusions of the investigation and hence, in the proving of hypothesis.
13. essgurumantra.com
Calculations 1
Table 2a: The mean, median and standard deviation of the CO2 emissions and the
average temperatures of USA
USA
Year CO2 emissions (million
tons)
Temperature (Fahrenheit)
2009 5270.74853 51.95
2010 5306.66246 52.43
2011 5310 52.54
2012 5371.77717 52.68
2013 5422.96568 53.02
2014 5416.27788 53.18
2015 5493.54791 53.92
2016 5522.90837 54.4
2017 5572.10631 54.55
2018 5602.58478 54.92
2019 5700.10834 55.28
MEAN 5453.608 53.534
MEDIAN 5422.96568 53.18
STANDARD DEVIATION 130.76 1.076
*Calculated on calculator (TI n-spire)
Table 2b: The mean, median and standard deviation of the CO2 emissions and the
average temperatures of UK
đ
"- Mean
Ox- Standard Deviation
Figure 4a: USA CO2 calculations
Figure 4b: USA temperature
calculations
14. essgurumantra.com
UK
Year CO2 emissions (million
tons)
Temperature (Fahrenheit)
2009 351.5 48.2
2010 380.039892 49.46
2011 387.387321 49.64
2012 399.838872 50.18
2013 422.412773 50.74
2014 458.874167 50.74
2015 460.409468 50.8
2016 477.751331 50.8
2017 487.633418 50.9
2018 494.064942 51.05
2019 511.831409 51.1
MEAN 439.249 50.328
MEDIAN 458.874 50.74
STANDARD DEVIATION 51.045 0.853
15. essgurumantra.com
Justification of calculating Mean, median and standard deviation:
These 3 statistical elements were calculated in order to determine the difference between
the data of the 2 countries so that the conclusions can be easier to be determined.
Calculations 2- Calculating Pearsonâs Correlation Coefficient
đ =
â( đ„ â đ„đ)(đŠ â đŠđ)
ââ(đ„ â đ„đ)!â(đŠ â đŠđ)!
USA:
r= 0.986 (very strong positive correlation)
UK:
r= 0.902(strong positive correlation)
*To obtain the correlation coefficient I used the calculator in which the data was entered,
and the linear regression calculation was performed which gave the value of r.
Justification: The correlation was found in order to determine the strength of the
correlation between the CO2 emissions and temperatures of each countries. Through this
the relativity of the 2 variables with each other was determined so that the strength of the
correlation and impact on each other could be determined. This would help in comparing
the impact of CO2 emissions on the average temperatures in USA and UK.
R=Correlation coefficient
â = sum of
x= values of CO2 emissions
y= values of temperature
xm= mean of CO2 emissions
ym=mean of temperatures
Figure 5a: UK CO2 calculations Figure 5b: UK temperature
calculations
16. essgurumantra.com
Calculations 3- Calculating Percentage differences:
Formula: % difference=
"#$ &'()#*+(, &'()#
+(, &'()#
Ă 100
Example-
For USA of year 2016- 2017 CO2 emissions (From Table 1)
% difference=
--.!.01230*--!!.4153.
--!!.4153.
Ă 100
= 0.89%
This means that from 2016 to 2017 the CO2 emissions in USA increased b 0.89%.
Justification: Finding the percentage difference makes it easier to compare the increase
or decrease of each of the variables in the 2 countries as it makes the data fall in the
equal domain of percentages. This also tells us whether there is an increase or decrease
from the previous year.
Table 3: The % differences between 2 years of CO2 emissions and Average temperature
USA:
Year CO2 emissions % difference Temperature % difference
2009-2010 0.68 0.92
2010-2011 0.06 0.21
2011-2012 1.16 0.27
2012-2013 0.95 0.65
2013-2014 -0.12 0.3
2014-2015 1.43 1.39
2015-2016 0.53 0.89
2016-2017 0.89 0.28
2017-2018 0.55 0.68
2018-2019 1.74 0.66
19. essgurumantra.com
Graph 1b- Temperature changes represented through raw data
Graph 2 illustrates the means calculated
Graph 3 illustrates the standard deviation of the data
Graph 1a and1b shows the comparison by sight between the trends of the 2 countries.
It shows that in USA there are more CO2 emissions than in UK and the average
temperature in USA is also higher.
Series 1-USA
Series 2-UK
20. essgurumantra.com
Graph 4- Percentage difference of CO2 emissions and temperature in both the countries.
In Graph 4 difference for USA is illustrated and from that it can be seen that there is very
less difference, and the trend does not vary by a lot except the years from 2013 to 2014
where there was a decrease in the CO2 emissions. On the right side the % change for
UK is illustrated where we can see high spike in the CO2 emissions between 2009 and
2014. After 2014 there is less % increase over the years.
Series 1- CO2 emissions
difference
Series 2-Temperature difference
21. essgurumantra.com
Discussion
In context of research question
The investigation based on the impact of different concentrations of CO2 levels on the
average temperature suggests that there is a positive relationship between the variables
as can be deducted from the data collected for USA and UK. The data was expected to
show a correlation and the data met the expectation as it showed strong positive
correlation meaning that as the CO2 emissions rise the average temperatures also rise
and, hence increasing the global temperature
In context to the environmental issue
According to the local and global implications on the environment, it was mentioned that
in the countries investigated there is an increase in health problems and globally there is
depletion of ozone layer as a result of global warming. This has been shown by the results
as the CO2 emissions increase in both the countries from 2009-2019, there is also a
significant rise in the average annual temperatures of both the countries which contributes
to the global temperature increase and hence global warming, This results in melting of
glaciers, hotter weathers, inconsistent rainfall trends, desertification and increased health
problems like asthma, lung cancer, skin diseases etc. The calculations prove that there
is more CO2 concentration in the atmosphere causing more greenhouse gases which
further traps the UV radiation altogether causing earth to heat up.
Patterns and trends in data
The graphs show a similar trend that as CO2 emissions increase the average temperature
increases. The CO2 is the independent variable which affects the temperature, and this
has been proven by the correlation coefficient which shows a strong positive correlation
between both the variables.
The % difference bar graph (graph 4) shows the standardized comparisons which
suggests that there is a fairly steady increase in USA whereas there is varying increases
in the UK.
The percentage increase rages from 0.68-1.74% of CO2 emissions in the USA whereas
in the UK it varies between 0.33-8.12% which is a very great difference suggesting that
22. essgurumantra.com
the CO2 levels differ f both the countries but the effect on temperatures are fairly similar
as in the US it varies from 0.3-1.4% and in the UK it varies from 0-2.6% which is not very
different to each other.
Further, the correlation coefficient retaliates the argument that there is a positive linear
relationship. There is a higher correlation coefficient which suggests that the data is
positively and strongly skewed and that there are not a lot of changes. But, for UK it
suggests a comparatively lower value which has positively skewed data but a fairly strong
relation only. Thus, this becomes the evidence to the hypothesis that there is a difference
between the impact and relation of the CO2 emissions on the temperatures of USA v/s
UK.
Real life situation
In India, there has been a race to see prosperous days and I light of this there has been
greater use of energy sources which releases a lot of pollutants and mostly carbon
dioxide.6
Cities like New Delhi, Gurgaon and Noida are industrial and business hubs
because of which there are a lot of vehicles, factories and offices using air conditioners
which cause a lot of CO2 to be emitted.
India itself, being small in land area is the 3rd
largest contributor globally of the highest
CO2 emissions. These emissions are rising rapidly and till date it has increased by
average of 1.8% and the temperatures on an average has
increased by 2 degree Celsius. This has made India a large
contributor to global temperature increase which has led to the
melting of glaciers and hotter temperatures. This trend of the
positive relationship as shown in the investigation can be seen
in India as well and hence the contribution globally.
6
Slater, Joanna. âCan India Chart a Low-Carbon Future? The World Might Depend on It.â The Washington Post,
WP Company, 12 June 2020, www.washingtonpost.com/climate-solutions/2020/06/12/india-emissions-
climate/?arc404=true.
Figure 7: Map of India
23. essgurumantra.com
Evaluation and improvements
Weaknesses/Limitations Impact Improvements
The land areas of the
countries were not taken
into consideration
The CO2 emissions being
largely different in numbers
and hence, the results
might not be accurate.
In future, I intend to take
this in consideration and
choose countries with
similar land area so that the
research becomes reliable.
The number of countries
compared were not enough
The impact of CO2 levels
globally determined can be
limited nod not reliable.
Choosing more countries
and comparing data to
conclude for global
variations accurately.
Only the percentage
difference was determined
and further the average
percentage difference was
not found
The comparison for the
average or mean trends is
not in depth
Calculate the average %
increase for the variables to
compare extensively for the
averages.
The research depends on
the statistics provided by
one secondary online
resource only.
The results might be very
different to the statistics
provided on other sources
there might be different
data provided for the same.
In the beginning of the data
obtaining the error of the
considered data should
have been calculated by
taking data form a different
source as well.
Only one correlation
statistic test was conducted
and calculated
The results obtained might
be biased and could give
inaccurate details
Using different statistical
tests like spearmanâs
correlation coefficient and
chi square test so that the
conclusion can be drawn
from the average
correlation.
24. essgurumantra.com
Modifications and Alternatives
After the evaluation, I was able to deduce that I could also use other method to approach
my investigation like instead of using Pearsonâs correlation coefficient I could use Chi
Square test of independence which would help in determining the dependency of CO2
emissions and temperature rise on each other. Further, more factors could be determined
like natural disasters or pandemic in order to get more valid conclusions.
Further Areas of Research :
Alternatively, for this investigation I could also look at the different factors which affects
the average temperatures like the population growth. Also, any other natural disaster
could be looked at which would lead to a decrease in the CO2 emission and hence,
affecting the increase or decrease in the temperature
Conclusion
The aim of this investigation to find whether there is a correlation between the CO2 levels
and average temperatures which varied between USA and UK. In order to achieve this
aim, the Pearsonâs correlation coefficient was calculated through which it was inferred
that there is a strong positive correlation between CO2 and temperature which suggests
the high impact of CO2 emissions on the rising global temperatures. Hence, the
hypothesis has been supported by the results of the investigation of the data as the
correlation of the variables in the US is 0.986 and of UK it is 0.902 which are strong
positive correlations, also there is a difference between the correlation of USA and UK
suggesting the different impacts.
Altogether, the standard deviation, mean, correlation coefficient and all the graphs
aid the proving of the hypothesis. The different CO2 concentrations of UK and USA
shows the different impacts on the temperature as the standard deviation differ for each
set of data stating that there are different effects of CO2 on the temperature. Hence, the
research question is answered that the different levels of CO2 concentration effect the
average temperature of UK and USA.
25. essgurumantra.com
These countries being a major part of the world economy, have a major impact on the
environment because g the issue of global warming because of entrapment of sunlight
sue to greenhouse gases also causing depletion of ozone layer. This causes the average
temperature to increase and hence, this investigation clearly matches the conclusion
drawn because of the data satisfying the hypothesis.
Evaluation of Conclusion:
The investigation proves the hypothesis clearly of the CO2 emissions effecting the
average temperature of UK and USA, meaning that there is a positive correlation and
hence, this investigation can be used in future to predict this positive correlation to persist.
However, this investigation is limited to CO2 emissions and also it does not clearly bring
out the dependence of the rise in temperature on the CO2 emissions. Therefore, the
correlation shows a very small portion of the contribution to the temperature increase over
the years.
Conclusion in relation to the Environmental Issue:
The result of the investigation showing a positive correlation in the rise on CO2 emissions
and the rise in temperature clearly states that the environmental issue is to be addressed
by UK and USA and hence, this correlation means that there is a rise in the greenhouse
gases as well causing the climate to rise and therefore resulting in the inconsistencies in
the weather.
26. essgurumantra.com
Published Sources
According to my hypothesis, the data collected suggests that there is strong correlation
between the variables and that there is a difference between US and UK trends which
leads to global contributions and the negative impacts on the environment. Hence, the
report by New York times7
on the negative impacts of increase in CO2 emissions comes
into consideration. The report, âHow Much Will the Planet Warm if Carbon Dioxide Levels
Double?â suggests that in future according to present trends there will be CO2 emissions
doubled and hence the temperatures will increase greatly, the ozone layer will be
depleted largely, glaciers will melt and the ecosystems will be damaged.
Henceforth, the results found in this report match with the New York times scientific article
as can be seen in graph 4, there is a linear trend shown which suggests for the CO2
levels to increase and hence, increase the average temperatures further.
Applications
Possible Solutions to environmental issue
The investigation explores the effect of CO2 levels on average temperature which has
global implications. The contribution of the CO2 emissions by each country leads to global
increase of temperature and international organizations like the United Nation
Environmental program and intergovernmental panel on climate change have taken many
actions and released agreements of cooperation by countries to manage carbon emission
yet it has failed. The most effective way would be to make people aware and taking a step
towards the use of renewable resources like wind energy, thermal energy, solar power
etc. instead of using coal and petroleum which emit high levels of CO2.
7
Schwartz, John. âHow Much Will the Planet Warm If Carbon Dioxide Levels Double?â The New York Times, The
New York Times, 22 July 2020, www.nytimes.com/2020/07/22/climate/global-warming-temperature-range.html.
27. essgurumantra.com
Evaluation of the solution
Making people aware through campaigns and media will lead in people being attentive
towards the environmental activities and hence, taking care of the environment. However,
this would be very time consuming, but the international organizations can collaborate
with local organizations and have a widespread network to reach to as many people as
possible.
Using alternative sources of energy will lead to the decrease in CO2 emissions and hence
the temperature would also slow down to increase, and the environment will start to heal,
and this method is also sustainable to be used. But, the drawback to this is that it is a very
expensive method and only the MEDC countries will be able to do this and the LEDC
country would not be able to do it. For this financial aid can be given by the government
and also the international organizations can play the vital role.
28. essgurumantra.com
Bibliography
Articles
âAverage British Person Emits More CO2 in Two Weeks than Some People in Africa Do in a Year,
Research Shows.â The Independent, Independent Digital News and Media, 8 Jan. 2020,
www.independent.co.uk/environment/british-carbon-footprint-africa-emissions-oxfam-
climate-change-a9271861.html.
Effects of Changing of Carbon Cycle, NASA Earth's Observatory ,
earthobservatory.nasa.gov/features/CarbonCycle/page5.php#:~:text=Rising carbon dioxide
concentrations are,1.4 degrees Fahrenheit) since 1880.
Schwartz, John. âHow Much Will the Planet Warm If Carbon Dioxide Levels Double?â The New
York Times, The New York Times, 22 July 2020, www.nytimes.com/2020/07/22/climate/global-
warming-temperature-range.html.
Slater, Joanna. âCan India Chart a Low-Carbon Future? The World Might Depend on It.â The
Washington Post, WP Company, 12 June 2020, www.washingtonpost.com/climate-
solutions/2020/06/12/india-emissions-climate/?arc404=true.
Ted Talk
Scrivener, Karen. âA Concrete Idea to Reduce Carbon Emissions.â TED,
www.ted.com/talks/karen_scrivener_a_concrete_idea_to_reduce_carbon_emissions.
Data Banks
âEach Countrys Share of CO2 Emissions.â Union of Concerned Scientists,
www.ucsusa.org/resources/each-countrys-share-co2-emissions.
âWhat Is Your Carbon Footprint?â The Nature Conservancy, www.nature.org/en-us/get-
involved/how-to-help/carbon-footprint-calculator/#:~:text=The average carbon footprint for,is
closer to 4 tons.
Foster, Vivien, et al. âWorld Bank Open Data.â Data, 11 Nov. 2020, data.worldbank.org/.
Our World in Data, ourworldindata.org/.
29. essgurumantra.com
Graph making
âGraphing Calculator.â Desmos, www.desmos.com/calculator.
Images
âUnited Kingdom Map - England, Scotland, Northern Ireland, Wales.â Geology,
geology.com/world/united-kingdom-satellite-image.shtml.
âUnited States Map and Satellite Image.â Geology, geology.com/world/the-united-states-of-
america-satellite-image.shtml.
Brooks, Raillan, and September-October 2014 Disponsible en español. â9 New Ideas to Cut
Carbon Emissions.â Audubon, 9 May 2016, www.audubon.org/magazine/september-october-
2014/9-new-ideas-cut-carbon-emissions.
Carbon Footprint,
www.avangrid.com/wps/portal/avangrid/sustainability/environment/CarbonFootprints.
Guy, Infographics. âShocking CO2 Emissions Infographic.â Infographics Showcase, 2 Feb. 2019,
www.infographicsshowcase.com/shocking-co2-emissions-infographic/.