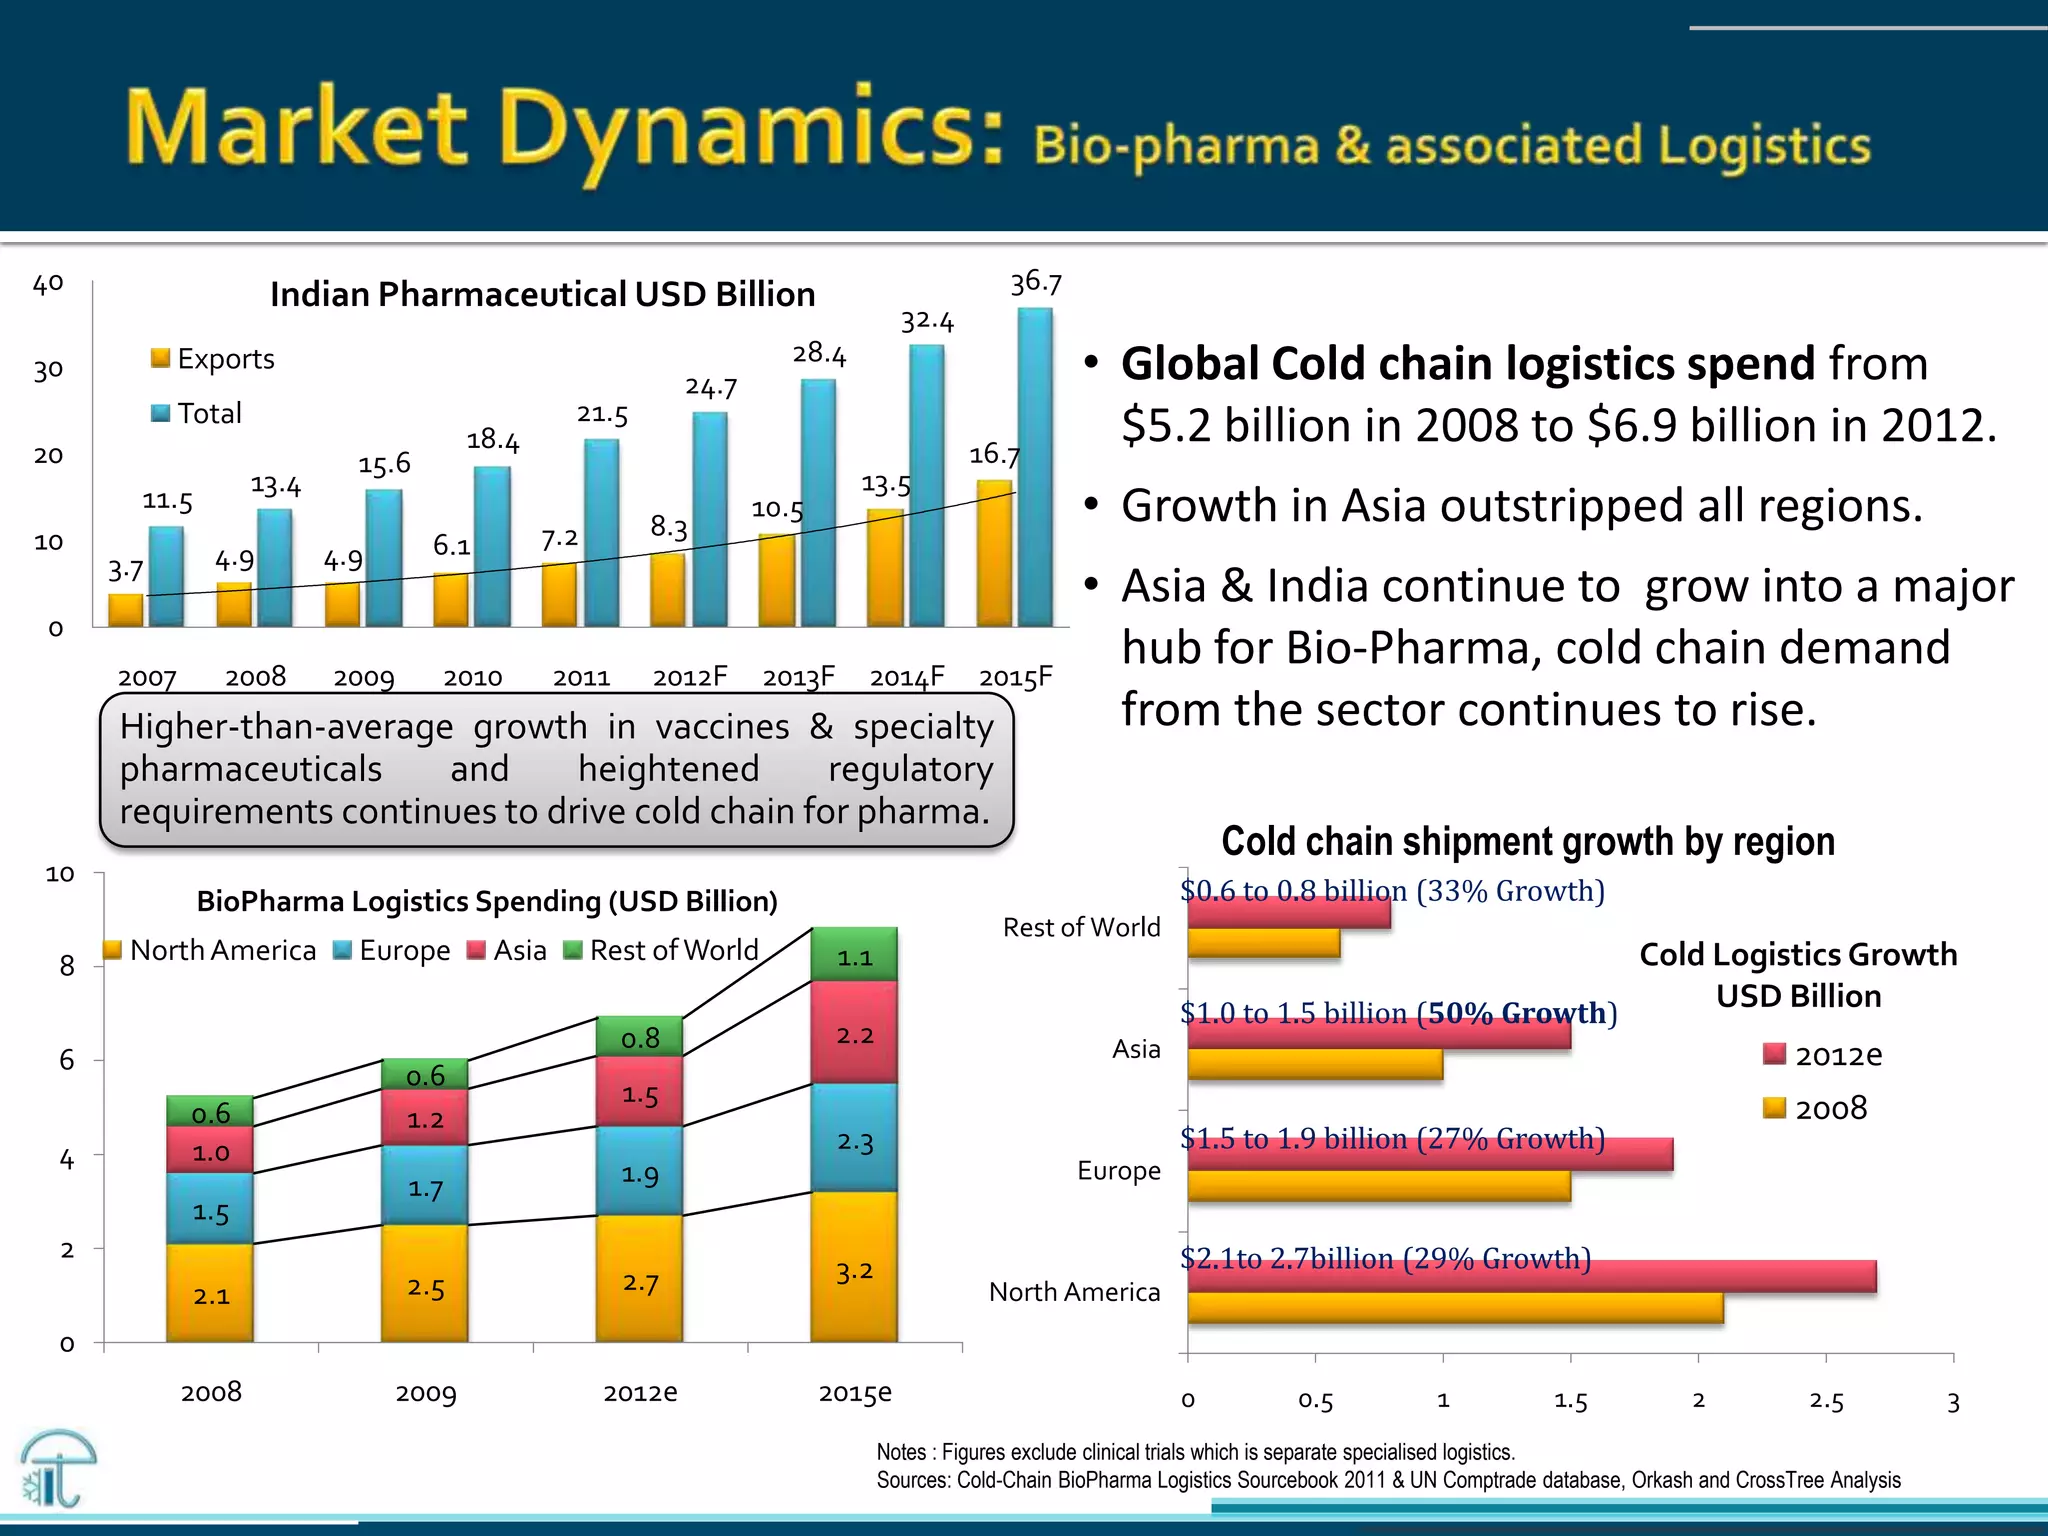
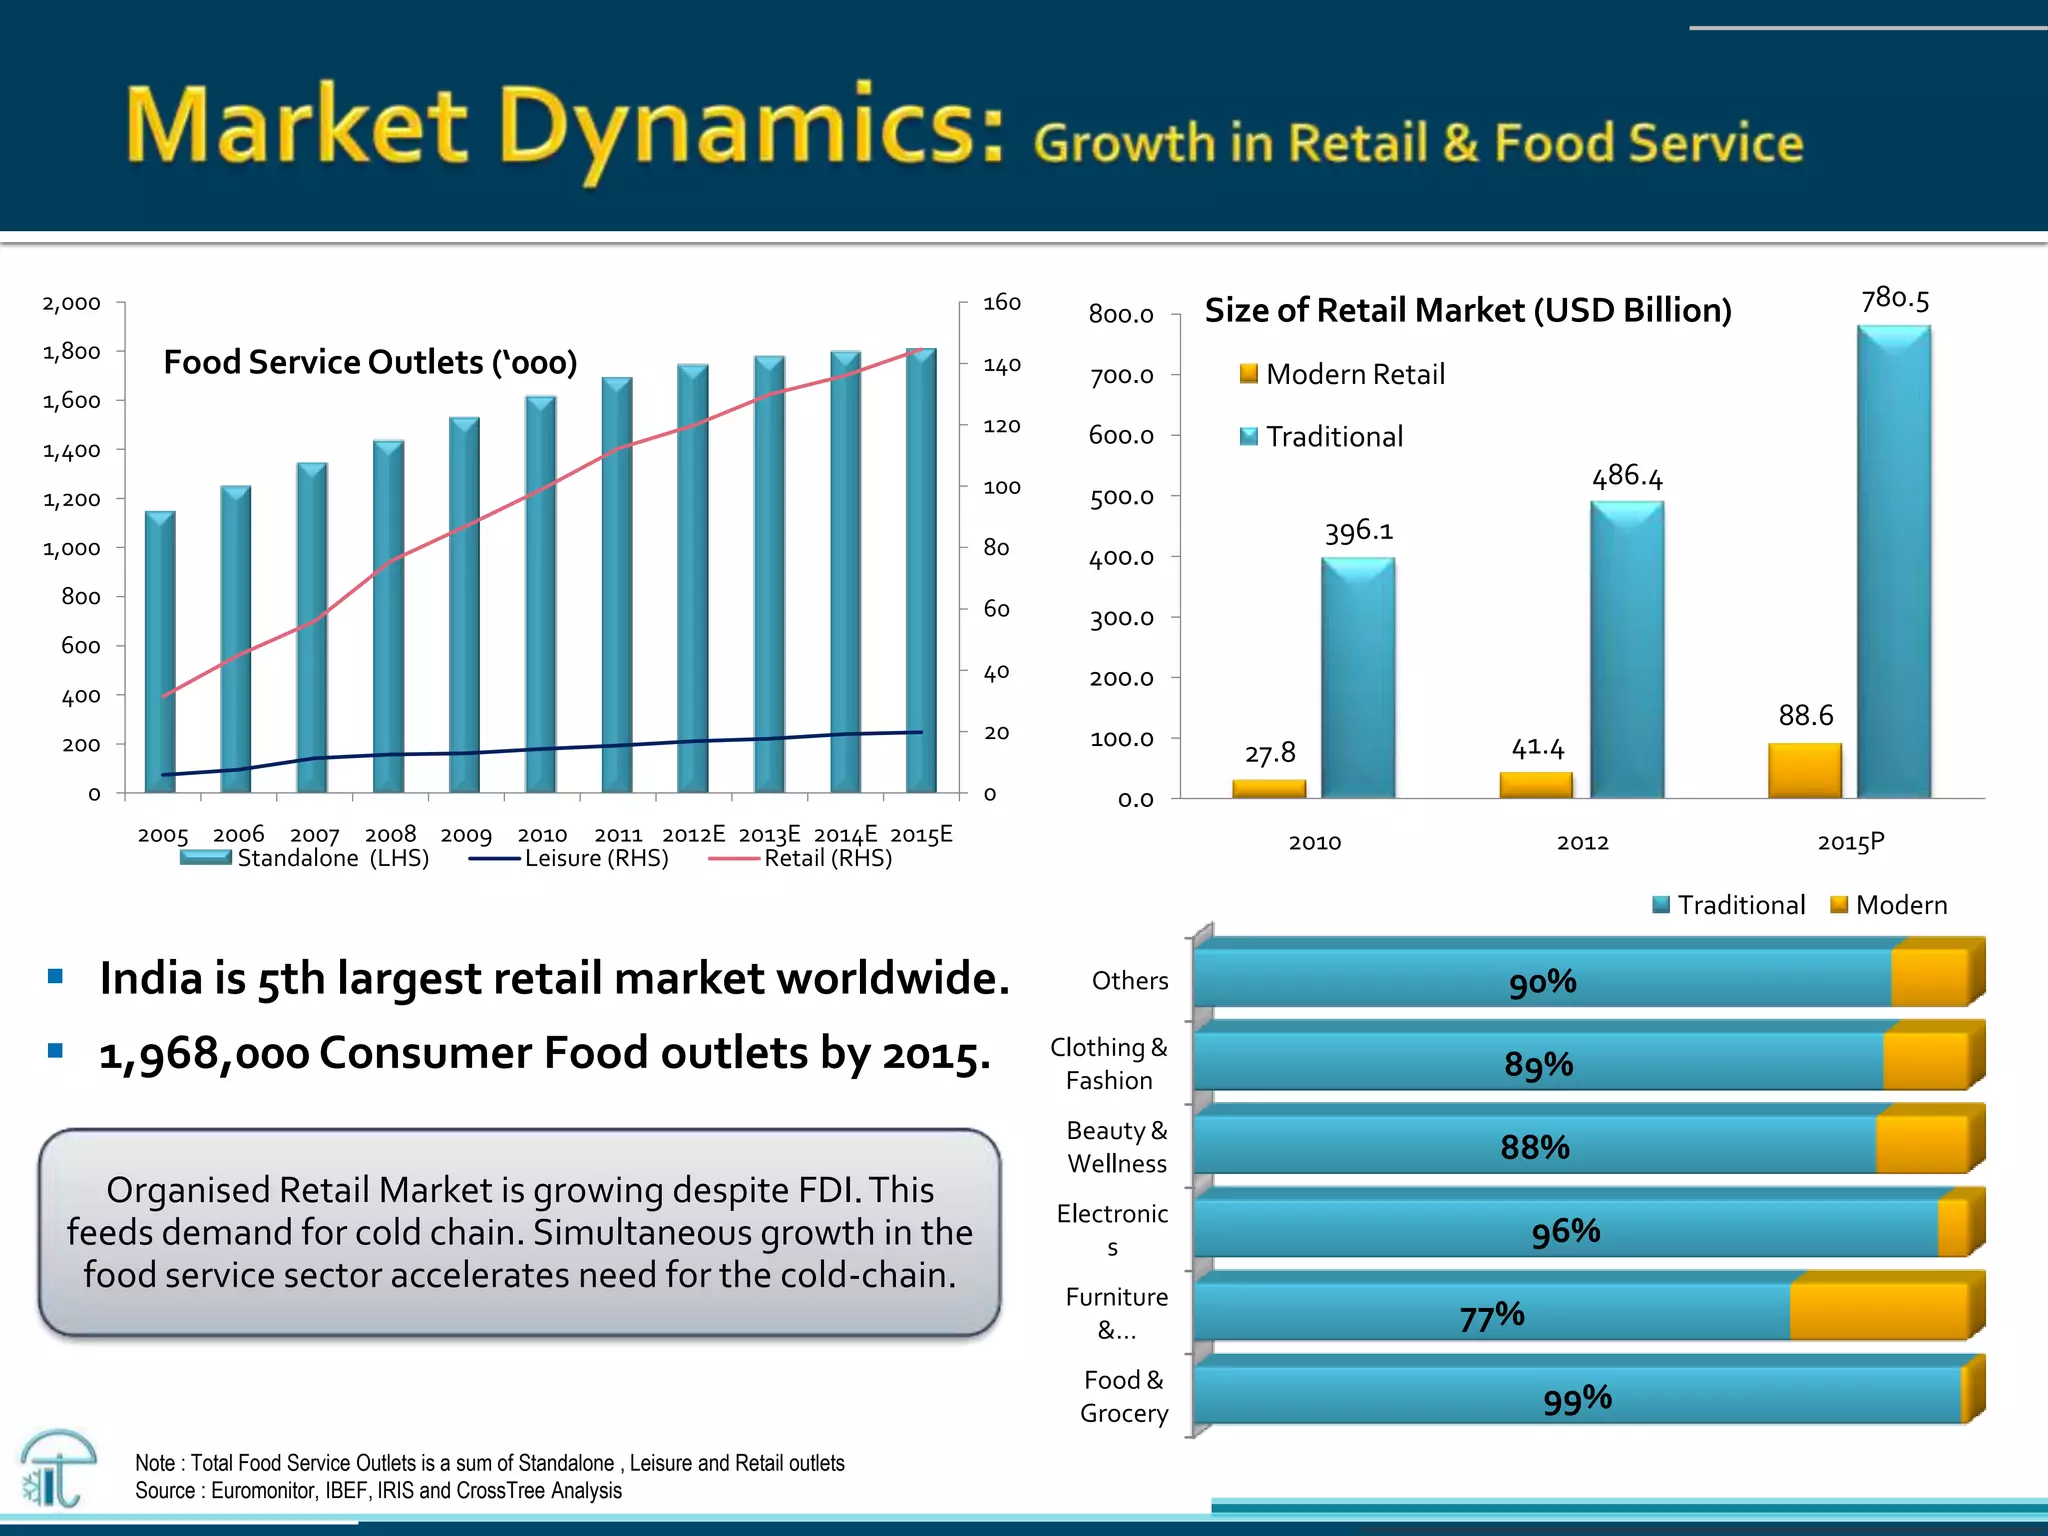
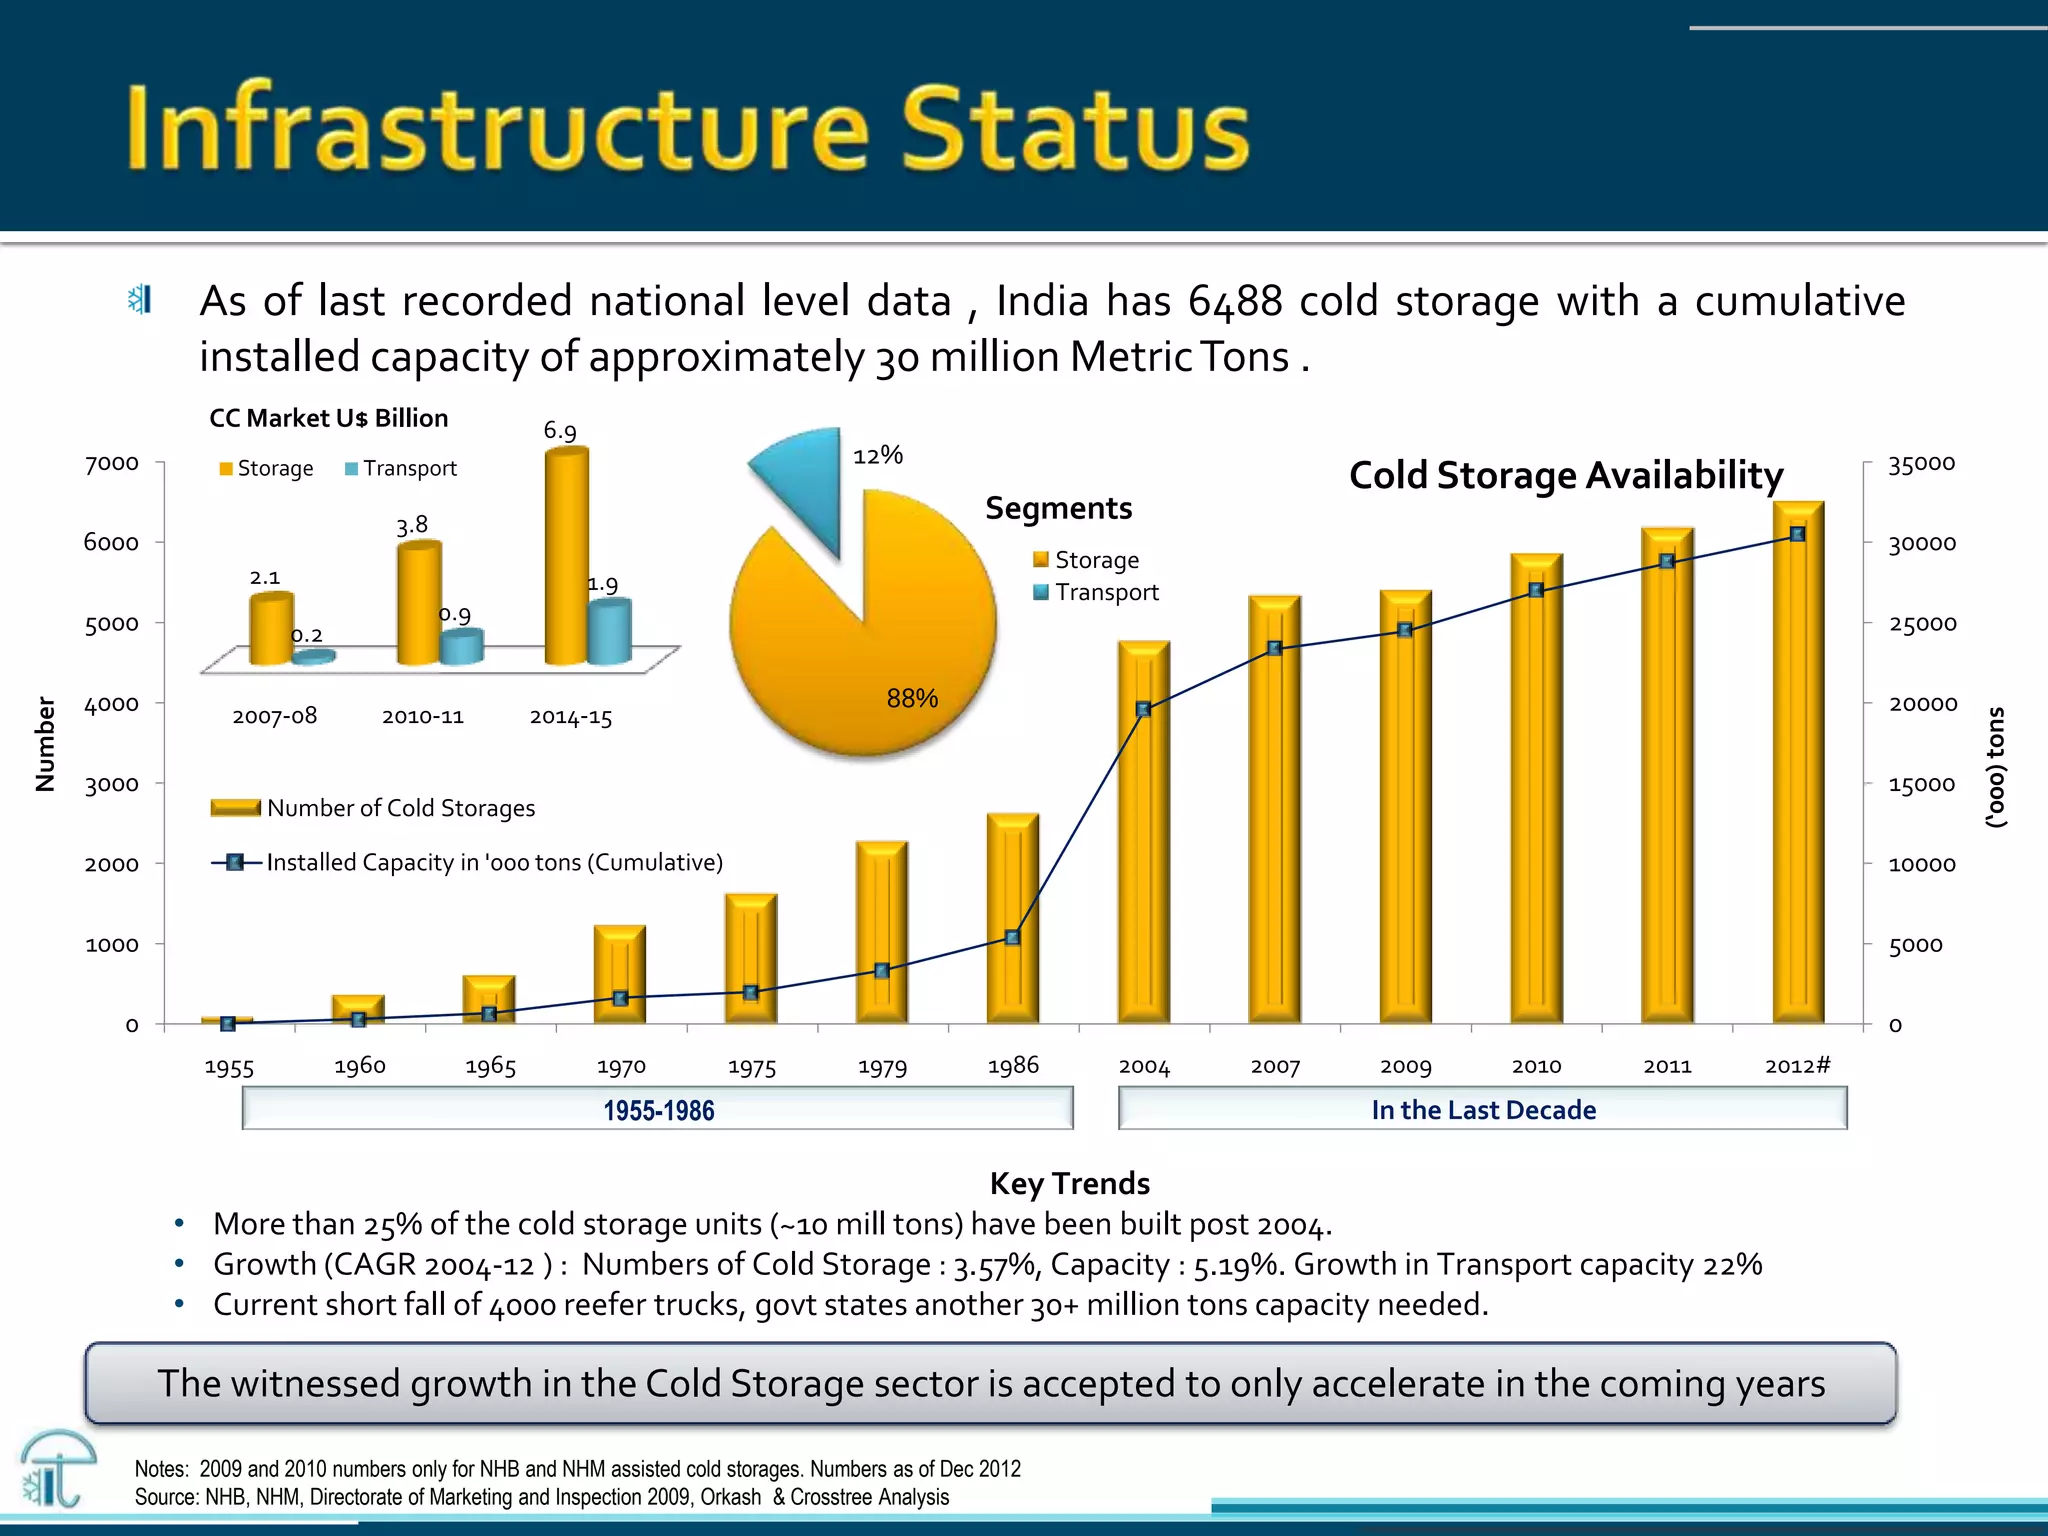
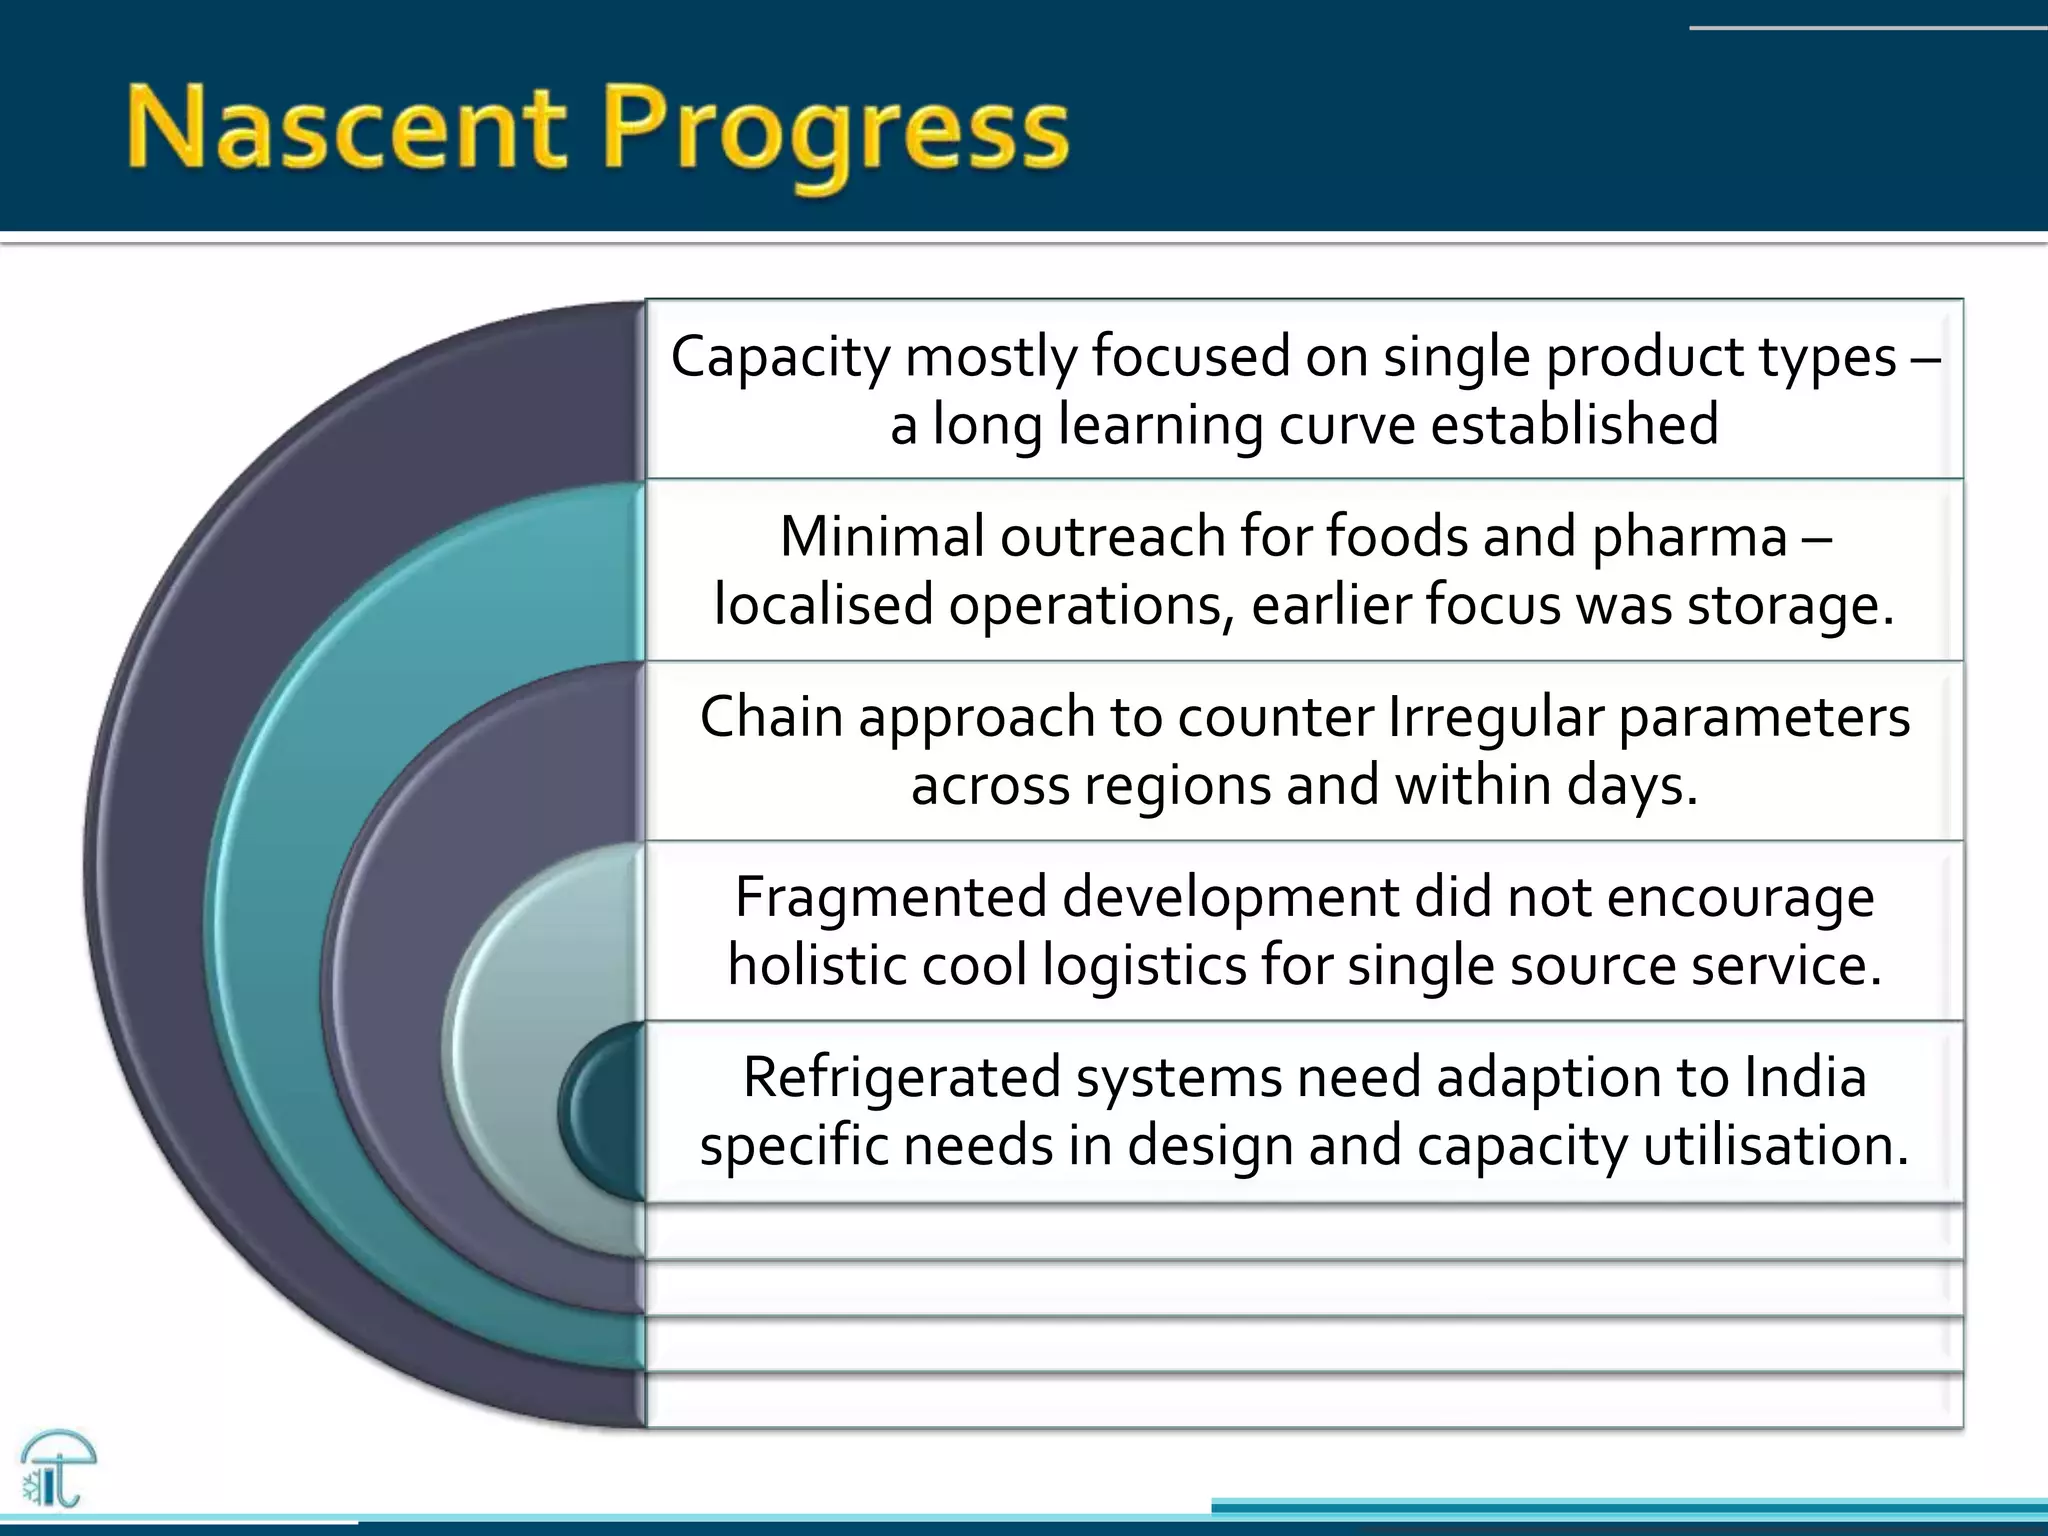
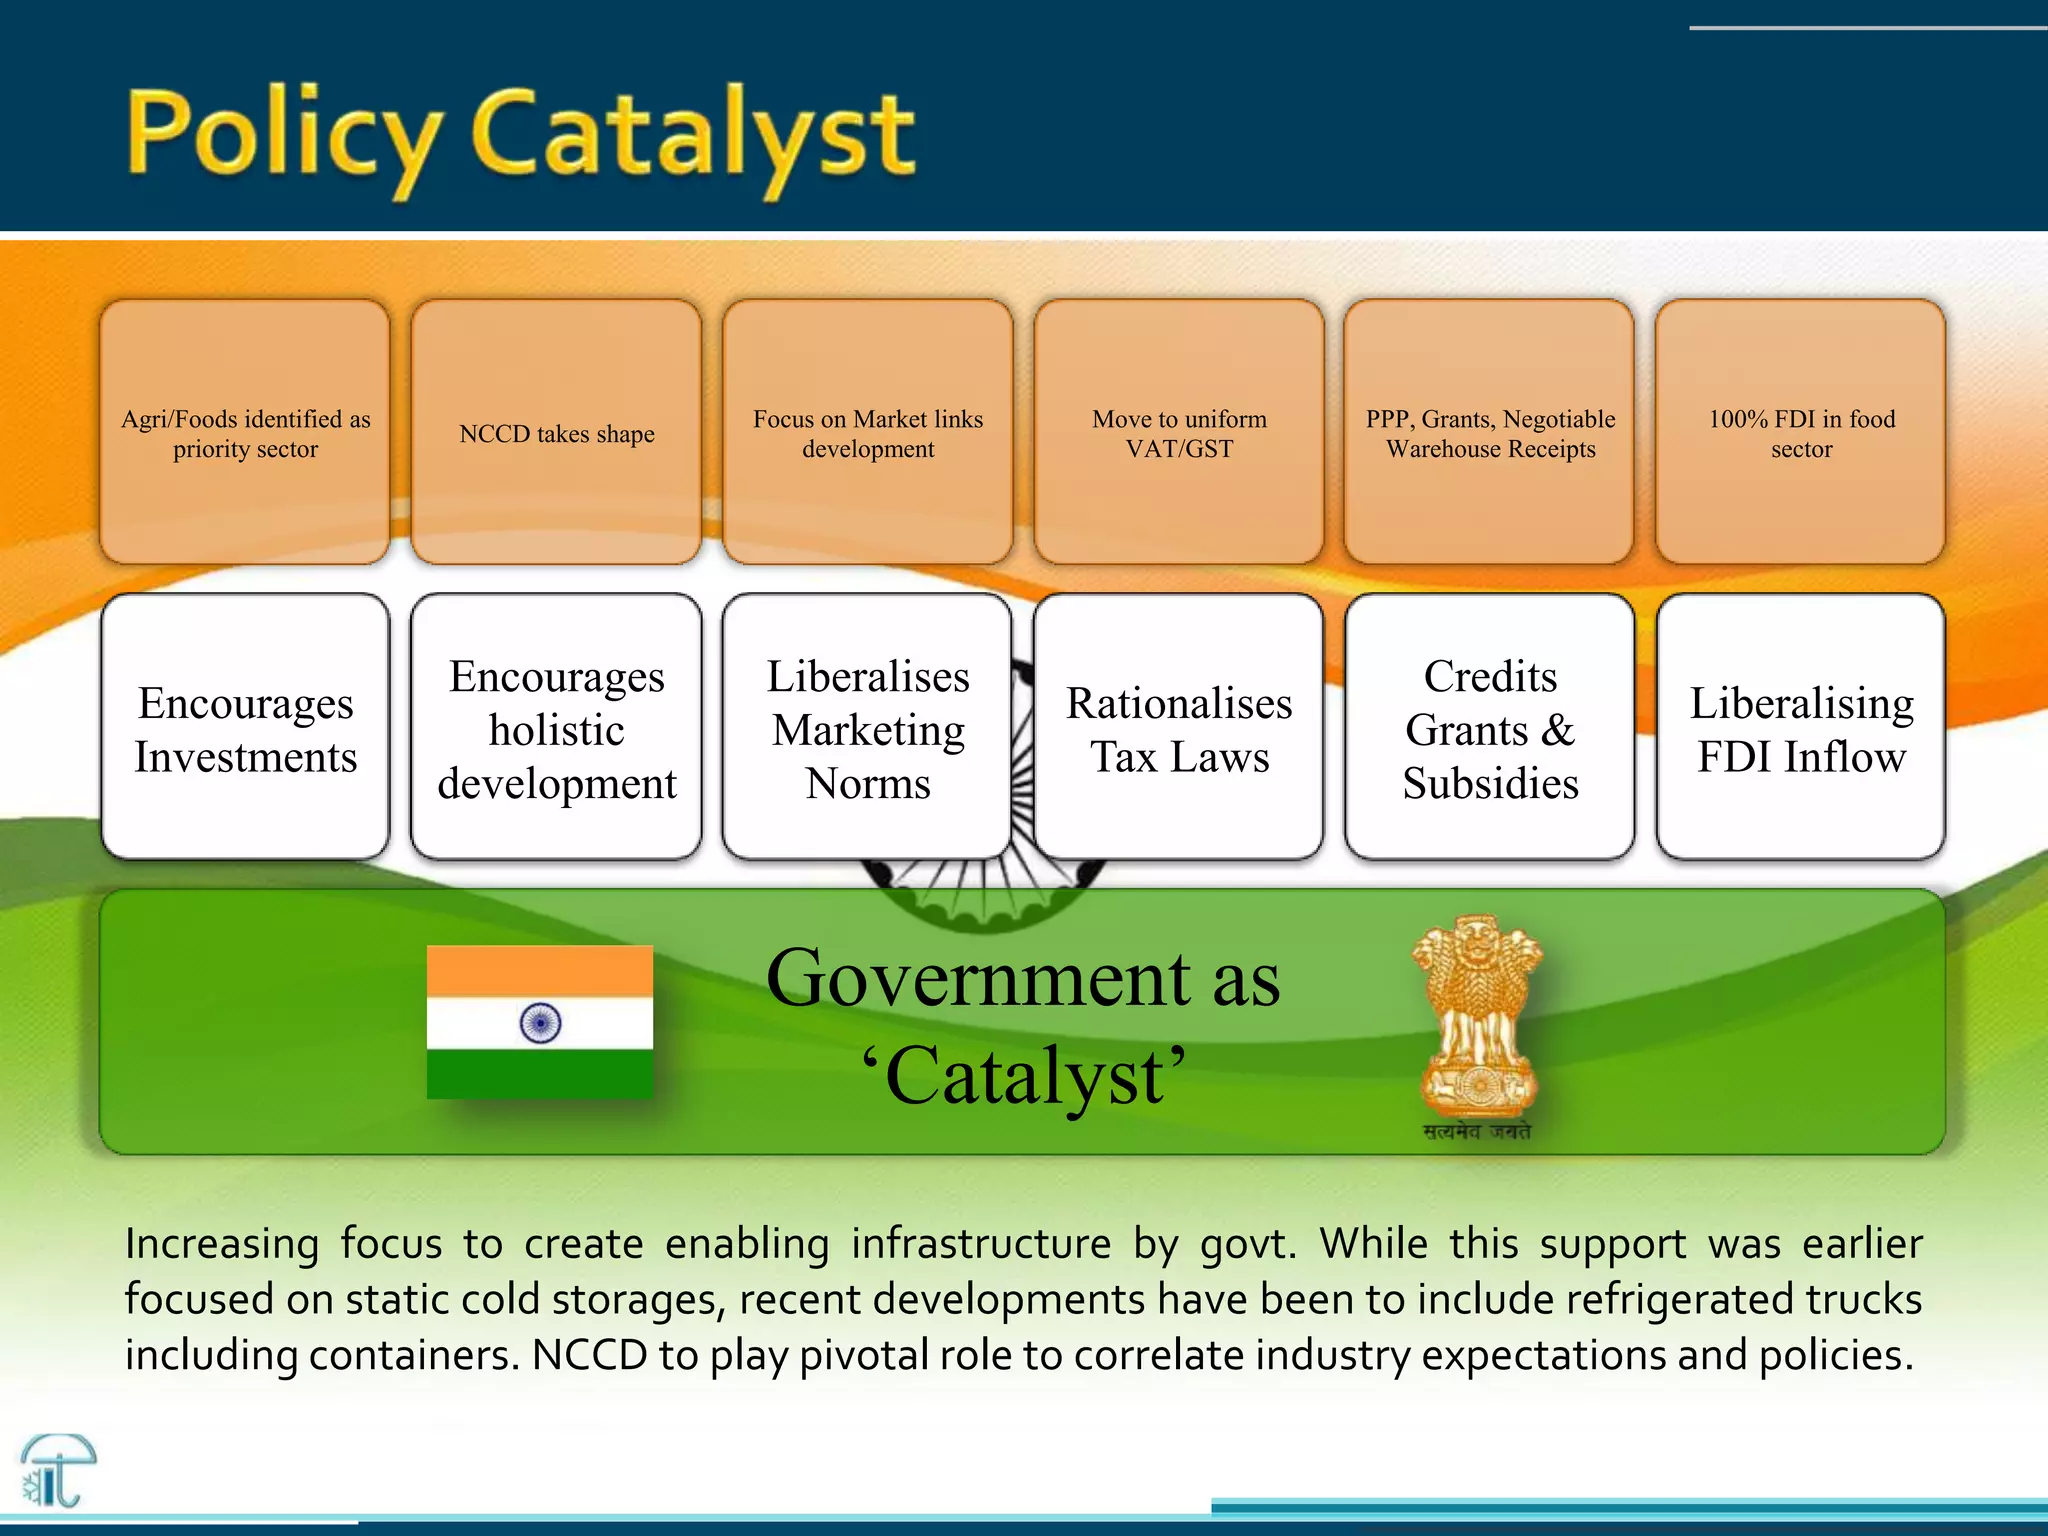
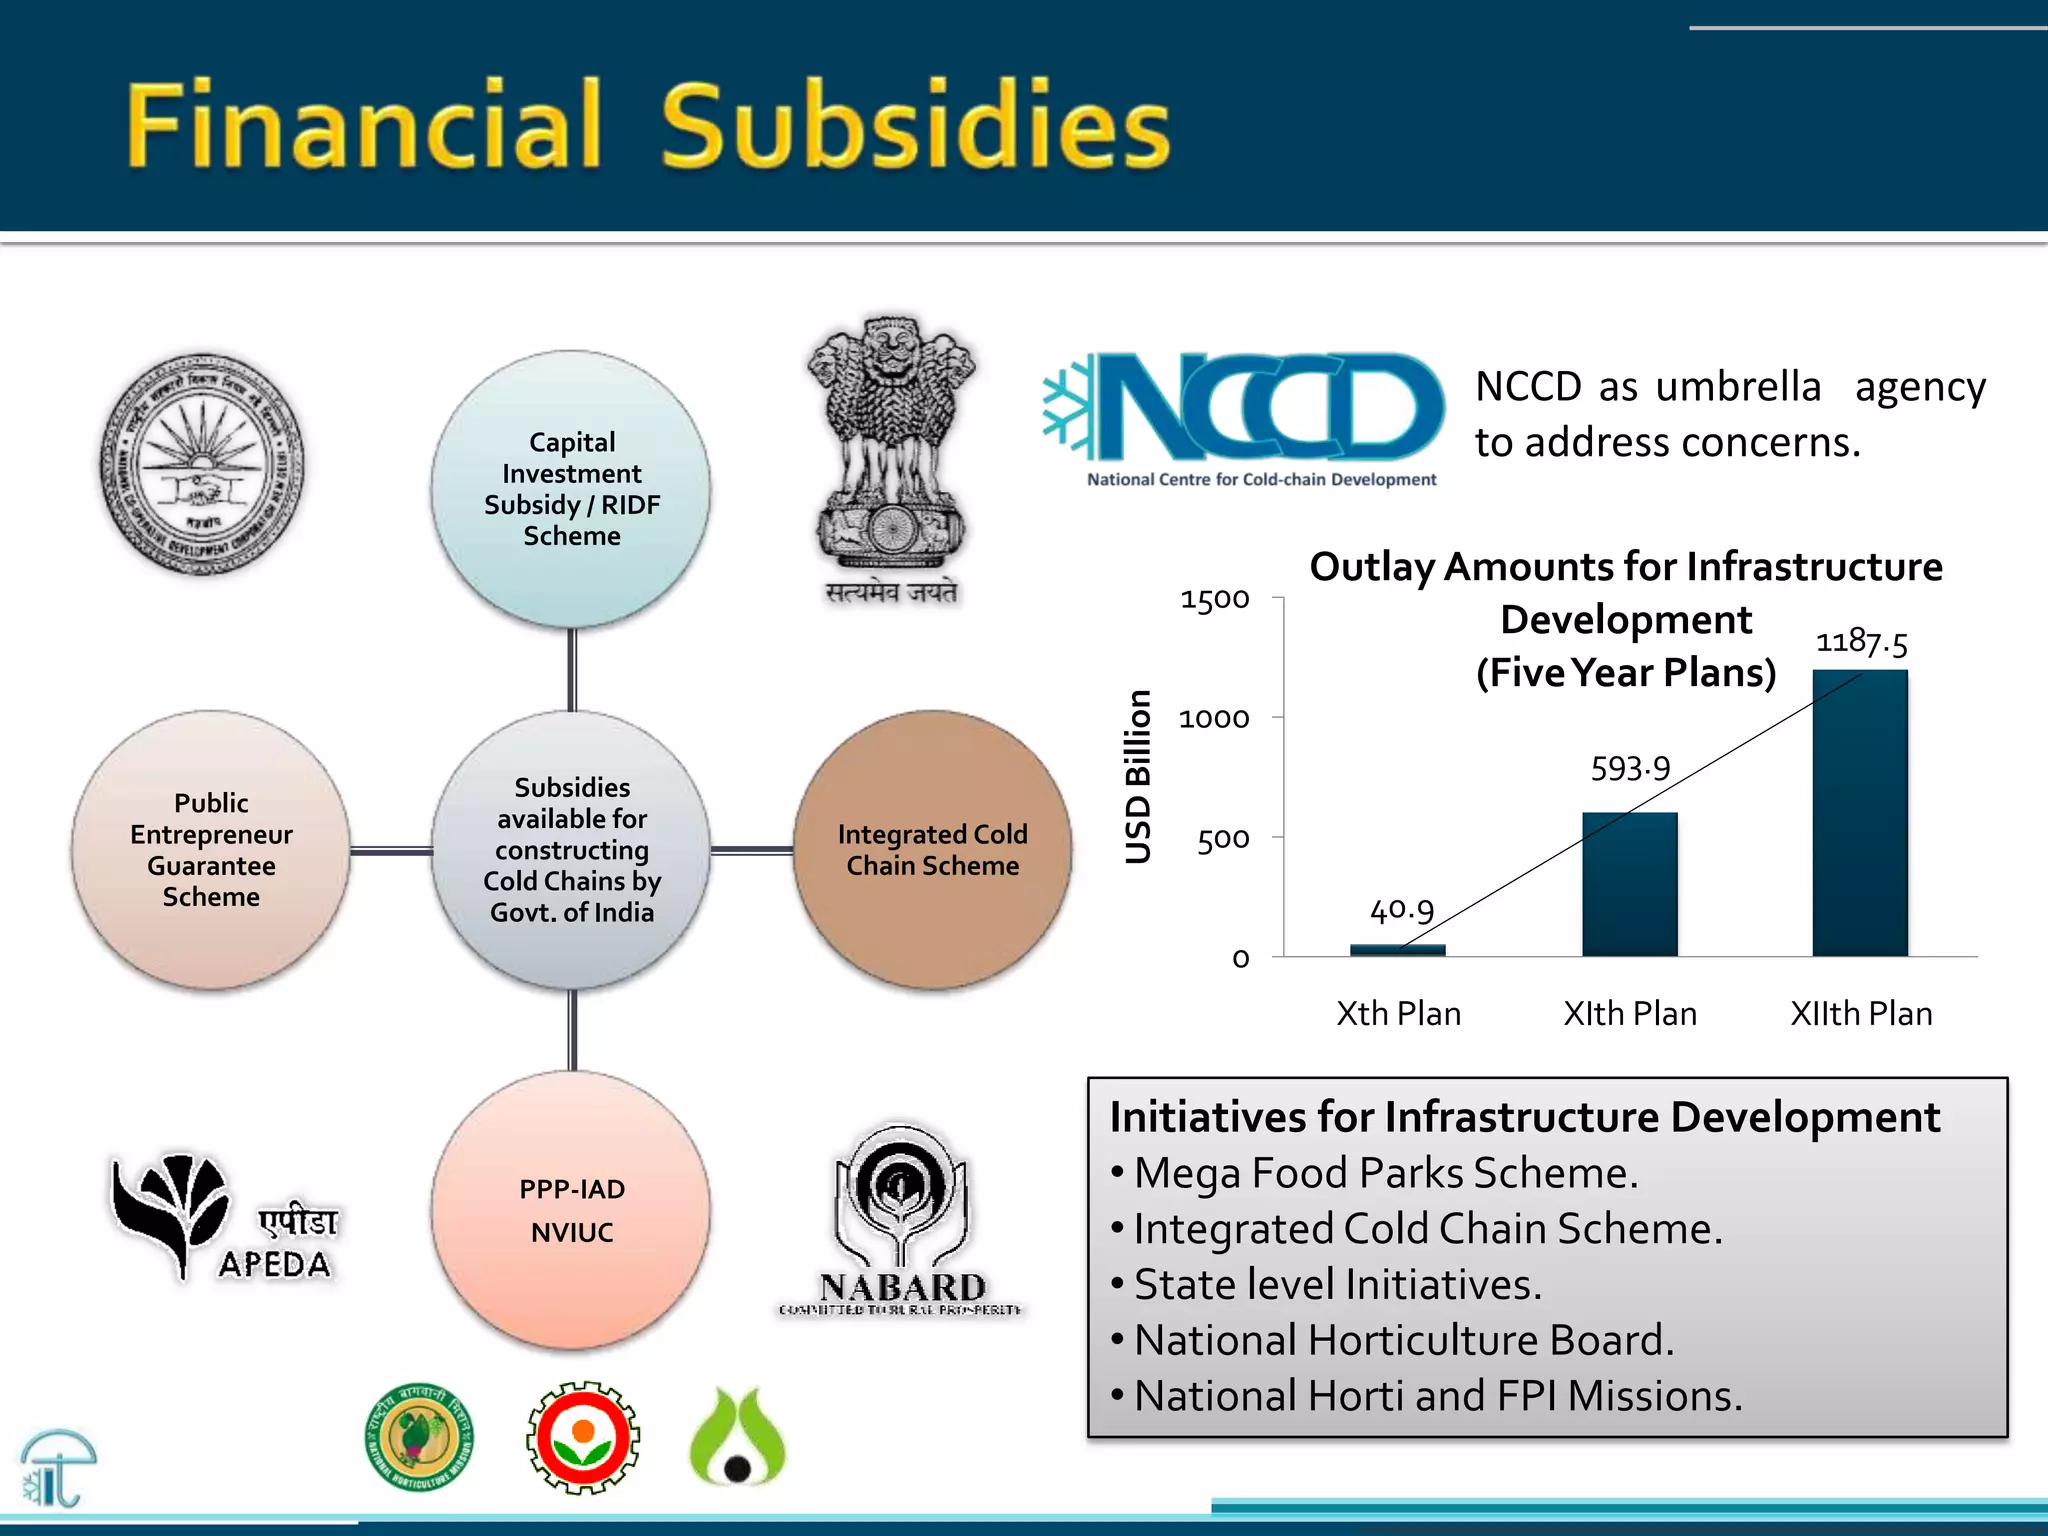
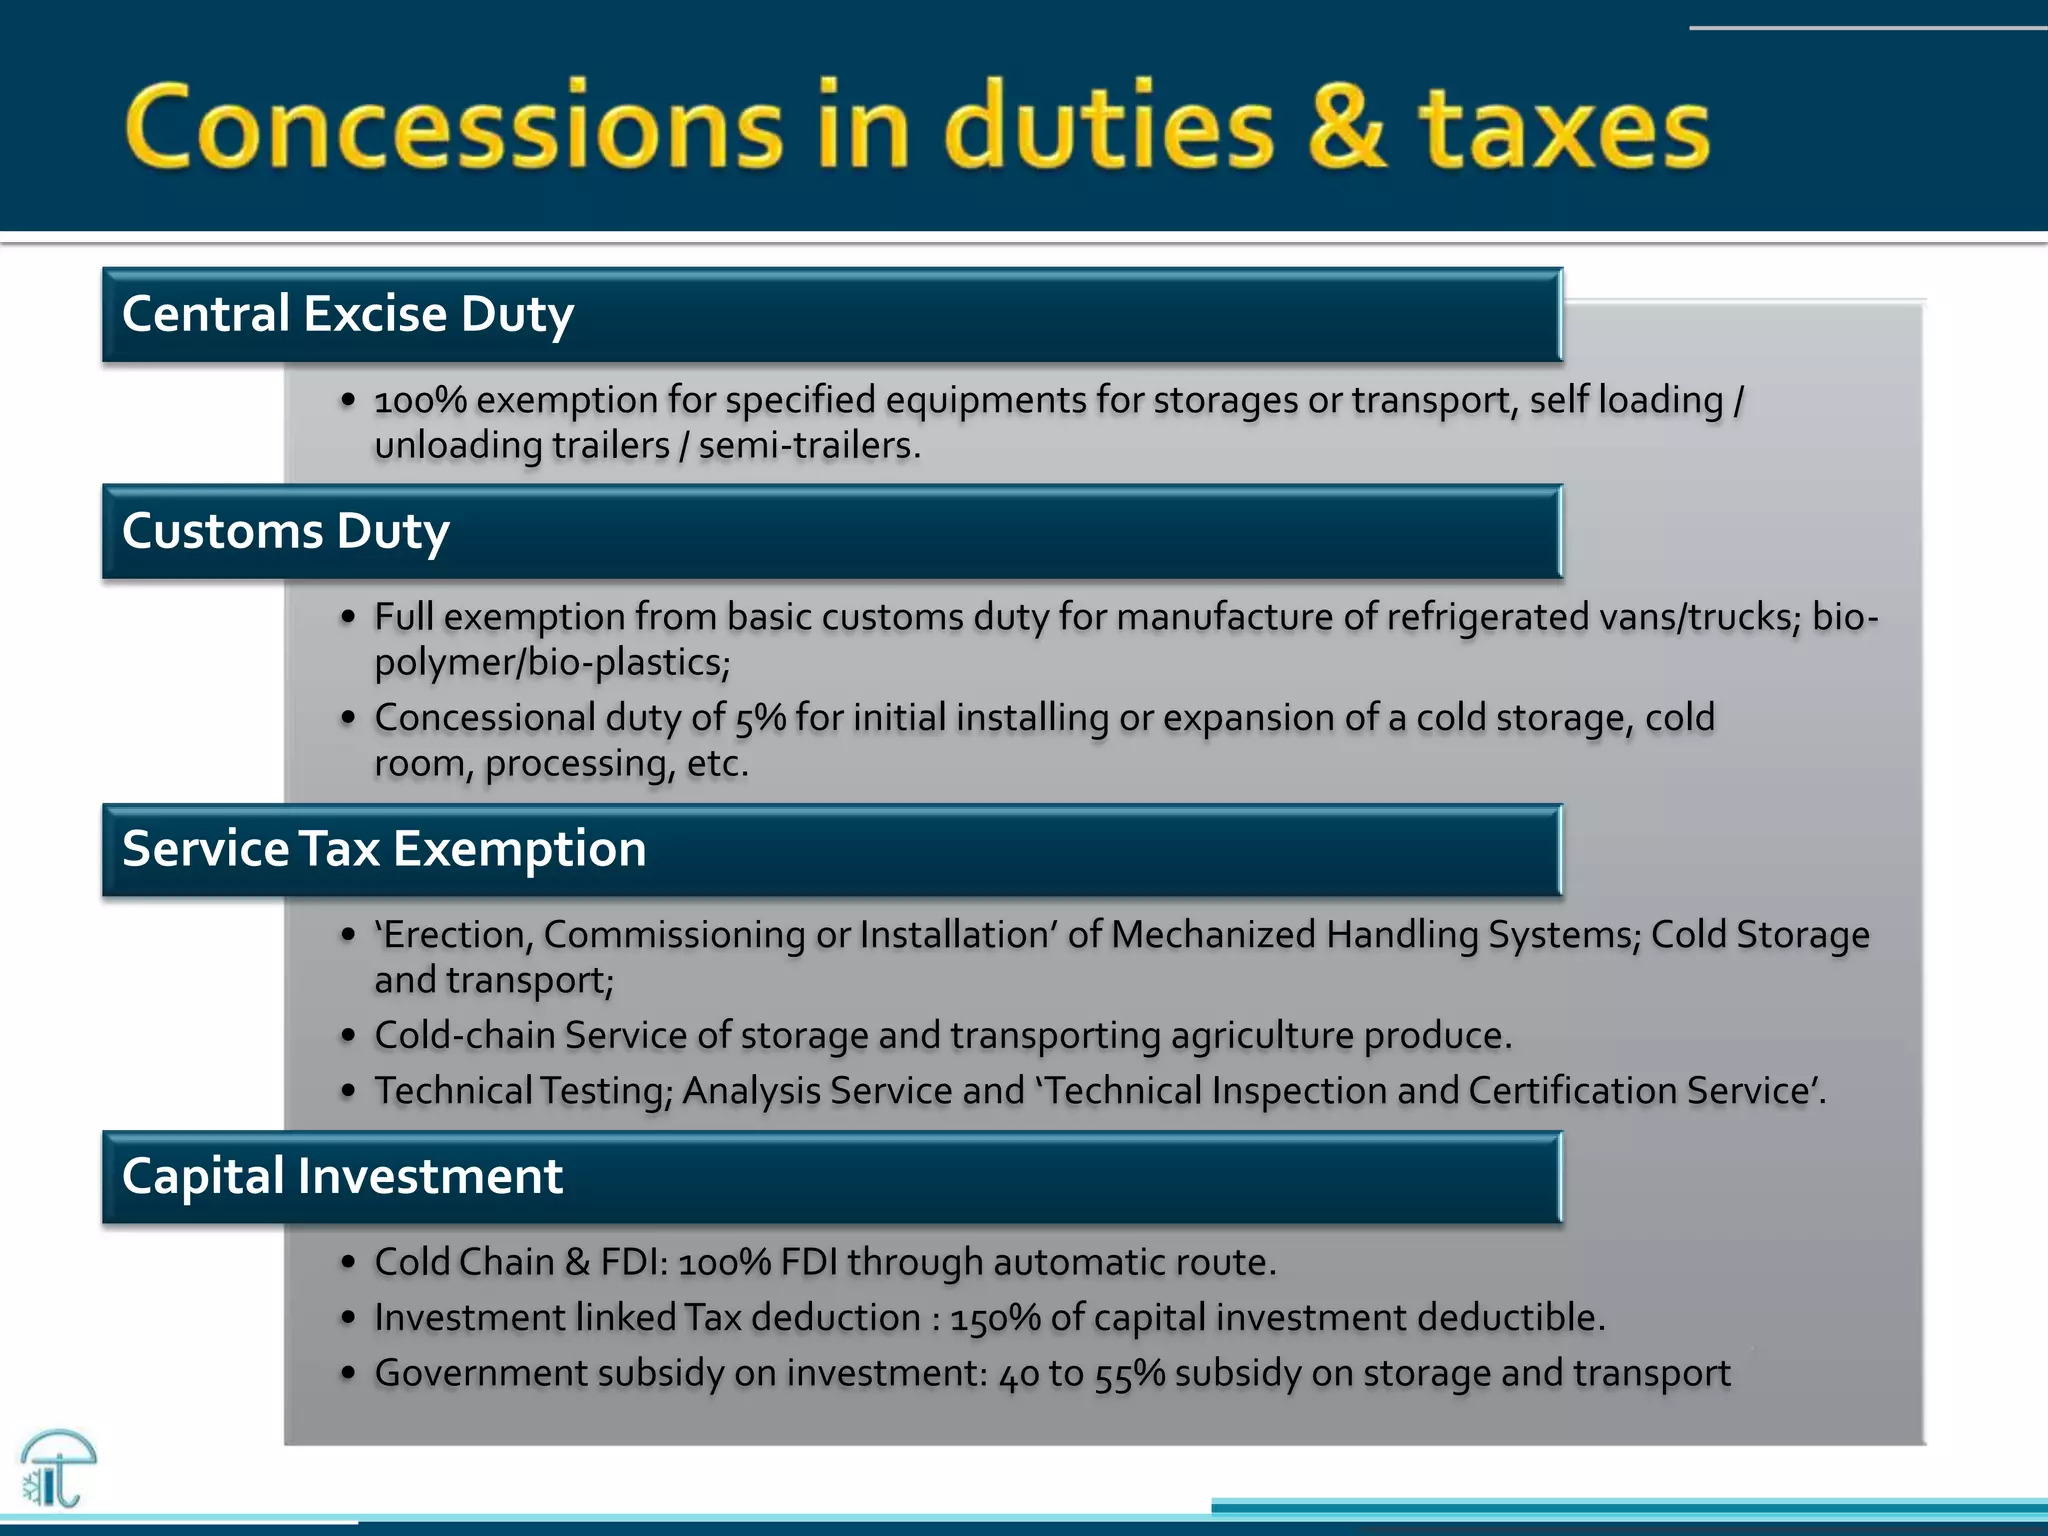
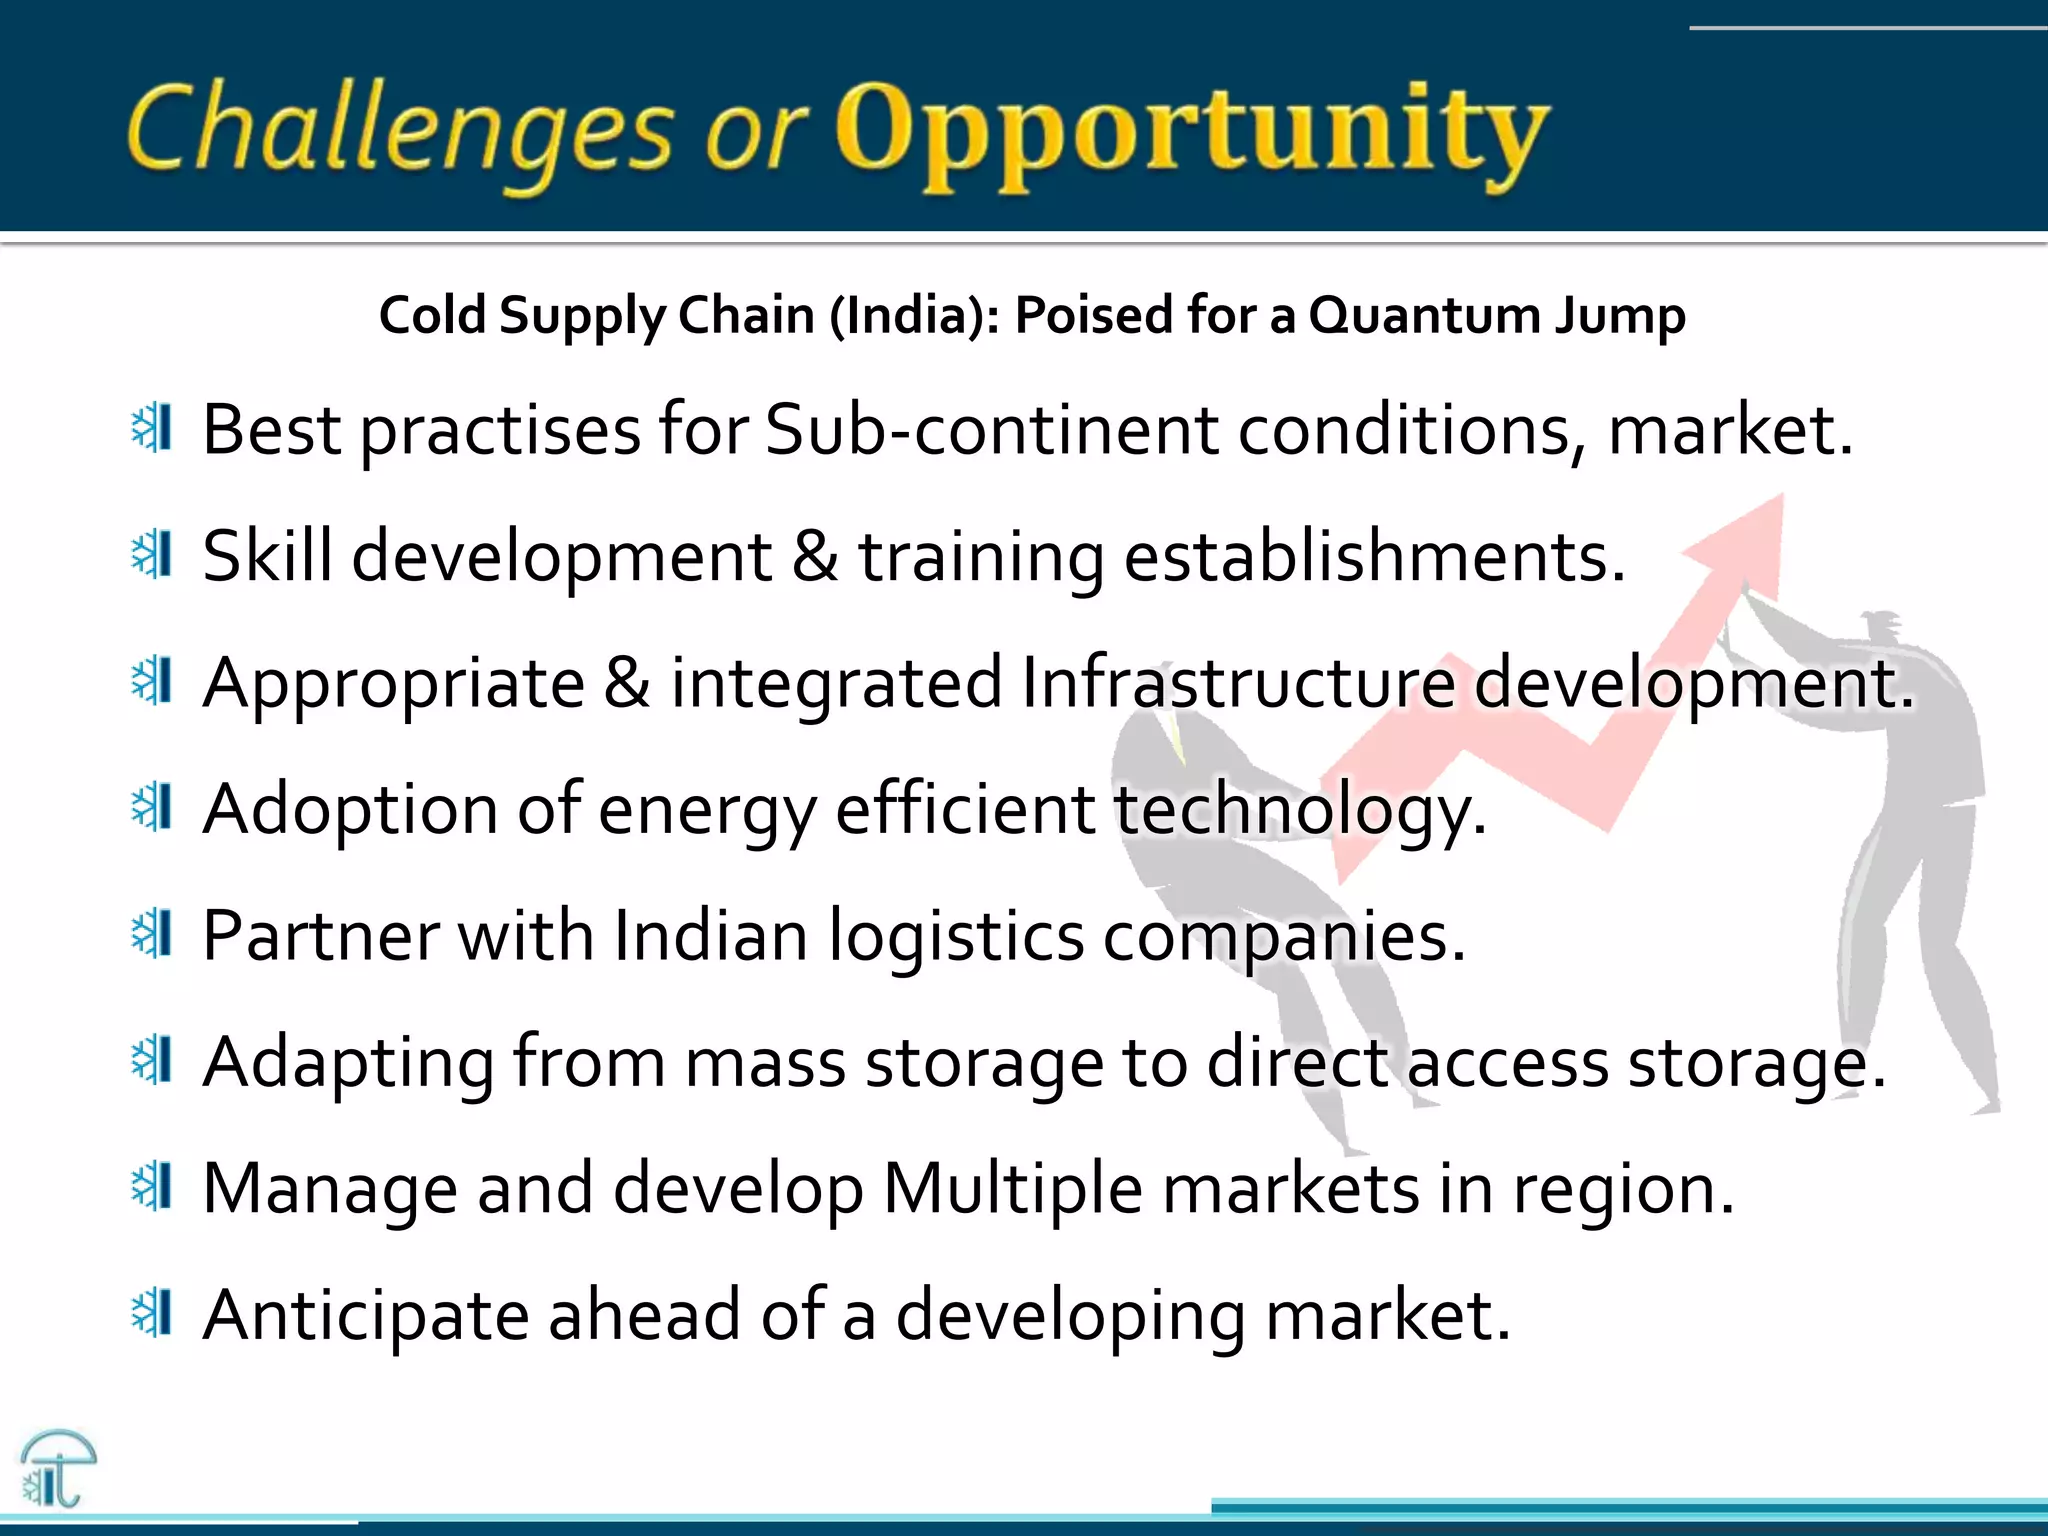
Principal AdvisorChief Advisor to
Globalisation
 Process Integration.
 Bilateral trade.
 Diminishing world,
singular demands.
 Right-Cost Country
optimisation.
 Business friendly
Global Banking.
 Borderless consumer.
Growth in
initial areas
extends parity.
Parity feeds
demand; new
consumption.
Demand
outpaces
development.
Lack of development
creates bottlenecks.
Bottlenecks
raise costs.
High costs restricts;
feeds aspirations.
Aspirations
provide further
scope.
Enduring Scope is Unending Opportunity.
Chain of business
 Chain of transactions.
 Chain of information.
 Chain of operations.
 Chain of processes.
 Chain of policies.
 Chain of people.
 Value chain.
Demographics, National Priorities,
Sustainability, Technology,
Information, Affiliation.
Uneven, non-holistic development of
resources!
Cold-chain requires integration across
total activity chain!
Changing priorities, impatient populace –
short cuts!
Fear of missing the bus – short term
strategy for long term solutions!
Integrated infrastructure development.
Reverse haulage – capacity utilisation.
Market capture – barriers and tariffs.
Training and Skilled deployment.
Rapid demo-graphic changes.
Changing global strategies.
Technology adaption.
Investment inertia.
FSMA /
FSSAI /
Others
Trend is to move from post-facto control mode to
first mile preventive mode.
Impacts independent development agendas;
changed deployment of resources.
Benefits stakeholders from early compliance;
lowered rejects, opens strategic options.
More inclusion among stakeholders.
Prevent
Controls
Inspect
Compliance
Recall
Response
Partner
Administer
Resource
Labs
Skills
Costs
Fees
Procurement
Onus
Distrust
Sharing
Business
New markets
New pricing
The largest producer of milk (133 million tonnes).
Largest producer of mangoes (15 million tonnes).
Largest producer of bananas (29 million tonnes).
Largest exporter of beef (1.52 million tons),
largest buffalo livestock (105 million).
Second in fruit (80 mlllion tonnes) and vegetable
production (160 million tonnes).
Third-largest producer of fish (8.3 million tonnes).
Third largest pharmaceutical producer, 8% of
global production.
Human population of 1.22
billion.
with a GDP of USD 1.94Trillion.
Post harvest value loss ~18-40%
of farm produce.
ForeignTrade USD 795 billion.
Coastline is more than 7,500 km long.
Interspersed with more than 200 ports.
International cargo: 95% by volume and 75% by
value is carried by sea.
Ports capacity 1,247 million tonnes, doubling by
2017.
Railways: 87,087 km, across 7,083 stations and
operates more than 18,000 trains every day.
4.2 million km Roads : National Highways -
76,818 km, State Highways - 154,522 km, District
Roads - 2,577,396 km, Rural Roads - 1,433,577 km.
not a single perishables
gateway!
only ~8000 reefer trucks.
limited reefer rail options.
Containerisation at 20%.
4th largest electricity consumer, fifth largest
installed capacity (246 GW) with 11.5% renewable
capacity.
300 clear days, Solar radiation 4 to 7 kWh/m2;
area 3.287 million sqkms.
Solar reception 5000 Petawatt-hours per year.
Fifth largest in wind power; 18,634MW in 2013.
Among lowest ecological footprints of 0.9
gha/person.
Starkly different, tightly clustered; six major
climatic zones.
DTR: (Tmax) – (Tmin) of 20°C
Shortfall of power, reliance
on diesel gensets.
Insulation and energy
efficiency standards.
Portability options min.
24.0
25.0
26.0
27.0
28.0
29.0
30.0
31.0
32.0
800
850
900
950
1000
1050
1100
1150
1200
1250
%oftotal
millions
Urban population % Total population million
0.0
0.5
1.0
1.5
2.0
2.5
800
850
900
950
1000
1050
1100
1150
1200
1250
%Growth
millions
Total population million Population annual % change
 Indian Economy: growing at
more than 8% for last
decade, population growing @
1.5% annually for last two
decades.
 Continuous urbanisation of
India due to expanding
development.
 Projections: on-going Key socio-
economic changes and four fold
growth in the size of middle to
rich class Indian households;
resulting doubling household
consumptions by 2020.
 Young populace, aspirations
overreached and to stay
stretched.
GDP USD 1.94 trill in 2012 from 1.25 trill
in 2006 (+56% in 6 years).
Spending growth: $991 billion in 2010 to
$3.6 trillion by 2020 (5.8% of global
consumption, doubling from 2.7%).
1,870,000 Consumer Food outlets (2012).
Source: Boston Consulting & CII, IRIS, MoSPI- Govt of India.
474
593
785
1003
354
444
565
735
FY05 FY07 FY09 FY11
Domestic spend (USD from ₹)31-Jan-2012
Per Capita Disposable Income Per Capita Disposable Spending
>2 x from 2005
60%
17%
10%
6%
4%
3%
India Spends on
Food and Grocery
Others
Clothing and Fashion
Electronics
Beauty andWelness
Furniture and Fixtures
Increased
Demand for
(Cold Chain)
Quality
Foods
Increase in
consumer
class pop.
Purchasing
power, Rise in
income
Changed
consumer
mindset
Easy
consumer
credit
Quality &
Hygiene
consciousness
28.6
43.0
50.9
65.6 68.5 71.5
74.9
81.0
58.5
88.6
101.2
128.4
129.1
134.1
146.6
155.0
0
20
40
60
80
100
120
140
160
180
Million
MetricTons
Horticulture Production
Fruits Vegetables Plantation Crops Others
x 2.6
x 2.8
Others: includes Spices, Loose Flowers, Nuts, Mushroom, Aromatic/medicinal and Honey .
Source: Horticulture Division, Ministry of Agriculture and CrossTree Analysis
Agriculture
cultivated area: 150
million hectares
• Area under
Horticulture: 23 million
hectares (15%)
$260 billion to
Indian GDP by
Agriculture
• 35% of this is from
Horticulture.
Within Horticulture, perishable commodities trends higher
& drives growing demand for perishable handling.
Inflationary trend (40 years) shows
Food as prime driver with
perishables contributing highest.
Despite producers showing robust
response by increasing supply, yet
inflationary pressure exists.
This may indicate that demand for
perishable products continues to
outstrip supply.
This also indicates a lack of
efficient supply systems which
continues to feed inflation in food
items. 1971-72 to 1981-82 1982-83 to 1993-94 1995-96 to 2004-05 2005-06 to 2011-12
All Commodity 10.2 7.9 5.9 6.6
Primary Food 8.5 9.2 5.9 9.9
F & V 9.0 10.6 7.5 9.2
Milk 7.1 9.0 5.7 10.1
Eggs, Meat, Fish 11.0 9.4 6.4 11.8
10.2
7.9
5.9
6.6
8.5
9.2
5.9
9.9
5.5
6.5
7.5
8.5
9.5
10.5
11.5
Inflation%
Trends - AnnualAverageWPI Inflation
(from 1970 to 2012)
Continual demand for food distribution and
cold chain is foreseen over coming decade.
Source: RBI, Office of Economic Adviser, MoCI, Govt of India
• Global Cold chain logistics spend from
$5.2 billion in 2008 to $6.9 billion in 2012.
• Growth in Asia outstripped all regions.
• Asia & India continue to grow into a major
hub for Bio-Pharma, cold chain demand
from the sector continues to rise.
Notes : Figures exclude clinical trials which is separate specialised logistics.
Sources: Cold-Chain BioPharma Logistics Sourcebook 2011 & UN Comptrade database, Orkash and CrossTree Analysis
2.1 2.5 2.7 3.2
1.5
1.7 1.9
2.31.0
1.2
1.5
2.2
0.6
0.6
0.8
1.1
0
2
4
6
8
10
2008 2009 2012e 2015e
BioPharma Logistics Spending (USD Billion)
NorthAmerica Europe Asia Rest ofWorld
0 0.5 1 1.5 2 2.5 3
North America
Europe
Asia
Rest of World
Cold Logistics Growth
USD Billion
2012e
2008
$0.6 to 0.8 billion (33% Growth)
$1.0 to 1.5 billion (50% Growth)
$1.5 to 1.9 billion (27% Growth)
$2.1to 2.7billion (29% Growth)
Higher-than-average growth in vaccines & specialty
pharmaceuticals and heightened regulatory
requirements continues to drive cold chain for pharma.
3.7 4.9 4.9 6.1 7.2 8.3
10.5
13.5
16.7
11.5
13.4
15.6
18.4
21.5
24.7
28.4
32.4
36.7
0
10
20
30
40
2007 2008 2009 2010 2011 2012F 2013F 2014F 2015F
Indian Pharmaceutical USD Billion
Exports
Total
Cold chain shipment growth by region
Note : Total Food Service Outlets is a sum of Standalone , Leisure and Retail outlets
Source : Euromonitor, IBEF, IRIS and CrossTree Analysis
 India is 5th largest retail market worldwide.
 1,968,000 Consumer Food outlets by 2015.
Organised Retail Market is growing despite FDI.This
feeds demand for cold chain. Simultaneous growth in the
food service sector accelerates need for the cold-chain.
0
20
40
60
80
100
120
140
160
0
200
400
600
800
1,000
1,200
1,400
1,600
1,800
2,000
2005 2006 2007 2008 2009 2010 2011 2012E 2013E 2014E 2015E
Food Service Outlets (‘000)
Standalone (LHS) Leisure (RHS) Retail (RHS)
27.8 41.4
88.6
396.1
486.4
780.5
0.0
100.0
200.0
300.0
400.0
500.0
600.0
700.0
800.0
2010 2012 2015P
Size of Retail Market (USD Billion)
Modern Retail
Traditional
Food &
Grocery
Furniture
&…
Electronic
s
Beauty &
Wellness
Clothing &
Fashion
Others
99%
77%
96%
88%
89%
90%
Traditional Modern
Notes: 2009 and 2010 numbers only for NHB and NHM assisted cold storages. Numbers as of Dec 2012
Source: NHB, NHM, Directorate of Marketing and Inspection 2009, Orkash & Crosstree Analysis
0
5000
10000
15000
20000
25000
30000
35000
0
1000
2000
3000
4000
5000
6000
7000
1955 1960 1965 1970 1975 1979 1986 2004 2007 2009 2010 2011 2012#
(‘000)tons
Number
Cold Storage Availability
Number of Cold Storages
Installed Capacity in '000 tons (Cumulative)
In the Last Decade1955-1986
As of last recorded national level data , India has 6488 cold storage with a cumulative
installed capacity of approximately 30 million MetricTons .
Key Trends
• More than 25% of the cold storage units (~10 mill tons) have been built post 2004.
• Growth (CAGR 2004-12 ) : Numbers of Cold Storage : 3.57%, Capacity : 5.19%. Growth in Transport capacity 22%
• Current short fall of 4000 reefer trucks, govt states another 30+ million tons capacity needed.
The witnessed growth in the Cold Storage sector is accepted to only accelerate in the coming years
88%
12%
Segments
Storage
Transport
2007-08 2010-11 2014-15
2.1
3.8
6.9
0.2
0.9
1.9
CC Market U$ Billion
Storage Transport
Capacity mostly focused on single product types –
a long learning curve established
Minimal outreach for foods and pharma –
localised operations, earlier focus was storage.
Chain approach to counter Irregular parameters
across regions and within days.
Fragmented development did not encourage
holistic cool logistics for single source service.
Refrigerated systems need adaption to India
specific needs in design and capacity utilisation.
Government as
‘Catalyst’
Encourages
Investments
Agri/Foods identified as
priority sector
Encourages
holistic
development
NCCD takes shape
Liberalises
Marketing
Norms
Focus on Market links
development
Rationalises
Tax Laws
Move to uniform
VAT/GST
Credits
Grants &
Subsidies
PPP, Grants, Negotiable
Warehouse Receipts
Liberalising
FDI Inflow
100% FDI in food
sector
Increasing focus to create enabling infrastructure by govt. While this support was earlier
focused on static cold storages, recent developments have been to include refrigerated trucks
including containers. NCCD to play pivotal role to correlate industry expectations and policies.
Subsidies
available for
constructing
Cold Chains by
Govt. of India
Capital
Investment
Subsidy / RIDF
Scheme
Integrated Cold
Chain Scheme
PPP-IAD
NVIUC
Public
Entrepreneur
Guarantee
Scheme 40.9
593.9
1187.5
0
500
1000
1500
Xth Plan XIth Plan XIIth Plan
USDBillion
Outlay Amounts for Infrastructure
Development
(FiveYear Plans)
Initiatives for Infrastructure Development
• Mega Food Parks Scheme.
• Integrated Cold Chain Scheme.
• State level Initiatives.
• National Horticulture Board.
• National Horti and FPI Missions.
NCCD as umbrella agency
to address concerns.
Central Excise Duty
• 100% exemption for specified equipments for storages or transport, self loading /
unloading trailers / semi-trailers.
Customs Duty
• Full exemption from basic customs duty for manufacture of refrigerated vans/trucks; bio-
polymer/bio-plastics;
• Concessional duty of 5% for initial installing or expansion of a cold storage, cold
room, processing, etc.
ServiceTax Exemption
• ‘Erection, Commissioning or Installation’ of Mechanized Handling Systems; Cold Storage
and transport;
• Cold-chain Service of storage and transporting agriculture produce.
• TechnicalTesting; Analysis Service and ‘Technical Inspection and Certification Service’.
Capital Investment
• Cold Chain & FDI: 100% FDI through automatic route.
• Investment linkedTax deduction : 150% of capital investment deductible.
• Government subsidy on investment: 40 to 55% subsidy on storage and transport
Industry, PSUs, Government, Investors, Entrepreneurs, Farming
Associations & Knowledge Houses - All Working Together!
Executive
Committee
2
5
3
4
1
TechnicalSpecification,
Standards,Test
Laboratory & Product
CertificationCommittee.
Training, HRD and
R&DCommittee.
Committee for Application of
non-Conventional Energy
Sources in ColdChain
Infrastructure.
NCCD Members, other
Committee for Supply
Chain & Logistics.
6
Liaison with other NLAs
and States
cold chain sectors
Cold Supply Chain (India): Poised for a Quantum Jump
Best practises for Sub-continent conditions, market.
Skill development & training establishments.
Appropriate & integrated Infrastructure development.
Adoption of energy efficient technology.
Partner with Indian logistics companies.
Adapting from mass storage to direct access storage.
Manage and develop Multiple markets in region.
Anticipate ahead of a developing market.
Innovators and solutions biased companies.
Technology Provision and implementation.
Cold Logistics and Supply Chain services.
Specialised Infrastructure designers and planners.
Expertise in alternate energy, environmental protection.
Scalable, Energy efficient Refrigeration technology.
RefrigeratedVehicles and last mile delivery systems.
Education,Training & Cold chain management experts.
Knowledge Managers and Integration specialists.
Food / Pharma Exports
Polio EradicatedQSR Majors
Eggs, Beef, Ice Cream
The Source and the Destination
Visualisation
www.nasa.gov Earth Gallery
Nodal Body for Cold-chain Development
Ministry of Agriculture
Contact-NCCD@gov.in

Cold-chain in emerging markets

  • 1.
  • 2.
    Globalisation  Process Integration. Bilateral trade.  Diminishing world, singular demands.  Right-Cost Country optimisation.  Business friendly Global Banking.  Borderless consumer.
  • 3.
    Growth in initial areas extendsparity. Parity feeds demand; new consumption. Demand outpaces development. Lack of development creates bottlenecks. Bottlenecks raise costs. High costs restricts; feeds aspirations. Aspirations provide further scope. Enduring Scope is Unending Opportunity.
  • 4.
    Enduring Scope isUnending Opportunity. Chain of business  Chain of transactions.  Chain of information.  Chain of operations.  Chain of processes.  Chain of policies.  Chain of people.  Value chain. Demographics, National Priorities, Sustainability, Technology, Information, Affiliation.
  • 5.
    Uneven, non-holistic developmentof resources! Cold-chain requires integration across total activity chain! Changing priorities, impatient populace – short cuts! Fear of missing the bus – short term strategy for long term solutions!
  • 6.
    Integrated infrastructure development. Reversehaulage – capacity utilisation. Market capture – barriers and tariffs. Training and Skilled deployment. Rapid demo-graphic changes. Changing global strategies. Technology adaption. Investment inertia.
  • 7.
    FSMA / FSSAI / Others Trendis to move from post-facto control mode to first mile preventive mode. Impacts independent development agendas; changed deployment of resources. Benefits stakeholders from early compliance; lowered rejects, opens strategic options. More inclusion among stakeholders.
  • 8.
  • 9.
    The largest producerof milk (133 million tonnes). Largest producer of mangoes (15 million tonnes). Largest producer of bananas (29 million tonnes). Largest exporter of beef (1.52 million tons), largest buffalo livestock (105 million). Second in fruit (80 mlllion tonnes) and vegetable production (160 million tonnes). Third-largest producer of fish (8.3 million tonnes). Third largest pharmaceutical producer, 8% of global production.
  • 10.
    Human population of1.22 billion. with a GDP of USD 1.94Trillion. Post harvest value loss ~18-40% of farm produce. ForeignTrade USD 795 billion.
  • 11.
    Coastline is morethan 7,500 km long. Interspersed with more than 200 ports. International cargo: 95% by volume and 75% by value is carried by sea. Ports capacity 1,247 million tonnes, doubling by 2017. Railways: 87,087 km, across 7,083 stations and operates more than 18,000 trains every day. 4.2 million km Roads : National Highways - 76,818 km, State Highways - 154,522 km, District Roads - 2,577,396 km, Rural Roads - 1,433,577 km.
  • 12.
    not a singleperishables gateway! only ~8000 reefer trucks. limited reefer rail options. Containerisation at 20%.
  • 13.
    4th largest electricityconsumer, fifth largest installed capacity (246 GW) with 11.5% renewable capacity. 300 clear days, Solar radiation 4 to 7 kWh/m2; area 3.287 million sqkms. Solar reception 5000 Petawatt-hours per year. Fifth largest in wind power; 18,634MW in 2013. Among lowest ecological footprints of 0.9 gha/person. Starkly different, tightly clustered; six major climatic zones.
  • 14.
    DTR: (Tmax) –(Tmin) of 20°C Shortfall of power, reliance on diesel gensets. Insulation and energy efficiency standards. Portability options min.
  • 15.
    24.0 25.0 26.0 27.0 28.0 29.0 30.0 31.0 32.0 800 850 900 950 1000 1050 1100 1150 1200 1250 %oftotal millions Urban population %Total population million 0.0 0.5 1.0 1.5 2.0 2.5 800 850 900 950 1000 1050 1100 1150 1200 1250 %Growth millions Total population million Population annual % change  Indian Economy: growing at more than 8% for last decade, population growing @ 1.5% annually for last two decades.  Continuous urbanisation of India due to expanding development.  Projections: on-going Key socio- economic changes and four fold growth in the size of middle to rich class Indian households; resulting doubling household consumptions by 2020.  Young populace, aspirations overreached and to stay stretched.
  • 16.
    GDP USD 1.94trill in 2012 from 1.25 trill in 2006 (+56% in 6 years). Spending growth: $991 billion in 2010 to $3.6 trillion by 2020 (5.8% of global consumption, doubling from 2.7%). 1,870,000 Consumer Food outlets (2012). Source: Boston Consulting & CII, IRIS, MoSPI- Govt of India. 474 593 785 1003 354 444 565 735 FY05 FY07 FY09 FY11 Domestic spend (USD from ₹)31-Jan-2012 Per Capita Disposable Income Per Capita Disposable Spending >2 x from 2005 60% 17% 10% 6% 4% 3% India Spends on Food and Grocery Others Clothing and Fashion Electronics Beauty andWelness Furniture and Fixtures Increased Demand for (Cold Chain) Quality Foods Increase in consumer class pop. Purchasing power, Rise in income Changed consumer mindset Easy consumer credit Quality & Hygiene consciousness
  • 17.
    28.6 43.0 50.9 65.6 68.5 71.5 74.9 81.0 58.5 88.6 101.2 128.4 129.1 134.1 146.6 155.0 0 20 40 60 80 100 120 140 160 180 Million MetricTons HorticultureProduction Fruits Vegetables Plantation Crops Others x 2.6 x 2.8 Others: includes Spices, Loose Flowers, Nuts, Mushroom, Aromatic/medicinal and Honey . Source: Horticulture Division, Ministry of Agriculture and CrossTree Analysis Agriculture cultivated area: 150 million hectares • Area under Horticulture: 23 million hectares (15%) $260 billion to Indian GDP by Agriculture • 35% of this is from Horticulture. Within Horticulture, perishable commodities trends higher & drives growing demand for perishable handling.
  • 18.
    Inflationary trend (40years) shows Food as prime driver with perishables contributing highest. Despite producers showing robust response by increasing supply, yet inflationary pressure exists. This may indicate that demand for perishable products continues to outstrip supply. This also indicates a lack of efficient supply systems which continues to feed inflation in food items. 1971-72 to 1981-82 1982-83 to 1993-94 1995-96 to 2004-05 2005-06 to 2011-12 All Commodity 10.2 7.9 5.9 6.6 Primary Food 8.5 9.2 5.9 9.9 F & V 9.0 10.6 7.5 9.2 Milk 7.1 9.0 5.7 10.1 Eggs, Meat, Fish 11.0 9.4 6.4 11.8 10.2 7.9 5.9 6.6 8.5 9.2 5.9 9.9 5.5 6.5 7.5 8.5 9.5 10.5 11.5 Inflation% Trends - AnnualAverageWPI Inflation (from 1970 to 2012) Continual demand for food distribution and cold chain is foreseen over coming decade. Source: RBI, Office of Economic Adviser, MoCI, Govt of India
  • 19.
    • Global Coldchain logistics spend from $5.2 billion in 2008 to $6.9 billion in 2012. • Growth in Asia outstripped all regions. • Asia & India continue to grow into a major hub for Bio-Pharma, cold chain demand from the sector continues to rise. Notes : Figures exclude clinical trials which is separate specialised logistics. Sources: Cold-Chain BioPharma Logistics Sourcebook 2011 & UN Comptrade database, Orkash and CrossTree Analysis 2.1 2.5 2.7 3.2 1.5 1.7 1.9 2.31.0 1.2 1.5 2.2 0.6 0.6 0.8 1.1 0 2 4 6 8 10 2008 2009 2012e 2015e BioPharma Logistics Spending (USD Billion) NorthAmerica Europe Asia Rest ofWorld 0 0.5 1 1.5 2 2.5 3 North America Europe Asia Rest of World Cold Logistics Growth USD Billion 2012e 2008 $0.6 to 0.8 billion (33% Growth) $1.0 to 1.5 billion (50% Growth) $1.5 to 1.9 billion (27% Growth) $2.1to 2.7billion (29% Growth) Higher-than-average growth in vaccines & specialty pharmaceuticals and heightened regulatory requirements continues to drive cold chain for pharma. 3.7 4.9 4.9 6.1 7.2 8.3 10.5 13.5 16.7 11.5 13.4 15.6 18.4 21.5 24.7 28.4 32.4 36.7 0 10 20 30 40 2007 2008 2009 2010 2011 2012F 2013F 2014F 2015F Indian Pharmaceutical USD Billion Exports Total Cold chain shipment growth by region
  • 20.
    Note : TotalFood Service Outlets is a sum of Standalone , Leisure and Retail outlets Source : Euromonitor, IBEF, IRIS and CrossTree Analysis  India is 5th largest retail market worldwide.  1,968,000 Consumer Food outlets by 2015. Organised Retail Market is growing despite FDI.This feeds demand for cold chain. Simultaneous growth in the food service sector accelerates need for the cold-chain. 0 20 40 60 80 100 120 140 160 0 200 400 600 800 1,000 1,200 1,400 1,600 1,800 2,000 2005 2006 2007 2008 2009 2010 2011 2012E 2013E 2014E 2015E Food Service Outlets (‘000) Standalone (LHS) Leisure (RHS) Retail (RHS) 27.8 41.4 88.6 396.1 486.4 780.5 0.0 100.0 200.0 300.0 400.0 500.0 600.0 700.0 800.0 2010 2012 2015P Size of Retail Market (USD Billion) Modern Retail Traditional Food & Grocery Furniture &… Electronic s Beauty & Wellness Clothing & Fashion Others 99% 77% 96% 88% 89% 90% Traditional Modern
  • 21.
    Notes: 2009 and2010 numbers only for NHB and NHM assisted cold storages. Numbers as of Dec 2012 Source: NHB, NHM, Directorate of Marketing and Inspection 2009, Orkash & Crosstree Analysis 0 5000 10000 15000 20000 25000 30000 35000 0 1000 2000 3000 4000 5000 6000 7000 1955 1960 1965 1970 1975 1979 1986 2004 2007 2009 2010 2011 2012# (‘000)tons Number Cold Storage Availability Number of Cold Storages Installed Capacity in '000 tons (Cumulative) In the Last Decade1955-1986 As of last recorded national level data , India has 6488 cold storage with a cumulative installed capacity of approximately 30 million MetricTons . Key Trends • More than 25% of the cold storage units (~10 mill tons) have been built post 2004. • Growth (CAGR 2004-12 ) : Numbers of Cold Storage : 3.57%, Capacity : 5.19%. Growth in Transport capacity 22% • Current short fall of 4000 reefer trucks, govt states another 30+ million tons capacity needed. The witnessed growth in the Cold Storage sector is accepted to only accelerate in the coming years 88% 12% Segments Storage Transport 2007-08 2010-11 2014-15 2.1 3.8 6.9 0.2 0.9 1.9 CC Market U$ Billion Storage Transport
  • 22.
    Capacity mostly focusedon single product types – a long learning curve established Minimal outreach for foods and pharma – localised operations, earlier focus was storage. Chain approach to counter Irregular parameters across regions and within days. Fragmented development did not encourage holistic cool logistics for single source service. Refrigerated systems need adaption to India specific needs in design and capacity utilisation.
  • 23.
    Capacity mostly focusedon single product types – a long learning curve established Minimal outreach for foods and pharma – localised operations, earlier focus was storage. Chain approach to counter Irregular parameters across regions and within days. Fragmented development did not encourage holistic cool logistics for single source service. Refrigerated systems need adaption to India specific needs in design and capacity utilisation.
  • 24.
    Government as ‘Catalyst’ Encourages Investments Agri/Foods identifiedas priority sector Encourages holistic development NCCD takes shape Liberalises Marketing Norms Focus on Market links development Rationalises Tax Laws Move to uniform VAT/GST Credits Grants & Subsidies PPP, Grants, Negotiable Warehouse Receipts Liberalising FDI Inflow 100% FDI in food sector Increasing focus to create enabling infrastructure by govt. While this support was earlier focused on static cold storages, recent developments have been to include refrigerated trucks including containers. NCCD to play pivotal role to correlate industry expectations and policies.
  • 25.
    Subsidies available for constructing Cold Chainsby Govt. of India Capital Investment Subsidy / RIDF Scheme Integrated Cold Chain Scheme PPP-IAD NVIUC Public Entrepreneur Guarantee Scheme 40.9 593.9 1187.5 0 500 1000 1500 Xth Plan XIth Plan XIIth Plan USDBillion Outlay Amounts for Infrastructure Development (FiveYear Plans) Initiatives for Infrastructure Development • Mega Food Parks Scheme. • Integrated Cold Chain Scheme. • State level Initiatives. • National Horticulture Board. • National Horti and FPI Missions. NCCD as umbrella agency to address concerns.
  • 26.
    Central Excise Duty •100% exemption for specified equipments for storages or transport, self loading / unloading trailers / semi-trailers. Customs Duty • Full exemption from basic customs duty for manufacture of refrigerated vans/trucks; bio- polymer/bio-plastics; • Concessional duty of 5% for initial installing or expansion of a cold storage, cold room, processing, etc. ServiceTax Exemption • ‘Erection, Commissioning or Installation’ of Mechanized Handling Systems; Cold Storage and transport; • Cold-chain Service of storage and transporting agriculture produce. • TechnicalTesting; Analysis Service and ‘Technical Inspection and Certification Service’. Capital Investment • Cold Chain & FDI: 100% FDI through automatic route. • Investment linkedTax deduction : 150% of capital investment deductible. • Government subsidy on investment: 40 to 55% subsidy on storage and transport
  • 27.
    Industry, PSUs, Government,Investors, Entrepreneurs, Farming Associations & Knowledge Houses - All Working Together! Executive Committee 2 5 3 4 1 TechnicalSpecification, Standards,Test Laboratory & Product CertificationCommittee. Training, HRD and R&DCommittee. Committee for Application of non-Conventional Energy Sources in ColdChain Infrastructure. NCCD Members, other Committee for Supply Chain & Logistics. 6 Liaison with other NLAs and States cold chain sectors
  • 28.
    Cold Supply Chain(India): Poised for a Quantum Jump Best practises for Sub-continent conditions, market. Skill development & training establishments. Appropriate & integrated Infrastructure development. Adoption of energy efficient technology. Partner with Indian logistics companies. Adapting from mass storage to direct access storage. Manage and develop Multiple markets in region. Anticipate ahead of a developing market.
  • 29.
    Innovators and solutionsbiased companies. Technology Provision and implementation. Cold Logistics and Supply Chain services. Specialised Infrastructure designers and planners. Expertise in alternate energy, environmental protection. Scalable, Energy efficient Refrigeration technology. RefrigeratedVehicles and last mile delivery systems. Education,Training & Cold chain management experts. Knowledge Managers and Integration specialists.
  • 30.
    Food / PharmaExports Polio EradicatedQSR Majors Eggs, Beef, Ice Cream
  • 33.
    The Source andthe Destination
  • 34.
  • 35.
  • 36.
    Nodal Body forCold-chain Development Ministry of Agriculture Contact-NCCD@gov.in