Download to read offline
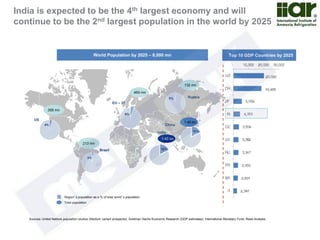

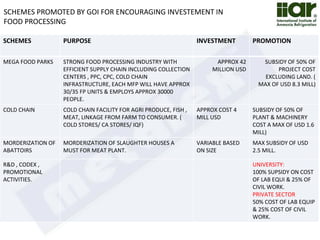
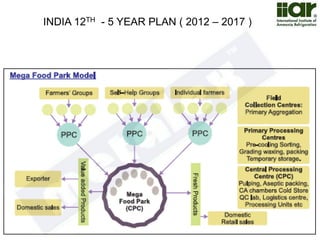
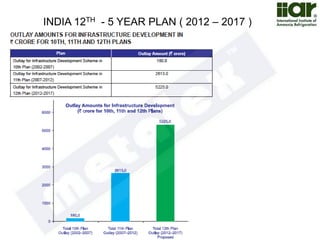
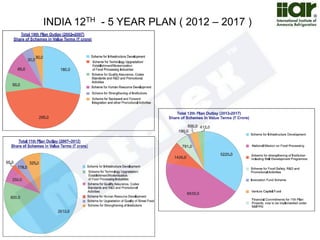
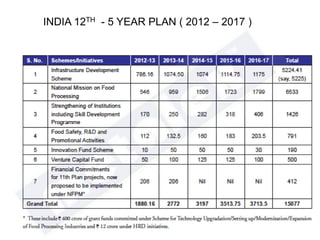
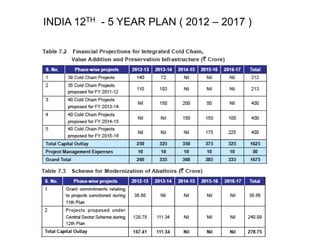
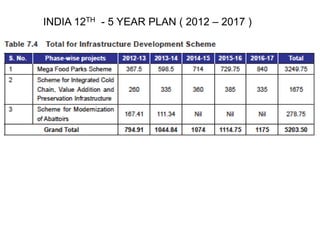
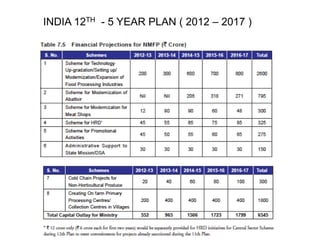


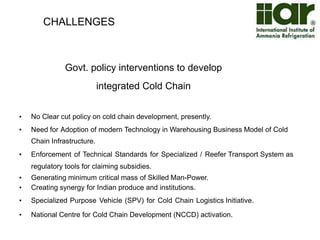
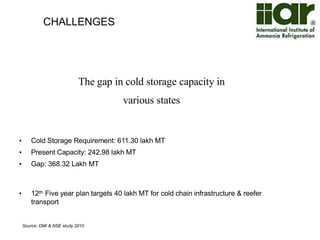
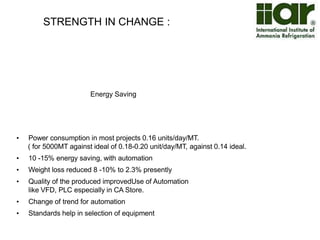
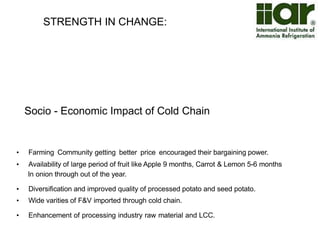


The document outlines India's economic projections, highlighting that it is expected to become the fourth-largest economy with a population estimate of 1.45 billion by 2025. It emphasizes the crucial role of cold chain infrastructure in improving the food processing industry and details government initiatives, including financial subsidies and policy frameworks to boost investments in this sector. The report also identifies challenges such as energy costs and the need for modernization in cold storage capacities, while indicating significant growth opportunities within the industry.


![Cold chain dubai 26_oct08[1]](https://cdn.slidesharecdn.com/ss_thumbnails/coldchaindubai26oct081-100620015824-phpapp01-thumbnail.jpg?width=640&height=640&fit=bounds)


