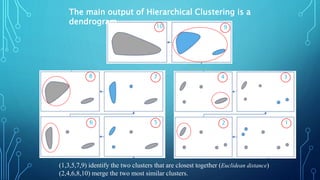
MACHINE LEARNING
JASON TSENG
INFORMATION ENGINEERING, KSU
UNSUPERVISED LEARNING-CLUSTERING
ALGORITHMS
• These methods are used to find similarity and/or features as well as the relationship
patterns among data samples, and then cluster those samples into groups having
similarity based on features, i.e. How are they grouped?
• Clustering is important because it determines the intrinsic grouping among the
present unlabeled data.
• They basically make some assumptions about data points to constitute their similarity.
Each assumption will construct differently but equally valid clusters.
TRADITIONAL CLUSTERING
ALGORITHMS
A Comprehensive Survey of Clustering Algorithms Xu, D. & Tian, Y. Ann. Data. Sci. (2015) 2: 165.
CLUSTERING ALGORITHMS-HIERARCHY
BASED
• The clusters forms a tree type structure based
on the hierarchy where new clusters are formed
using the previously formed one.
• It is divided into two category:
Agglomerative (bottom up approach)
Divisive (top down approach) .
• Examples CURE (Clustering Using
Representatives), BIRCH (Balanced Iterative
Reducing Clustering and using
Hierarchies) etc.
A vertebrate is an animal with a spinal cord surrounded
by cartilage or bone.
CATEGORIES OF HIERARCHICAL
ALGORITHMS
• Agglomerative hierarchical algorithms − each data point is
treated as a single cluster and then successively merge or
agglomerate (bottom-up approach) the pairs of clusters. The
hierarchy of the clusters is represented as a dendrogram or tree
structure.
• Divisive hierarchical algorithms − all the data points are treated
as one big cluster and the process of clustering involves
dividing (Top-down approach) the one big cluster into various
small clusters.
STEPS TO PERFORM AGGLOMERATIVE
HIERARCHICAL CLUSTERING
• The steps to perform the same is as follows −
• Step 1 − Treat each data point as single cluster. Hence, we will be
having, say K clusters at start. The number of data points will also be
K at start.
• Step 2
• Step 2.1 − a big cluster by joining two closet datapoints. This will result
in total of K-1 clusters.
• Step 2.2 − To form more clusters, we need to join two closet clusters.
This will result in total of K-2 clusters.
• Step 2.3 − To form one big cluster repeat the above three steps until K
would become 0 i.e. no more data points left to join.
• Step 3 − After making one single big cluster, dendrograms will be
used to divide into multiple clusters depending upon the problem.
1
2
3
4
5
6
7
8
9
10
(1,3,5,7,9) identify the two clusters that are closest together (Euclidean distance)
(2,4,6,8,10) merge the two most similar clusters.
The main output of Hierarchical Clustering is a
dendrogram
METRICS BETWEEN CLUSTERS
• Measures of distance (similarity): the distance between two clusters
• computed based on length of the straight line drawn from one cluster to another.
• This is commonly referred to as the Euclidean distance. Many other distance
metrics have been developed.
• Linkage Criteria: determine from where distance is computed.
• single-linkage : computed between the two most similar parts of a cluster
• complete-linkage: computed between the two least similar bits of a cluster
• mean or average-linkage : the center of the clusters
• some other criterion.
• Where there are no clear theoretical justifications for choice of linkage
criteria, Ward’s method is the sensible default. This method works out
which observations to group based on reducing the sum of squared
distances of each observation from the average observation in a cluster.
AGGLOMERATIVE VERSUS DIVISIVE
ALGORITHMS
• Hierarchical clustering typically works by sequentially merging similar
clusters, as shown above. This is known as agglomerative hierarchical
clustering (button-up).
• By initially grouping all the observations into one cluster, and then
successively splitting these clusters (top-down). This is known as divisive
hierarchical clustering. Divisive clustering is rarely done in practice.
WHAT ARE THE STRENGTHS AND
WEAKNESSES OF HIERARCHICAL
CLUSTERING?
• The strengths of hierarchical clustering are that it is easy to understand and
easy to do. There are four types of clustering algorithms in widespread
use: hierarchical clustering, k-means cluster analysis, latent class
analysis, and self-organizing maps. The math of hierarchical clustering is the
easiest to understand.
• The weaknesses are that it rarely provides the best solution, it involves lots of
arbitrary decisions, it does not work with missing data, it works poorly with
mixed data types, it does not work well on very large data sets, and its main
output, the dendrogram, is commonly misinterpreted.
ROLE OF DENDROGRAMS IN
AGGLOMERATIVE HIERARCHICAL
CLUSTERING
original datapoints distribution dendrograms of these datapoints
ROLE OF DENDROGRAMS IN
AGGLOMERATIVE HIERARCHICAL
CLUSTERING
 once the big cluster is formed, the longest vertical
distance is selected, which is then drawn through it.
 As the horizontal line crosses the blue line at two
points, the number of clusters would be two.
The above diagram shows the two
clusters from our datapoints.
DISCUSSION
 Basically the horizontal line is a
threshold, which defines the minimum
distance required to be a separate
cluster. If we draw a line further down,
the threshold required to be a new
cluster will be decreased and more
clusters will be formed as see in the
image right.
 In the plot, the horizontal line passes
through four vertical lines resulting in
four clusters: cluster of points 6,7,8, 10,
cluster of points 3,2,4, 1, points 9, and
5 will be treated as single point clusters.
EX. CLUSTERS OF THE DATA POINT IN PIMA
INDIAN DIABETES DATASET
Pima Indian Diabetes Dataset Prediction by Hierarchy-based algorithm
EX. CLUSTERS OF THE DATA POINT IN
SHOPPING TRENDS DATASET
Draw a horizontal line that passes through longest
vertical distances without a horizontal line, we get
5 clusters.
Original data set.
DISCUSSION
 The data points in the bottom right belong
to the customers with high salaries but low
spending. These are the customers that
spend their money carefully.
 The customers at top right (green data
points), these are the customers with high
salaries and high spending. These are the
type of customers that companies target.
 The customers in the middle (blue data
points) are the ones with average income
and average salaries. The highest numbers
of customers belong to this category.
Salary index
Spending
index

Unsupervised Learning-Clustering Algorithms.pptx

  • 1.
  • 2.
    UNSUPERVISED LEARNING-CLUSTERING ALGORITHMS • Thesemethods are used to find similarity and/or features as well as the relationship patterns among data samples, and then cluster those samples into groups having similarity based on features, i.e. How are they grouped? • Clustering is important because it determines the intrinsic grouping among the present unlabeled data. • They basically make some assumptions about data points to constitute their similarity. Each assumption will construct differently but equally valid clusters.
  • 3.
    TRADITIONAL CLUSTERING ALGORITHMS A ComprehensiveSurvey of Clustering Algorithms Xu, D. & Tian, Y. Ann. Data. Sci. (2015) 2: 165.
  • 4.
    CLUSTERING ALGORITHMS-HIERARCHY BASED • Theclusters forms a tree type structure based on the hierarchy where new clusters are formed using the previously formed one. • It is divided into two category: Agglomerative (bottom up approach) Divisive (top down approach) . • Examples CURE (Clustering Using Representatives), BIRCH (Balanced Iterative Reducing Clustering and using Hierarchies) etc. A vertebrate is an animal with a spinal cord surrounded by cartilage or bone.
  • 5.
    CATEGORIES OF HIERARCHICAL ALGORITHMS •Agglomerative hierarchical algorithms − each data point is treated as a single cluster and then successively merge or agglomerate (bottom-up approach) the pairs of clusters. The hierarchy of the clusters is represented as a dendrogram or tree structure. • Divisive hierarchical algorithms − all the data points are treated as one big cluster and the process of clustering involves dividing (Top-down approach) the one big cluster into various small clusters.
  • 6.
    STEPS TO PERFORMAGGLOMERATIVE HIERARCHICAL CLUSTERING • The steps to perform the same is as follows − • Step 1 − Treat each data point as single cluster. Hence, we will be having, say K clusters at start. The number of data points will also be K at start. • Step 2 • Step 2.1 − a big cluster by joining two closet datapoints. This will result in total of K-1 clusters. • Step 2.2 − To form more clusters, we need to join two closet clusters. This will result in total of K-2 clusters. • Step 2.3 − To form one big cluster repeat the above three steps until K would become 0 i.e. no more data points left to join. • Step 3 − After making one single big cluster, dendrograms will be used to divide into multiple clusters depending upon the problem.
  • 7.
    1 2 3 4 5 6 7 8 9 10 (1,3,5,7,9) identify thetwo clusters that are closest together (Euclidean distance) (2,4,6,8,10) merge the two most similar clusters. The main output of Hierarchical Clustering is a dendrogram
  • 8.
    METRICS BETWEEN CLUSTERS •Measures of distance (similarity): the distance between two clusters • computed based on length of the straight line drawn from one cluster to another. • This is commonly referred to as the Euclidean distance. Many other distance metrics have been developed. • Linkage Criteria: determine from where distance is computed. • single-linkage : computed between the two most similar parts of a cluster • complete-linkage: computed between the two least similar bits of a cluster • mean or average-linkage : the center of the clusters • some other criterion. • Where there are no clear theoretical justifications for choice of linkage criteria, Ward’s method is the sensible default. This method works out which observations to group based on reducing the sum of squared distances of each observation from the average observation in a cluster.
  • 9.
    AGGLOMERATIVE VERSUS DIVISIVE ALGORITHMS •Hierarchical clustering typically works by sequentially merging similar clusters, as shown above. This is known as agglomerative hierarchical clustering (button-up). • By initially grouping all the observations into one cluster, and then successively splitting these clusters (top-down). This is known as divisive hierarchical clustering. Divisive clustering is rarely done in practice.
  • 10.
    WHAT ARE THESTRENGTHS AND WEAKNESSES OF HIERARCHICAL CLUSTERING? • The strengths of hierarchical clustering are that it is easy to understand and easy to do. There are four types of clustering algorithms in widespread use: hierarchical clustering, k-means cluster analysis, latent class analysis, and self-organizing maps. The math of hierarchical clustering is the easiest to understand. • The weaknesses are that it rarely provides the best solution, it involves lots of arbitrary decisions, it does not work with missing data, it works poorly with mixed data types, it does not work well on very large data sets, and its main output, the dendrogram, is commonly misinterpreted.
  • 11.
    ROLE OF DENDROGRAMSIN AGGLOMERATIVE HIERARCHICAL CLUSTERING original datapoints distribution dendrograms of these datapoints
  • 12.
    ROLE OF DENDROGRAMSIN AGGLOMERATIVE HIERARCHICAL CLUSTERING  once the big cluster is formed, the longest vertical distance is selected, which is then drawn through it.  As the horizontal line crosses the blue line at two points, the number of clusters would be two. The above diagram shows the two clusters from our datapoints.
  • 13.
    DISCUSSION  Basically thehorizontal line is a threshold, which defines the minimum distance required to be a separate cluster. If we draw a line further down, the threshold required to be a new cluster will be decreased and more clusters will be formed as see in the image right.  In the plot, the horizontal line passes through four vertical lines resulting in four clusters: cluster of points 6,7,8, 10, cluster of points 3,2,4, 1, points 9, and 5 will be treated as single point clusters.
  • 14.
    EX. CLUSTERS OFTHE DATA POINT IN PIMA INDIAN DIABETES DATASET Pima Indian Diabetes Dataset Prediction by Hierarchy-based algorithm
  • 15.
    EX. CLUSTERS OFTHE DATA POINT IN SHOPPING TRENDS DATASET Draw a horizontal line that passes through longest vertical distances without a horizontal line, we get 5 clusters. Original data set.
  • 16.
    DISCUSSION  The datapoints in the bottom right belong to the customers with high salaries but low spending. These are the customers that spend their money carefully.  The customers at top right (green data points), these are the customers with high salaries and high spending. These are the type of customers that companies target.  The customers in the middle (blue data points) are the ones with average income and average salaries. The highest numbers of customers belong to this category. Salary index Spending index