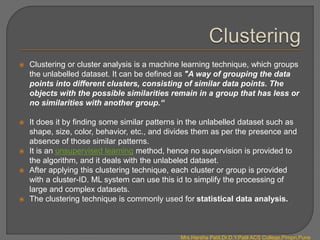
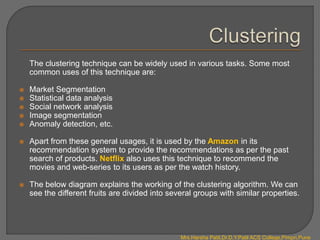
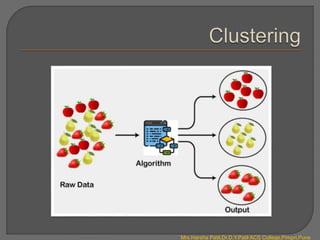
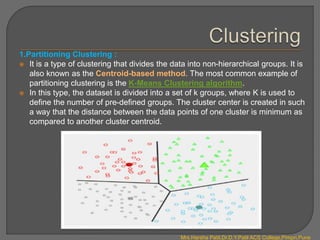
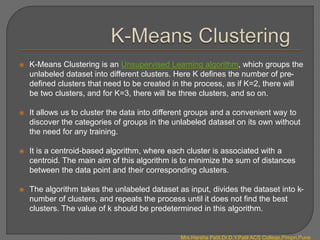
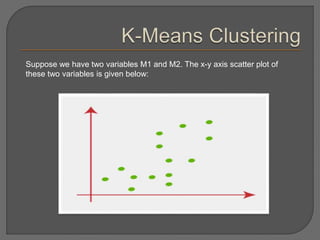
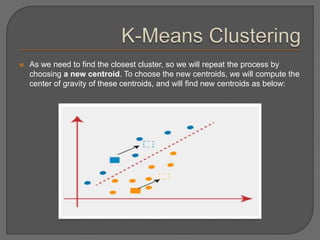
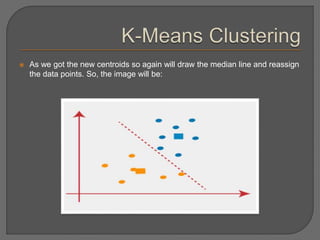
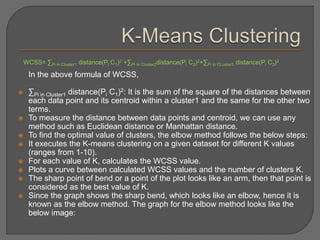
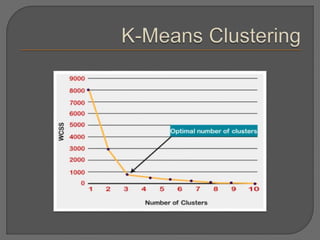
2. Clustering or cluster analysis is a machine learning technique, which groups
the unlabelled dataset. It can be defined as "A way of grouping the data
points into different clusters, consisting of similar data points. The
objects with the possible similarities remain in a group that has less or
no similarities with another group.“
It does it by finding some similar patterns in the unlabelled dataset such as
shape, size, color, behavior, etc., and divides them as per the presence and
absence of those similar patterns.
It is an unsupervised learning method, hence no supervision is provided to
the algorithm, and it deals with the unlabeled dataset.
After applying this clustering technique, each cluster or group is provided
with a cluster-ID. ML system can use this id to simplify the processing of
large and complex datasets.
The clustering technique is commonly used for statistical data analysis.
Mrs.Harsha Patil,Dr.D.Y.Patil ACS College,Pimpri,Pune
3. The clustering technique can be widely used in various tasks. Some most
common uses of this technique are:
Market Segmentation
Statistical data analysis
Social network analysis
Image segmentation
Anomaly detection, etc.
Apart from these general usages, it is used by the Amazon in its
recommendation system to provide the recommendations as per the past
search of products. Netflix also uses this technique to recommend the
movies and web-series to its users as per the watch history.
The below diagram explains the working of the clustering algorithm. We can
see the different fruits are divided into several groups with similar properties.
Mrs.Harsha Patil,Dr.D.Y.Patil ACS College,Pimpri,Pune
5. Types of Clustering Methods
The clustering methods are broadly divided into Hard Clustering (data point
belongs to only one group) and Soft Clustering (data points can belong to
another group also). But there are also other various approaches of
Clustering exist. Below are the main clustering methods used in Machine
learning:
Partitioning Clustering
Density-Based Clustering
Distribution Model-Based Clustering
Hierarchical Clustering
Fuzzy Clustering
Mrs.Harsha Patil,Dr.D.Y.Patil ACS College,Pimpri,Pune
6. 1.Partitioning Clustering :
It is a type of clustering that divides the data into non-hierarchical groups. It is
also known as the Centroid-based method. The most common example of
partitioning clustering is the K-Means Clustering algorithm.
In this type, the dataset is divided into a set of k groups, where K is used to
define the number of pre-defined groups. The cluster center is created in such
a way that the distance between the data points of one cluster is minimum as
compared to another cluster centroid.
Mrs.Harsha Patil,Dr.D.Y.Patil ACS College,Pimpri,Pune
7. 2.Density-Based Clustering :
The density-based clustering method connects the highly-dense areas into
clusters, and the arbitrarily shaped distributions are formed as long as the
dense region can be connected. This algorithm does it by identifying different
clusters in the dataset and connects the areas of high densities into clusters.
The dense areas in data space are divided from each other by sparser areas.
These algorithms can face difficulty in clustering the data points if the dataset
has varying densities and high dimensions.
Mrs.Harsha Patil,Dr.D.Y.Patil ACS College,Pimpri,Pune
8. 3.Distribution Model-Based Clustering :
In the distribution model-based clustering method, the data is divided based
on the probability of how a dataset belongs to a particular distribution. The
grouping is done by assuming some distributions commonly Gaussian
Distribution.
The example of this type is the Expectation-Maximization Clustering
algorithm that uses Gaussian Mixture Models (GMM).
Mrs.Harsha Patil,Dr.D.Y.Patil ACS College,Pimpri,Pune
9. 4.Hierarchical Clustering :
Hierarchical clustering can be used as an alternative for the partitioned
clustering as there is no requirement of pre-specifying the number of
clusters to be created. In this technique, the dataset is divided into clusters
to create a tree-like structure, which is also called a dendrogram. The
observations or any number of clusters can be selected by cutting the tree at
the correct level. The most common example of this method is
the Agglomerative Hierarchical algorithm.
Mrs.Harsha Patil,Dr.D.Y.Patil ACS College,Pimpri,Pune
10. 5.Fuzzy Clustering :
Fuzzy clustering is a type of soft method in which a data object may belong
to more than one group or cluster. Each dataset has a set of membership
coefficients, which depend on the degree of membership to be in a
cluster. Fuzzy C-means algorithm is the example of this type of clustering;
it is sometimes also known as the Fuzzy k-means algorithm.
Applications of Clustering :
1.In Identification of Cancer Cells: The clustering algorithms are widely used
for the identification of cancerous cells. It divides the cancerous and non-
cancerous data sets into different groups.
2.In Search Engines: Search engines also work on the clustering technique.
The search result appears based on the closest object to the search query. It
does it by grouping similar data objects in one group that is far from the
other dissimilar objects. The accurate result of a query depends on the
quality of the clustering algorithm used.
Mrs.Harsha Patil,Dr.D.Y.Patil ACS College,Pimpri,Pune
11. 3.Customer Segmentation: It is used in market research to segment the
customers based on their choice and preferences.
4.In Biology: It is used in the biology stream to classify different species of
plants and animals using the image recognition technique.
5.In Land Use: The clustering technique is used in identifying the area of
similar lands use in the GIS database. This can be very useful to find that for
what purpose the particular land should be used, that means for which
purpose it is more suitable.
Mrs.Harsha Patil,Dr.D.Y.Patil ACS College,Pimpri,Pune
12. Mrs.Harsha Patil,Dr.D.Y.Patil ACS College,Pimpri,Pune
K-Means Clustering is an Unsupervised Learning algorithm, which groups the
unlabeled dataset into different clusters. Here K defines the number of pre-
defined clusters that need to be created in the process, as if K=2, there will
be two clusters, and for K=3, there will be three clusters, and so on.
It allows us to cluster the data into different groups and a convenient way to
discover the categories of groups in the unlabeled dataset on its own without
the need for any training.
It is a centroid-based algorithm, where each cluster is associated with a
centroid. The main aim of this algorithm is to minimize the sum of distances
between the data point and their corresponding clusters.
The algorithm takes the unlabeled dataset as input, divides the dataset into k-
number of clusters, and repeats the process until it does not find the best
clusters. The value of k should be predetermined in this algorithm.
13. The k-means clustering algorithm mainly performs two tasks:
Determines the best value for K center points or centroids by an iterative
process.
Assigns each data point to its closest k-center. Those data points which are
near to the particular k-center, create a cluster.
Hence each cluster has data points with some commonalities, and it is away
from other clusters. The below diagram explains the working of the K-means
Clustering Algorithm:
Mrs.Harsha Patil,Dr.D.Y.Patil ACS College,Pimpri,Pune
15. How does the K-Means Algorithm Work?
The working of the K-Means algorithm is explained in the below steps:
Step-1: Select the number K to decide the number of clusters.
Step-2: Select random K points or centroids. (It can be other from the input
dataset).
Step-3: Assign each data point to their closest centroid, which will form the
predefined K clusters.
Step-4: Calculate the variance and place a new centroid of each cluster.
Step-5: Repeat the third steps, which means reassign each datapoint to the new
closest centroid of each cluster.
Step-6: If any reassignment occurs, then go to step-4 else go to FINISH.
Step-7: The model is ready.
Mrs.Harsha Patil,Dr.D.Y.Patil ACS College,Pimpri,Pune
16. Suppose we have two variables M1 and M2. The x-y axis scatter plot of
these two variables is given below:
17. Let's take number k of clusters, i.e., K=2, to identify the dataset and to put
them into different clusters. It means here we will try to group these datasets
into two different clusters.
We need to choose some random k points or centroid to form the cluster.
These points can be either the points from the dataset or any other point.
So, here we are selecting the below two points as k points, which are not the
part of our dataset. Consider the below image:
18. Now we will assign each data point of the scatter plot to its closest K-point
or centroid. We will compute it by applying some mathematics that we have
studied to calculate the distance between two points. So, we will draw a
median between both the centroids. Consider the below image:
19. From the above image, it is clear that points left side of the line is near to the
K1 or blue centroid, and points to the right of the line are close to the yellow
centroid. Let's color them as blue and yellow for clear visualization.
20. As we need to find the closest cluster, so we will repeat the process by
choosing a new centroid. To choose the new centroids, we will compute the
center of gravity of these centroids, and will find new centroids as below:
21. Next, we will reassign each datapoint to the new centroid. For this, we will
repeat the same process of finding a median line. The median will be like
below image:
22. From the above image, we can see, one yellow point is on the left side of the
line, and two blue points are right to the line. So, these three points will be
assigned to new centroids.
23. As reassignment has taken place, so we will again go to the step-4, which is
finding new centroids or K-points.
We will repeat the process by finding the center of gravity of centroids, so
the new centroids will be as shown in the below image:
24. As we got the new centroids so again will draw the median line and reassign
the data points. So, the image will be:
25. We can see in the above image; there are no dissimilar data points on either
side of the line, which means our model is formed. Consider the below
image:
26. As our model is ready, so we can now remove the assumed centroids, and
the two final clusters will be as shown in the below image:
27. Choose the value of "K number of clusters" in K-means Clustering :
The performance of the K-means clustering algorithm depends upon highly
efficient clusters that it forms. But choosing the optimal number of clusters
is a big task. There are some different ways to find the optimal number of
clusters, but here we are discussing the most appropriate method to find
the number of clusters or value of K. The method is given below:
Elbow Method :
The Elbow method is one of the most popular ways to find the optimal
number of clusters. This method uses the concept of WCSS
value. WCSS stands for Within Cluster Sum of Squares, which defines
the total variations within a cluster. The formula to calculate the value of
WCSS (for 3 clusters) is given below:
28. WCSS= ∑Pi in Cluster1 distance(Pi C1)2 +∑Pi in Cluster2distance(Pi C2)2+∑Pi in CLuster3 distance(Pi C3)2
In the above formula of WCSS,
∑Pi in Cluster1 distance(Pi C1)2: It is the sum of the square of the distances between
each data point and its centroid within a cluster1 and the same for the other two
terms.
To measure the distance between data points and centroid, we can use any
method such as Euclidean distance or Manhattan distance.
To find the optimal value of clusters, the elbow method follows the below steps:
It executes the K-means clustering on a given dataset for different K values
(ranges from 1-10).
For each value of K, calculates the WCSS value.
Plots a curve between calculated WCSS values and the number of clusters K.
The sharp point of bend or a point of the plot looks like an arm, then that point is
considered as the best value of K.
Since the graph shows the sharp bend, which looks like an elbow, hence it is
known as the elbow method. The graph for the elbow method looks like the
below image:
29.
30. Hierarchical clustering is another unsupervised machine learning algorithm,
which is used to group the unlabeled datasets into a cluster and also known
as hierarchical cluster analysis or HCA.
In this algorithm, we develop the hierarchy of clusters in the form of a tree,
and this tree-shaped structure is known as the dendrogram.
Sometimes the results of K-means clustering and hierarchical clustering may
look similar, but they both differ depending on how they work. As there is no
requirement to predetermine the number of clusters as we did in the K-
Means algorithm.
The hierarchical clustering technique has two approaches:
Agglomerative: Agglomerative is a bottom-up approach, in which the
algorithm starts with taking all data points as single clusters and merging
them until one cluster is left.
Divisive: Divisive algorithm is the reverse of the agglomerative algorithm as
it is a top-down approach.
Mrs.Harsha Patil,Dr.D.Y.Patil ACS College,Pimpri,Pune
31. 1.Agglomerative Hierarchical clustering :
The agglomerative hierarchical clustering algorithm is a popular example of
HCA. To group the datasets into clusters, it follows the bottom-up
approach. It means, this algorithm considers each dataset as a single
cluster at the beginning, and then start combining the closest pair of clusters
together. It does this until all the clusters are merged into a single cluster
that contains all the datasets.
This hierarchy of clusters is represented in the form of the dendrogram.
Mrs.Harsha Patil,Dr.D.Y.Patil ACS College,Pimpri,Pune
32. Working of Agglomerative Hierarchical clustering :
The working of the AHC algorithm can be explained using the below steps:
Step-1: Create each data point as a single cluster. Let's say there are N data
points, so the number of clusters will also be N.
Mrs.Harsha Patil,Dr.D.Y.Patil ACS College,Pimpri,Pune
33. Step-2: Take two closest data points or clusters and merge them to form one
cluster. So, there will now be N-1 clusters.
34. Mrs.Harsha Patil,Dr.D.Y.Patil ACS College,Pimpri,Pune
Step-3: Again, take the two closest clusters and merge them together to form
one cluster. There will be N-2 clusters.
35. Step-4: Repeat Step 3 until only one cluster left. So, we will get the following
clusters. Consider the below images:
Mrs.Harsha Patil,Dr.D.Y.Patil ACS College,Pimpri,Pune
37. Step-5: Once all the clusters are combined into one big cluster, develop
the dendrogram to divide the clusters as per the problem.
38. Mrs.Harsha Patil,Dr.D.Y.Patil ACS College,Pimpri,Pune
Measure for the distance between two clusters :
As we have seen, the closest distance between the two clusters is crucial
for the hierarchical clustering. There are various ways to calculate the
distance between two clusters, and these ways decide the rule for
clustering. These measures are called Linkage methods. Some of the
popular linkage methods are given below:
1.Single Linkage: It is the Shortest Distance between the closest points of
the clusters. Consider the below image:
39. Mrs.Harsha Patil,Dr.D.Y.Patil ACS College,Pimpri,Pune
2.Complete Linkage: It is the farthest distance between the two points of
two different clusters. It is one of the popular linkage methods as it forms
tighter clusters than single-linkage.
40. 3.Average Linkage: It is the linkage method in which the distance between
each pair of datasets is added up and then divided by the total number of
datasets to calculate the average distance between two clusters. It is also
one of the most popular linkage methods.
4.Centroid Linkage: It is the linkage method in which the distance between
the centroid of the clusters is calculated. Consider the below image:
Mrs.Harsha Patil,Dr.D.Y.Patil ACS College,Pimpri,Pune
41. Working of Dendrogram in Hierarchical clustering :
The dendrogram is a tree-like structure that is mainly used to store each
step as a memory that the HC algorithm performs. In the dendrogram plot,
the Y-axis shows the Euclidean distances between the data points, and the
x-axis shows all the data points of the given dataset.
The working of the dendrogram can be explained using the below diagram:
Mrs.Harsha Patil,Dr.D.Y.Patil ACS College,Pimpri,Pune
43. In the above diagram, the left part is showing how clusters are created in
agglomerative clustering, and the right part is showing the corresponding
dendrogram.
As we have discussed above, firstly, the data points P2 and P3 combine
together and form a cluster, correspondingly a dendrogram is created, which
connects P2 and P3 with a rectangular shape. The height is decided
according to the Euclidean distance between the data points.
In the next step, P5 and P6 form a cluster, and the corresponding
dendrogram is created. It is higher than of previous, as the Euclidean
distance between P5 and P6 is a little bit greater than the P2 and P3.
Again, two new dendrogram are created that combine P1, P2, and P3 in one
dendrogram, and P4, P5, and P6, in another dendrogram.
At last, the final dendrogram is created that combines all the data points
together.
We can cut the dendrogram tree structure at any level as per our
requirement.
Mrs.Harsha Patil,Dr.D.Y.Patil ACS College,Pimpri,Pune