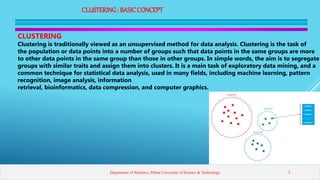
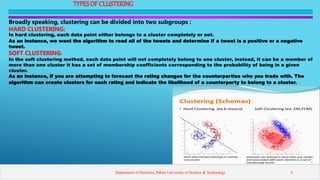
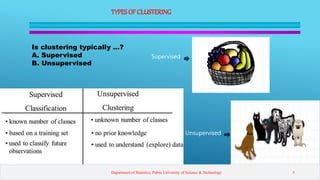
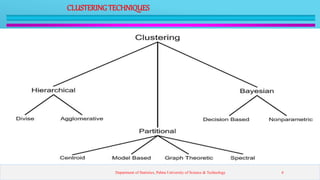
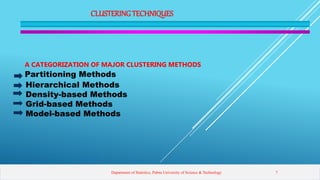
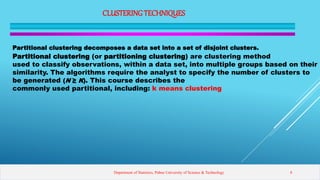
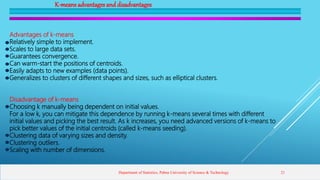
This presentation introduces clustering analysis and the k-means clustering technique. It defines clustering as an unsupervised method to segment data into groups with similar traits. The presentation outlines different clustering types (hard vs soft), techniques (partitioning, hierarchical, etc.), and describes the k-means algorithm in detail through multiple steps. It discusses requirements for clustering, provides examples of applications, and reviews advantages and disadvantages of k-means clustering.
k-means clustering aims to partition n observations into k clusters in which each observation belongs to the cluster with the nearest mean, serving as a prototype of the cluster. This results in a partitioning of the data space into Voronoi cells.
This is very simple introduction to Clustering with some real world example. At the end of lecture I use stackOverflow API to test some clustering. I also wants to try facebook but it has some problem with it's API
Classification of common clustering algorithm and techniques, e.g., hierarchical clustering, distance measures, K-means, Squared error, SOFM, Clustering large databases.
Supervised learning: discover patterns in the data that relate data attributes with a target (class) attribute.
These patterns are then utilized to predict the values of the target attribute in future data instances.
Unsupervised learning: The data have no target attribute.
We want to explore the data to find some intrinsic structures in them.
K-Nearest neighbor is one of the most commonly used classifier based in lazy learning. It is one of the most commonly used methods in recommendation systems and document similarity measures. It mainly uses Euclidean distance to find the similarity measures between two data points.
K-Means clustering uses an iterative procedure which is very much sensitive and dependent upon the initial centroids. The initial centroids in the k-means clustering are chosen randomly, and hence the clustering also changes with respect to the initial centroids. This paper tries to overcome this problem of random selection of centroids and hence change of clusters with a premeditated selection of initial centroids. We have used the iris, abalone and wine data sets to demonstrate that the proposed method of finding the initial centroids and using the centroids in k-means algorithm improves the clustering performance. The clustering also remains the same in every run as the initial centroids are not randomly selected but through premeditated method.
Comparison Between Clustering Algorithms for Microarray Data AnalysisIOSR Journals
Currently, there are two techniques used for large-scale gene-expression profiling; microarray and
RNA-Sequence (RNA-Seq).This paper is intended to study and compare different clustering algorithms that used
in microarray data analysis. Microarray is a DNA molecules array which allows multiple hybridization
experiments to be carried out simultaneously and trace expression levels of thousands of genes. It is a highthroughput
technology for gene expression analysis and becomes an effective tool for biomedical research.
Microarray analysis aims to interpret the data produced from experiments on DNA, RNA, and protein
microarrays, which enable researchers to investigate the expression state of a large number of genes. Data
clustering represents the first and main process in microarray data analysis. The k-means, fuzzy c-mean, selforganizing
map, and hierarchical clustering algorithms are under investigation in this paper. These algorithms
are compared based on their clustering model.
Experimental study of Data clustering using k- Means and modified algorithmsIJDKP
The k- Means clustering algorithm is an old algorithm that has been intensely researched owing to its ease
and simplicity of implementation. Clustering algorithm has a broad attraction and usefulness in
exploratory data analysis. This paper presents results of the experimental study of different approaches to
k- Means clustering, thereby comparing results on different datasets using Original k-Means and other
modified algorithms implemented using MATLAB R2009b. The results are calculated on some performance
measures such as no. of iterations, no. of points misclassified, accuracy, Silhouette validity index and
execution time
Step by step operations by which we make a group of objects in which attributes
of all the objects are nearly similar, known as clustering. So, a cluster is a collection of
objects that acquire nearly same attribute values. The property of an object in a cluster is
similar to other objects in same cluster but different with objects of other clusters.
Clustering is used in wide range of applications like pattern recognition, image processing,
data analysis, machine learning etc. Nowadays, more attention has been put on categorical
data rather than numerical data. Where, the range of numerical attributes organizes in a
class like small, medium, high, and so on. There is wide range of algorithm that used to
make clusters of given categorical data. Our approach is to enhance the working on well-
known clustering algorithm k-modes to improve accuracy of algorithm. We proposed a new
approach named “High Accuracy Clustering Algorithm for Categorical datasets”.
A HYBRID MODEL FOR MINING MULTI DIMENSIONAL DATA SETSEditor IJCATR
This paper presents a hybrid data mining approach based on supervised learning and unsupervised learning to identify the closest data patterns in the data base. This technique enables to achieve the maximum accuracy rate with minimal complexity. The proposed algorithm is compared with traditional clustering and classification algorithm and it is also implemented with multidimensional datasets. The implementation results show better prediction accuracy and reliability.
Unsupervised learning Algorithms and Assumptionsrefedey275
Topics :
Introduction to unsupervised learning
Unsupervised learning Algorithms and Assumptions
K-Means algorithm – introduction
Implementation of K-means algorithm
Hierarchical Clustering – need and importance of hierarchical clustering
Agglomerative Hierarchical Clustering
Working of dendrogram
Steps for implementation of AHC using Python
Gaussian Mixture Models – Introduction, importance and need of the model
Normal , Gaussian distribution
Implementation of Gaussian mixture model
Understand the different distance metrics used in clustering
Euclidean, Manhattan, Cosine, Mahala Nobis
Features of a Cluster – Labels, Centroids, Inertia, Eigen vectors and Eigen values
Principal component analysis
Supervised learning (classification)
Supervision: The training data (observations, measurements, etc.) are accompanied by labels indicating the class of the observations
New data is classified based on the training set
Unsupervised learning (clustering)
The class labels of training data is unknown
Given a set of measurements, observations, etc. with the aim of establishing the existence of classes or clusters in the data
Types of Hierarchical Clustering
There are mainly two types of hierarchical clustering:
Agglomerative hierarchical clustering
Divisive Hierarchical clustering
A distribution in statistics is a function that shows the possible values for a variable and how often they occur.
In probability theory and statistics, the Normal Distribution, also called the Gaussian Distribution.
is the most significant continuous probability distribution.
Sometimes it is also called a bell curve.
Data mining is utilized to manage huge measure of information which are put in the data ware houses and databases, to discover required information and data. Numerous data mining systems have been proposed, for example, association rules, decision trees, neural systems, clustering, and so on. It has turned into the purpose of consideration from numerous years. A re-known amongst the available data mining strategies is clustering of the dataset. It is the most effective data mining method. It groups the dataset in number of clusters based on certain guidelines that are predefined. It is dependable to discover the connection between the distinctive characteristics of data.
In k-mean clustering algorithm, the function is being selected on the basis of the relevancy of the function for predicting the data and also the Euclidian distance between the centroid of any cluster and the data objects outside the cluster is being computed for the clustering the data points. In this work, author enhanced the Euclidian distance formula to increase the cluster quality.
The problem of accuracy and redundancy of the dissimilar points in the clusters remains in the improved k-means for which new enhanced approach is been proposed which uses the similarity function for checking the similarity level of the point before including it to the cluster.
International Journal of Engineering and Science Invention (IJESI)inventionjournals
International Journal of Engineering and Science Invention (IJESI) is an international journal intended for professionals and researchers in all fields of computer science and electronics. IJESI publishes research articles and reviews within the whole field Engineering Science and Technology, new teaching methods, assessment, validation and the impact of new technologies and it will continue to provide information on the latest trends and developments in this ever-expanding subject. The publications of papers are selected through double peer reviewed to ensure originality, relevance, and readability. The articles published in our journal can be accessed online.
Similar to Presentation on K-Means Clustering (20)
As Europe's leading economic powerhouse and the fourth-largest hashtag#economy globally, Germany stands at the forefront of innovation and industrial might. Renowned for its precision engineering and high-tech sectors, Germany's economic structure is heavily supported by a robust service industry, accounting for approximately 68% of its GDP. This economic clout and strategic geopolitical stance position Germany as a focal point in the global cyber threat landscape.
In the face of escalating global tensions, particularly those emanating from geopolitical disputes with nations like hashtag#Russia and hashtag#China, hashtag#Germany has witnessed a significant uptick in targeted cyber operations. Our analysis indicates a marked increase in hashtag#cyberattack sophistication aimed at critical infrastructure and key industrial sectors. These attacks range from ransomware campaigns to hashtag#AdvancedPersistentThreats (hashtag#APTs), threatening national security and business integrity.
🔑 Key findings include:
🔍 Increased frequency and complexity of cyber threats.
🔍 Escalation of state-sponsored and criminally motivated cyber operations.
🔍 Active dark web exchanges of malicious tools and tactics.
Our comprehensive report delves into these challenges, using a blend of open-source and proprietary data collection techniques. By monitoring activity on critical networks and analyzing attack patterns, our team provides a detailed overview of the threats facing German entities.
This report aims to equip stakeholders across public and private sectors with the knowledge to enhance their defensive strategies, reduce exposure to cyber risks, and reinforce Germany's resilience against cyber threats.
Explore our comprehensive data analysis project presentation on predicting product ad campaign performance. Learn how data-driven insights can optimize your marketing strategies and enhance campaign effectiveness. Perfect for professionals and students looking to understand the power of data analysis in advertising. for more details visit: https://bostoninstituteofanalytics.org/data-science-and-artificial-intelligence/
Techniques to optimize the pagerank algorithm usually fall in two categories. One is to try reducing the work per iteration, and the other is to try reducing the number of iterations. These goals are often at odds with one another. Skipping computation on vertices which have already converged has the potential to save iteration time. Skipping in-identical vertices, with the same in-links, helps reduce duplicate computations and thus could help reduce iteration time. Road networks often have chains which can be short-circuited before pagerank computation to improve performance. Final ranks of chain nodes can be easily calculated. This could reduce both the iteration time, and the number of iterations. If a graph has no dangling nodes, pagerank of each strongly connected component can be computed in topological order. This could help reduce the iteration time, no. of iterations, and also enable multi-iteration concurrency in pagerank computation. The combination of all of the above methods is the STICD algorithm. [sticd] For dynamic graphs, unchanged components whose ranks are unaffected can be skipped altogether.
Adjusting primitives for graph : SHORT REPORT / NOTESSubhajit Sahu
Graph algorithms, like PageRank Compressed Sparse Row (CSR) is an adjacency-list based graph representation that is
Multiply with different modes (map)
1. Performance of sequential execution based vs OpenMP based vector multiply.
2. Comparing various launch configs for CUDA based vector multiply.
Sum with different storage types (reduce)
1. Performance of vector element sum using float vs bfloat16 as the storage type.
Sum with different modes (reduce)
1. Performance of sequential execution based vs OpenMP based vector element sum.
2. Performance of memcpy vs in-place based CUDA based vector element sum.
3. Comparing various launch configs for CUDA based vector element sum (memcpy).
4. Comparing various launch configs for CUDA based vector element sum (in-place).
Sum with in-place strategies of CUDA mode (reduce)
1. Comparing various launch configs for CUDA based vector element sum (in-place).
Opendatabay - Open Data Marketplace.pptxOpendatabay
Opendatabay.com unlocks the power of data for everyone. Open Data Marketplace fosters a collaborative hub for data enthusiasts to explore, share, and contribute to a vast collection of datasets.
First ever open hub for data enthusiasts to collaborate and innovate. A platform to explore, share, and contribute to a vast collection of datasets. Through robust quality control and innovative technologies like blockchain verification, opendatabay ensures the authenticity and reliability of datasets, empowering users to make data-driven decisions with confidence. Leverage cutting-edge AI technologies to enhance the data exploration, analysis, and discovery experience.
From intelligent search and recommendations to automated data productisation and quotation, Opendatabay AI-driven features streamline the data workflow. Finding the data you need shouldn't be a complex. Opendatabay simplifies the data acquisition process with an intuitive interface and robust search tools. Effortlessly explore, discover, and access the data you need, allowing you to focus on extracting valuable insights. Opendatabay breaks new ground with a dedicated, AI-generated, synthetic datasets.
Leverage these privacy-preserving datasets for training and testing AI models without compromising sensitive information. Opendatabay prioritizes transparency by providing detailed metadata, provenance information, and usage guidelines for each dataset, ensuring users have a comprehensive understanding of the data they're working with. By leveraging a powerful combination of distributed ledger technology and rigorous third-party audits Opendatabay ensures the authenticity and reliability of every dataset. Security is at the core of Opendatabay. Marketplace implements stringent security measures, including encryption, access controls, and regular vulnerability assessments, to safeguard your data and protect your privacy.
1. Welcome To My Presentation
On
Clustering Analysis
Submitted By
Ruhul Amin
Department of Statistics
Pabna University of Science & Technology
Department of Statistics, Pabna University of Science & Technology
2. OUTLINEOF PRESENTATION
Clustering : basic concept
Types of clustering
Clustering techniques
K-means clustering
K-means clustering algorithm
Requirements
Applications
Advantages & Disadvantages
Conclusion
Department of Statistics, Pabna University of Science & Technology 2
3. CLUSTERING: BASICCONCEPT
CLUSTERING
Clustering is traditionally viewed as an unsupervised method for data analysis. Clustering is the task of
the population or data points into a number of groups such that data points in the same groups are more
to other data points in the same group than those in other groups. In simple words, the aim is to segregate
groups with similar traits and assign them into clusters. It is a main task of exploratory data mining, and a
common technique for statistical data analysis, used in many fields, including machine learning, pattern
recognition, image analysis, information
retrieval, bioinformatics, data compression, and computer graphics.
Department of Statistics, Pabna University of Science & Technology 3
4. TYPESOF CLUSTERING
Broadly speaking, clustering can be divided into two subgroups :
HARD CLUSTERING:
In hard clustering, each data point either belongs to a cluster completely or not.
As an instance, we want the algorithm to read all of the tweets and determine if a tweet is a positive or a negative
tweet.
SOFT CLUSTERING:
In the soft clustering method, each data point will not completely belong to one cluster, instead, it can be a member of
more than one cluster it has a set of membership coefficients corresponding to the probability of being in a given
cluster.
As an instance, if you are attempting to forecast the rating changes for the counterparties who you trade with. The
algorithm can create clusters for each rating and indicate the likelihood of a counterparty to belong to a cluster.
Department of Statistics, Pabna University of Science & Technology 4
5. TYPES OF CLUSTERING
Is clustering typically …?
A. Supervised
B. Unsupervised
Department of Statistics, Pabna University of Science & Technology 5
Supervised
Unsupervised
7. CLUSTERINGTECHNIQUES
A CATEGORIZATION OF MAJOR CLUSTERING METHODS
Partitioning Methods
Hierarchical Methods
Density-based Methods
Grid-based Methods
Model-based Methods
Department of Statistics, Pabna University of Science & Technology 7
8. CLUSTERINGTECHNIQUES
Partitional clustering decomposes a data set into a set of disjoint clusters.
Partitional clustering (or partitioning clustering) are clustering method
used to classify observations, within a data set, into multiple groups based on their
similarity. The algorithms require the analyst to specify the number of clusters to
be generated (N ≥ K). This course describes the
commonly used partitional, including: k means clustering
Department of Statistics, Pabna University of Science & Technology 8
9. K MEANSCLUSTERING
K-means clustering (Macqueen, 1967) is a method commonly used to automatically partition a data set
into k groups. It proceeds by selecting k initial cluster.
K-means clustering is a type of unsupervised learning, which is used when you have unlabeled data (i.E., Data without defined
categories or groups). The goal of this algorithm is to find groups in the data, with the number of groups represented by the
variable K (N ≥ K). The algorithm works iteratively to assign each data point to one of K groups based on the features that are
provided. Data points are clustered based on feature similarity. The results of the k-means clustering algorithm are:
1.the centroids of the K clusters, which can be used to label new data.
2.labels for the training data (each data point is assigned to a single cluster).
.
Department of Statistics, Pabna University of Science & Technology 9
10. K MEANS CLUSTERING ALGORITHMS
AS, YOU CAN SEE, K-MEANS ALGORITHM IS COMPOSED OF 3 STEPS:
STEP 1: INITIALIZATION
The first thing k-means does, is randomly choose K examples (data points) from the dataset as initial
centroids and that’s simply because it does not know yet where the center of each cluster is. (A
centroid is the center of a cluster).
STEP 2: CLUSTER ASSIGNMENT
Then, all the data points that are the closest (similar) to a centroid will create a cluster. If we’re using
the Euclidean distance between data points and every centroid, a straight line is drawn between two
centroids, then a perpendicular bisector (boundary line) divides this line into two clusters.
STEP 3: MOVE THE CENTROID
Now, we have new clusters, that need centers. A centroid’s new value is going to be the mean of all the
examples (data points) in a cluster.
We’ll keep repeating step 2 and 3 until the centroids stop moving, in other words, k-means algorithm is
converged.
Department of Statistics, Pabna University of Science & Technology 10
12. K MEANSCLUSTERINGALGORITHM
CLUSTER ANALYSIS – EXAMPLE
We will work with a real-number example of the well-known k-means clustering algorithm.
We will try to find clusters in the below dataset, consisting of 5 points.
Department of Statistics, Pabna University of Science & Technology 12
13. K MEANSCLUSTERINGALGORITHMS
STEP 1: SET CLUSTER QUANTITY
The k-means algorithm requires you to set a number of clusters k beforehand. Here, we take k=2(the data look like there
clusters – one on the bottom left and one on the top right).
STEP 2: ASSIGNMENT OF DATA POINTS
In the assignment step, each data point gets assigned to the nearest cluster centroid. The cluster centroids can be seen as
centers of gravity within each cluster. To start with, we chose random points as centroids. Here, we take point A(1,1)
Instead of taking actual data points, we could have taken completely random points as well.
To calculate the nearest cluster centroid for each data point, you need a distance measure. There is a large number of
available metrics doing the job. We will work with the ordinary Euclidian distance.
Department of Statistics, Pabna University of Science & Technology 13
14. K MEANSCLUSTERINGALGORITHMS
STEP 3: MOVE THE CENTROID
Now, we have new clusters, that need centers. A centroid’s new value is going to be the mean of
all the examples in a cluster.
We’ll keep repeating step 2 and 3 until the centroids stop moving, in other words, k-means
algorithm is converged.
Department of Statistics, Pabna University of Science & Technology 14
18. Requirements
Requirements
Requirements of clustering in data mining:-
1. Scalability - we need highly scalable clustering algorithms to deal with large databases.
2. Ability to deal with different kind of attributes - algorithms should be capable to be applied on any kind of data such as
interval based (numerical) data, categorical, binary data.
3. Discovery of clusters with attribute shape - the clustering algorithm should be capable of detect cluster of arbitrary
shape. The should not be bounded to only distance measures that tend to find spherical cluster of small size.
4. High dimensionality - the clustering algorithm should not only be able to handle low- dimensional data but also the high
dimensional space.
5. Ability to deal with noisy data - databases contain noisy, missing or erroneous data. Some algorithms are sensitive to such
data and may lead to poor quality clusters.
6. Interpretability - the clustering results should be interpretable, comprehensible and usable.
Department of Statistics, Pabna University of Science & Technology 18
19. APPLICATIONS
HERE ARE 7 EXAMPLES OF CLUSTERING ALGORITHMS IN ACTION.
1. IDENTIFYING FAKE NEWS
How clustering works:
The way that the algorithm works is by taking in the content of the fake news article, the corpus,
examining the words used and then clustering them. These clusters are what helps the algorithm
determine which pieces are genuine and which are fake news. Certain words are found more
commonly in sensationalized, click-bait articles. When you see a high percentage of specific
terms in an article, it gives a higher probability of the material being fake news.
2. SPAM FILTER
How clustering works:
k-means clustering techniques have proven to be an effective way of identifying spam. The way
that it works is by looking at the different sections of the email (header, sender, and content). The
data is then grouped together.
These groups can then be classified to identify which are spam. Including clustering in the
classification process improves the accuracy of the filter to 97%. This is excellent news for
people who want to be sure they’re not missing out on your favorite newsletters and offers.
Department of Statistics, Pabna University of Science & Technology 19
20. APPLICATIONS
3. ASTRONOMY:
It helps to find groups of similar stars and galaxies.
4. GENOMICS:
It can be used to derive plant and animal taxonomies, categorize genes with similar functionality and gain insight into structures inherent in
populations.
5. CLASSIFYING NETWORK TRAFFIC
How clustering works:
k-means clustering is used to group together characteristics of the traffic sources. When the clusters are created, you can then classify the traffic
types. The process is faster and more accurate than the previous autoclass method. By having precise information on traffic sources, you are able
to grow your site and plan capacity effectively.
6. IDENTIFYING FRAUDULENT OR CRIMINAL ACTIVITY
How clustering works:
By analysing the GPS logs, the algorithm is able to group similar behaviors. Based on the characteristics of the groups you are then able to
classify them into those that are real and which are fraudulent.
7. DOCUMENT ANALYSIS
HOW CLUSTERING WORKS:
Hierarchical clustering has been used to solve this problem. The algorithm is able to look at the text and group it into different
themes. Using this technique, you can cluster and organize similar documents quickly using the characteristics identified in the
paragraph.
8.CALL RECORD DETAIL ANALYSIS
A call detail record (CDR) is the information captured by telecom companies during the call, SMS, and internet activity of a
customer.
Department of Statistics, Pabna University of Science & Technology 20
21. K-means advantages and disadvantages
Advantages of k-means
Relatively simple to implement.
Scales to large data sets.
Guarantees convergence.
Can warm-start the positions of centroids.
Easily adapts to new examples (data points).
Generalizes to clusters of different shapes and sizes, such as elliptical clusters.
Disadvantage of k-means
Choosing k manually being dependent on initial values.
For a low k, you can mitigate this dependence by running k-means several times with different
initial values and picking the best result. As k increases, you need advanced versions of k-means to
pick better values of the initial centroids (called k-means seeding).
Clustering data of varying sizes and density.
Clustering outliers.
Scaling with number of dimensions.
Department of Statistics, Pabna University of Science & Technology 21
22. CONCLUSION
Conclusion:
K means algorithm is useful for undirected knowledge discovery and is relatively simple.
K mean has found wide spread usage in lot of field raging from unsupervised learning of neural
,Pattern recognitions, classification analysis, Artificial intelligence ,Image processing and many others
Department of Statistics, Pabna University of Science & Technology 22