Downloaded 151 times


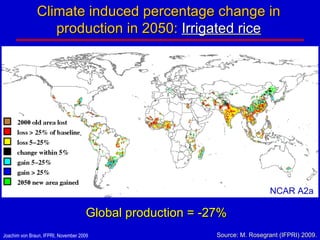
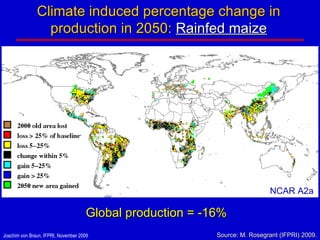
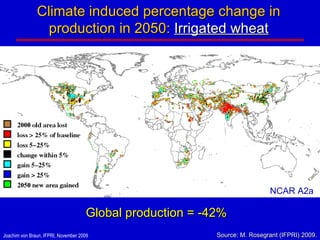
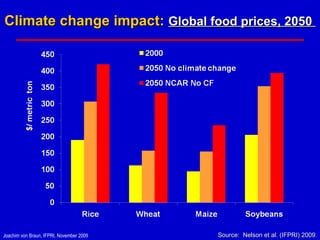
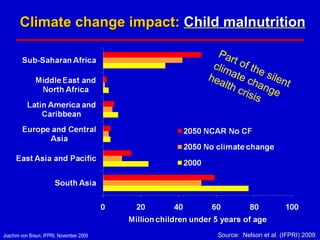
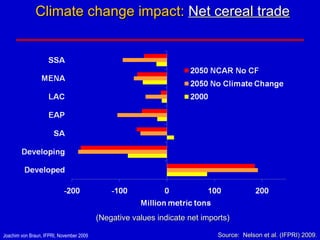
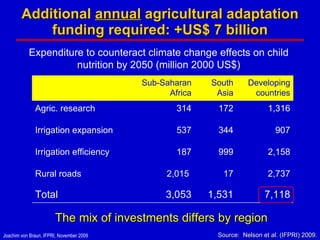
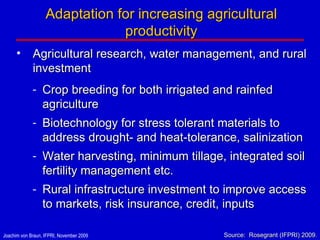
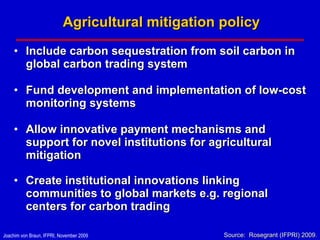
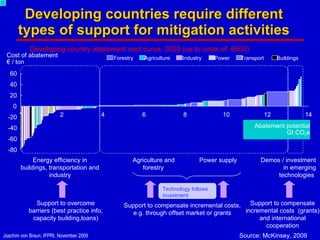

The document discusses the challenges of climate change and ensuring global food security. It argues that agriculture must be appropriately integrated into climate change agreements to address both climate change in the context of food security and food security in the context of climate change. Climate change is projected to reduce production of key crops like rice, maize and wheat by 2050 according to the models discussed, which could significantly increase food prices and malnutrition. Investments in agricultural adaptation and mitigation totaling $7 billion annually are needed to counteract the effects of climate change.


