Download to read offline
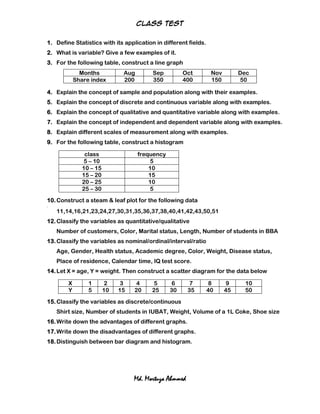


This document contains 18 questions about key concepts in statistics including: defining statistics and its applications; the concepts of variables, samples, populations, qualitative and quantitative variables, independent and dependent variables, scales of measurement; and how to construct various graphs like line graphs, histograms, stem-and-leaf plots, scatter diagrams; and how to classify different variables. It asks the student to apply these statistical concepts to various data sets and examples.