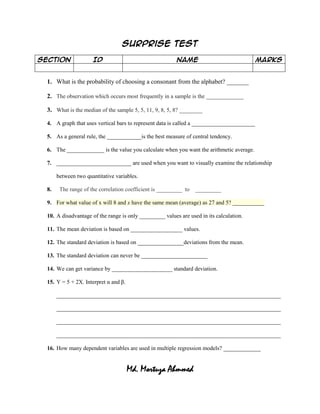
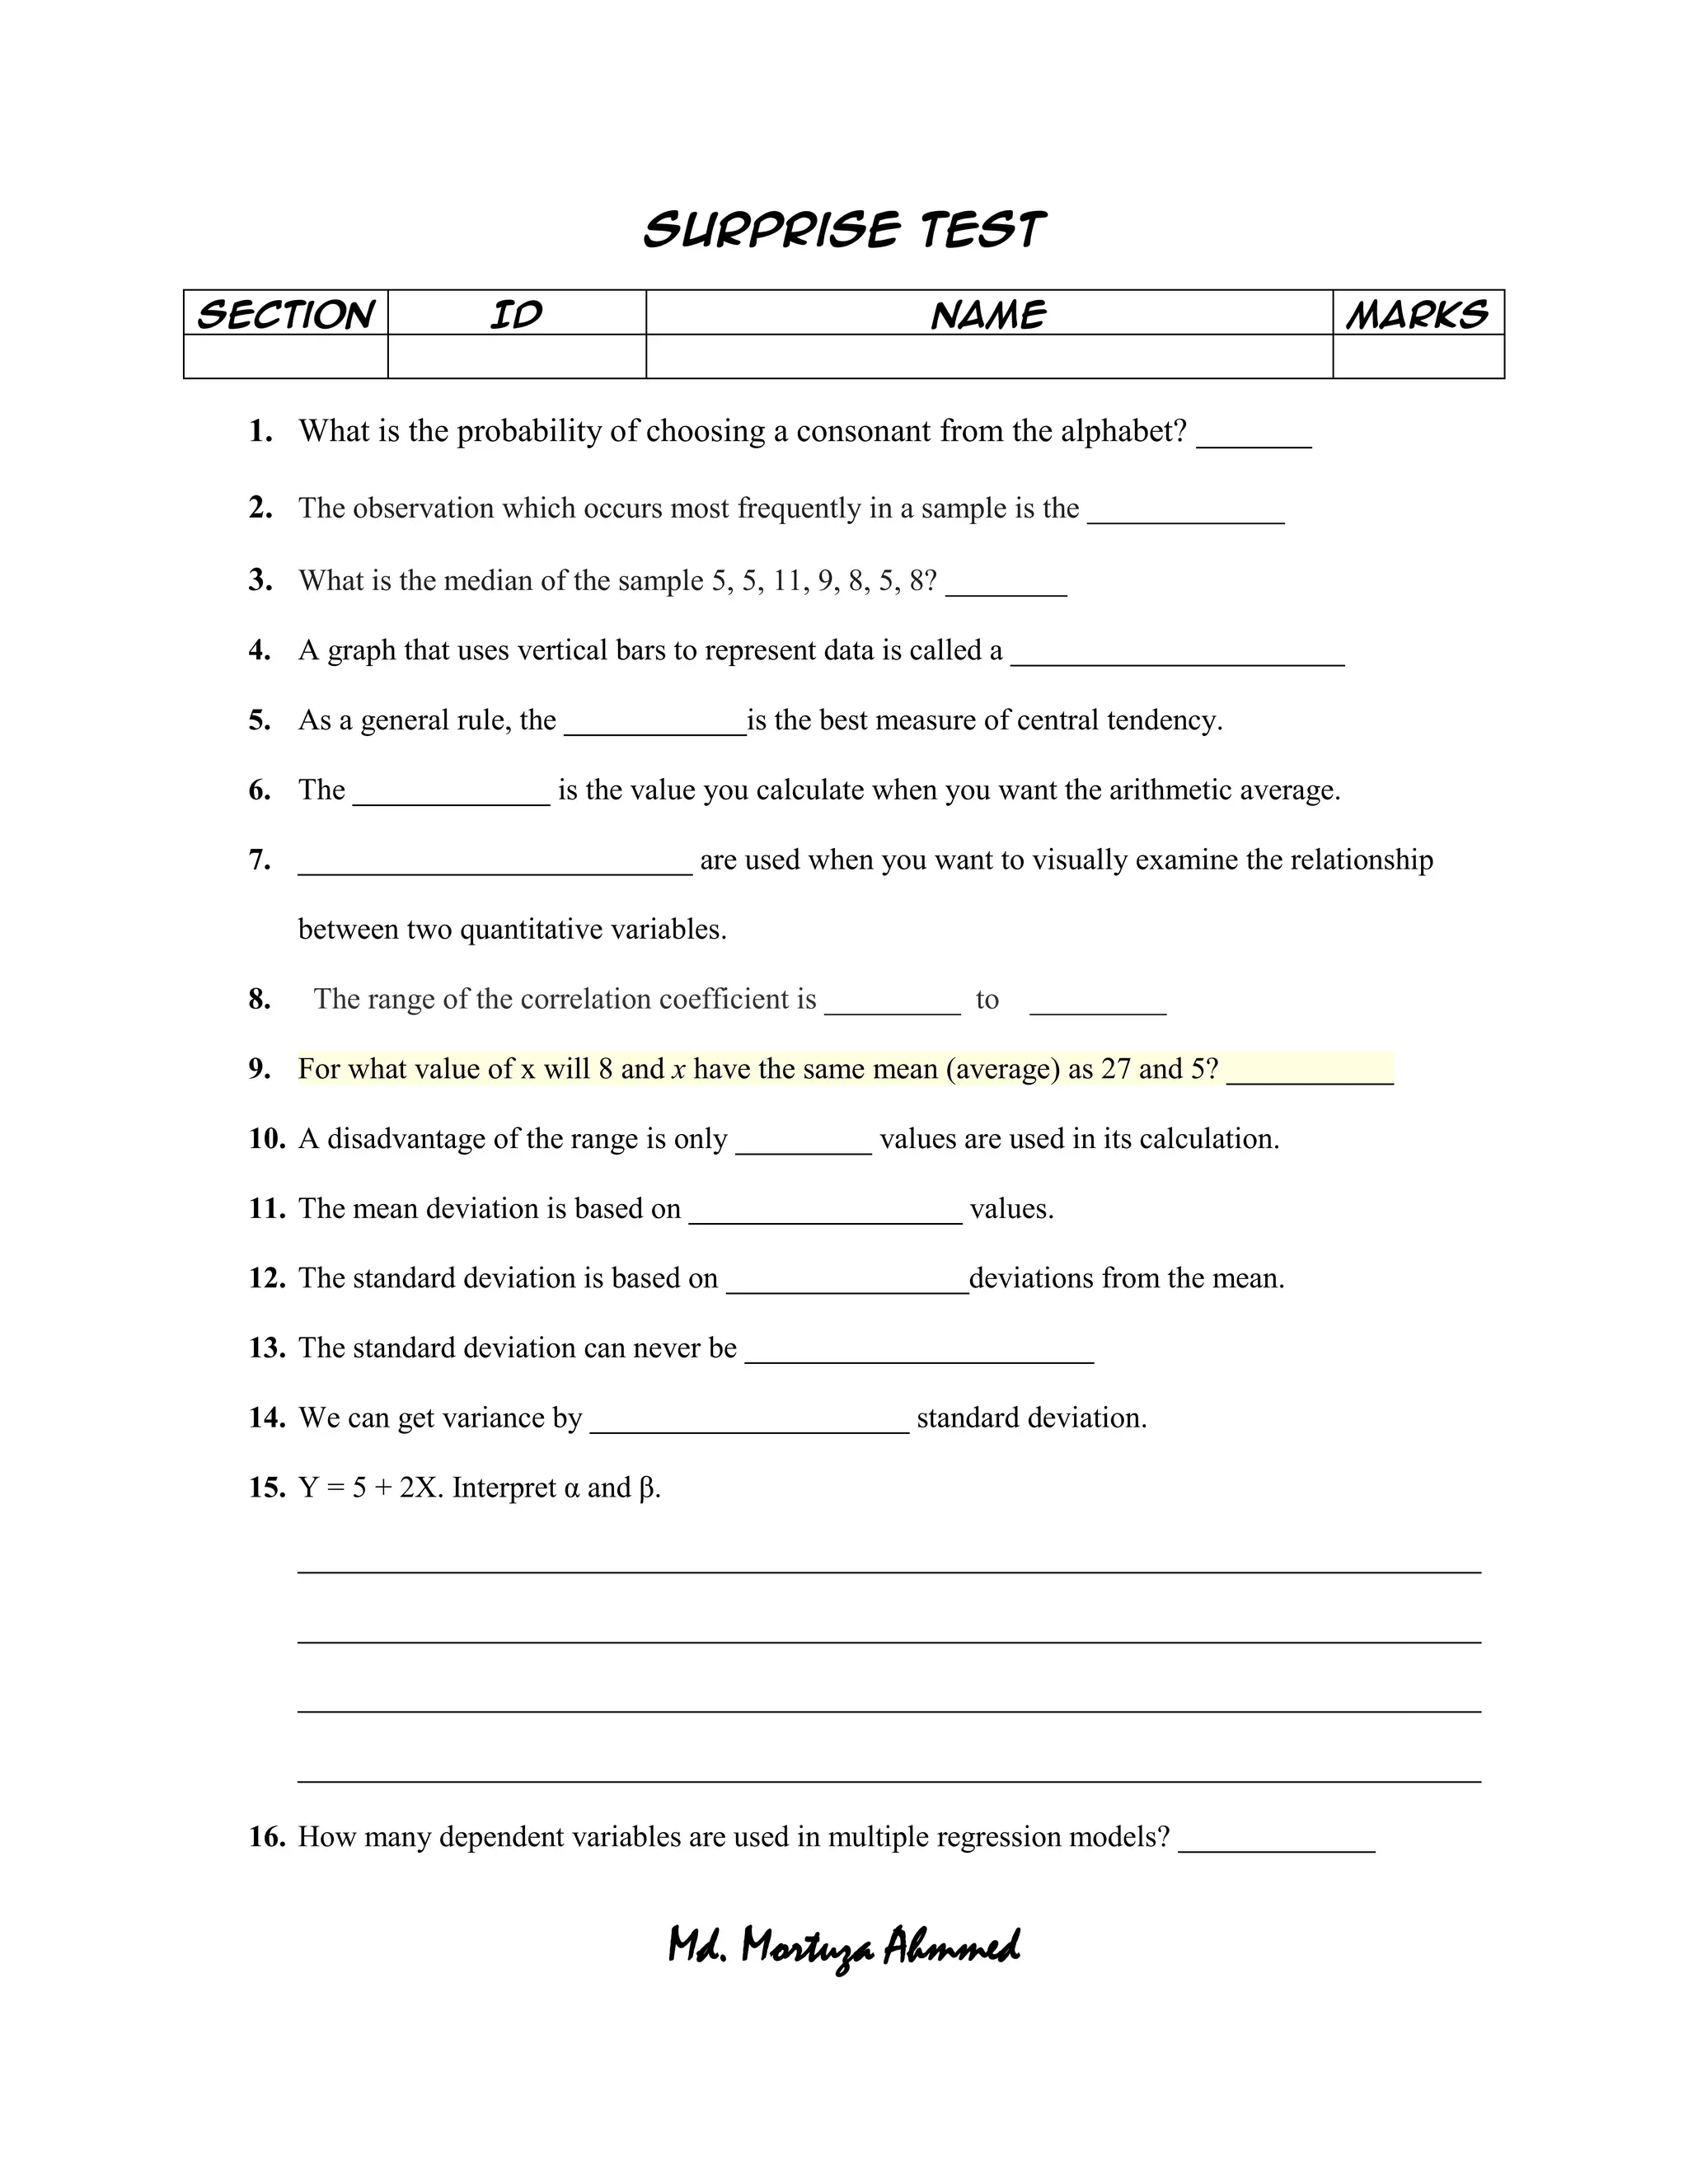
Surprise test

Section              ID                                  Name                              Marks


 1. What is the probability of choosing a consonant from the alphabet? _______

 2. The observation which occurs most frequently in a sample is the _____________

 3. What is the median of the sample 5, 5, 11, 9, 8, 5, 8? ________

 4. A graph that uses vertical bars to represent data is called a ______________________

 5. As a general rule, the ____________is the best measure of central tendency.

 6. The _____________ is the value you calculate when you want the arithmetic average.

 7. __________________________ are used when you want to visually examine the relationship

      between two quantitative variables.

 8.    The range of the correlation coefficient is _________ to _________

 9. For what value of x will 8 and x have the same mean (average) as 27 and 5? ___________

 10. A disadvantage of the range is only _________ values are used in its calculation.

 11. The mean deviation is based on __________________ values.

 12. The standard deviation is based on ________________deviations from the mean.

 13. The standard deviation can never be _______________________

 14. We can get variance by _____________________ standard deviation.

 15. Y = 5 + 2X. Interpret α and β.

      ______________________________________________________________________________

      ______________________________________________________________________________

      ______________________________________________________________________________

      ______________________________________________________________________________

 16. How many dependent variables are used in multiple regression models? _____________


                                      Md. Mortuza Ahmmed

Exam Questions on Basic Statistics

  • 1.
    Surprise test Section ID Name Marks 1. What is the probability of choosing a consonant from the alphabet? _______ 2. The observation which occurs most frequently in a sample is the _____________ 3. What is the median of the sample 5, 5, 11, 9, 8, 5, 8? ________ 4. A graph that uses vertical bars to represent data is called a ______________________ 5. As a general rule, the ____________is the best measure of central tendency. 6. The _____________ is the value you calculate when you want the arithmetic average. 7. __________________________ are used when you want to visually examine the relationship between two quantitative variables. 8. The range of the correlation coefficient is _________ to _________ 9. For what value of x will 8 and x have the same mean (average) as 27 and 5? ___________ 10. A disadvantage of the range is only _________ values are used in its calculation. 11. The mean deviation is based on __________________ values. 12. The standard deviation is based on ________________deviations from the mean. 13. The standard deviation can never be _______________________ 14. We can get variance by _____________________ standard deviation. 15. Y = 5 + 2X. Interpret α and β. ______________________________________________________________________________ ______________________________________________________________________________ ______________________________________________________________________________ ______________________________________________________________________________ 16. How many dependent variables are used in multiple regression models? _____________ Md. Mortuza Ahmmed