Downloaded 111 times
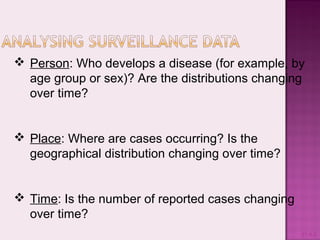
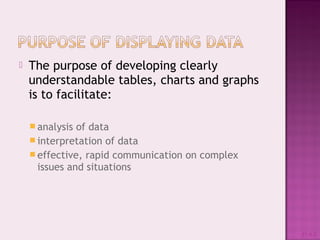
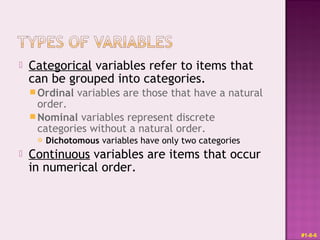
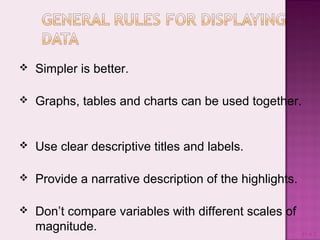
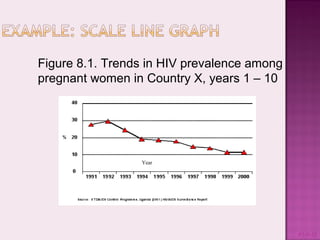

This document discusses presenting and discussing data in charts, graphs, and tables. It outlines the types of charts and graphs that are appropriate for different types of surveillance data, including line graphs to show trends over time, bar charts to compare categories, histograms to show distributions, pie charts to compare parts of a whole, and tables. The purpose is to facilitate analysis, interpretation, and communication of complex data through clear visual representations. Key considerations include using simple, labeled, and narrative formats that avoid scaling issues when comparing variables.