Download to read offline

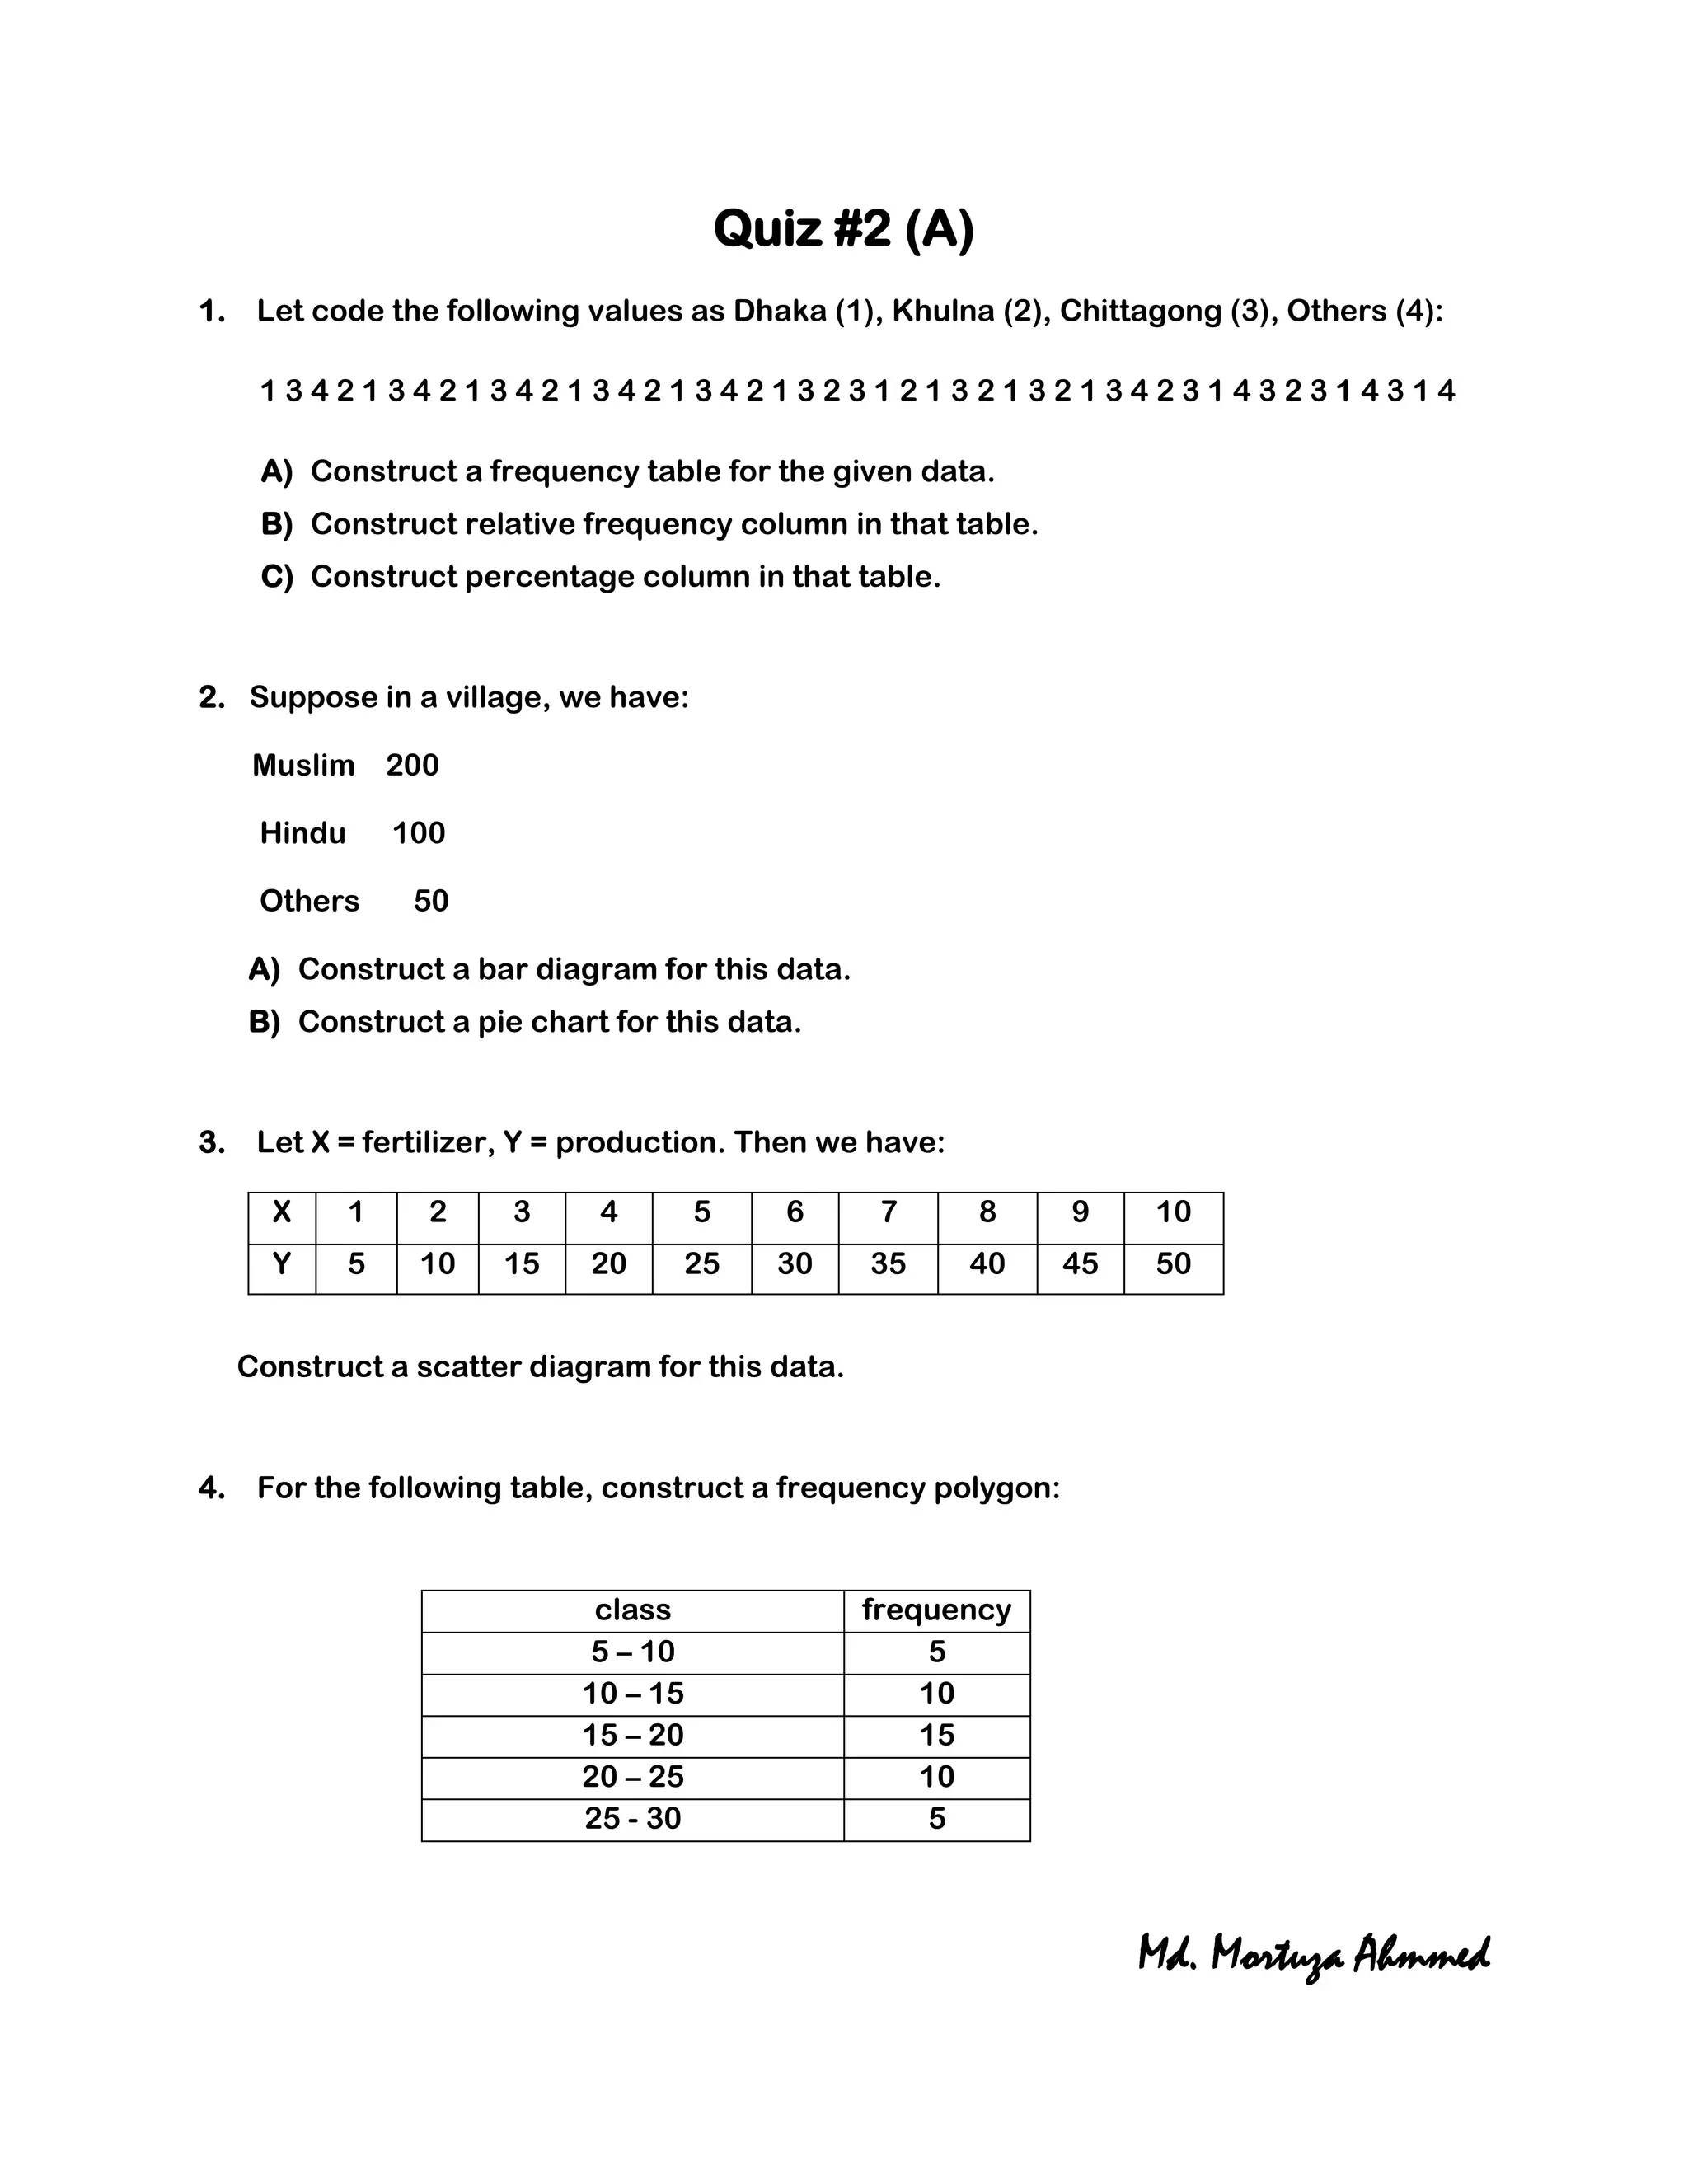

This document contains instructions for 4 questions involving data representation and analysis: 1) Constructing a frequency table, relative frequency column, and percentage column for coded location data; 2) Creating a bar diagram and pie chart for population data of a village by religion; 3) Creating a scatter diagram for fertilizer amount and crop production data; 4) Constructing a frequency polygon for data grouped into classes with frequencies.


