Download to read offline
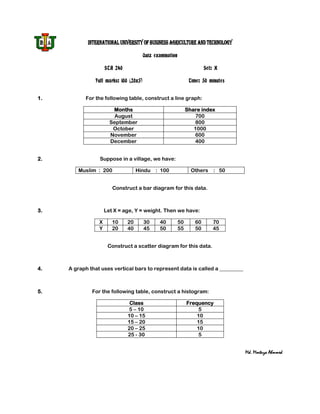
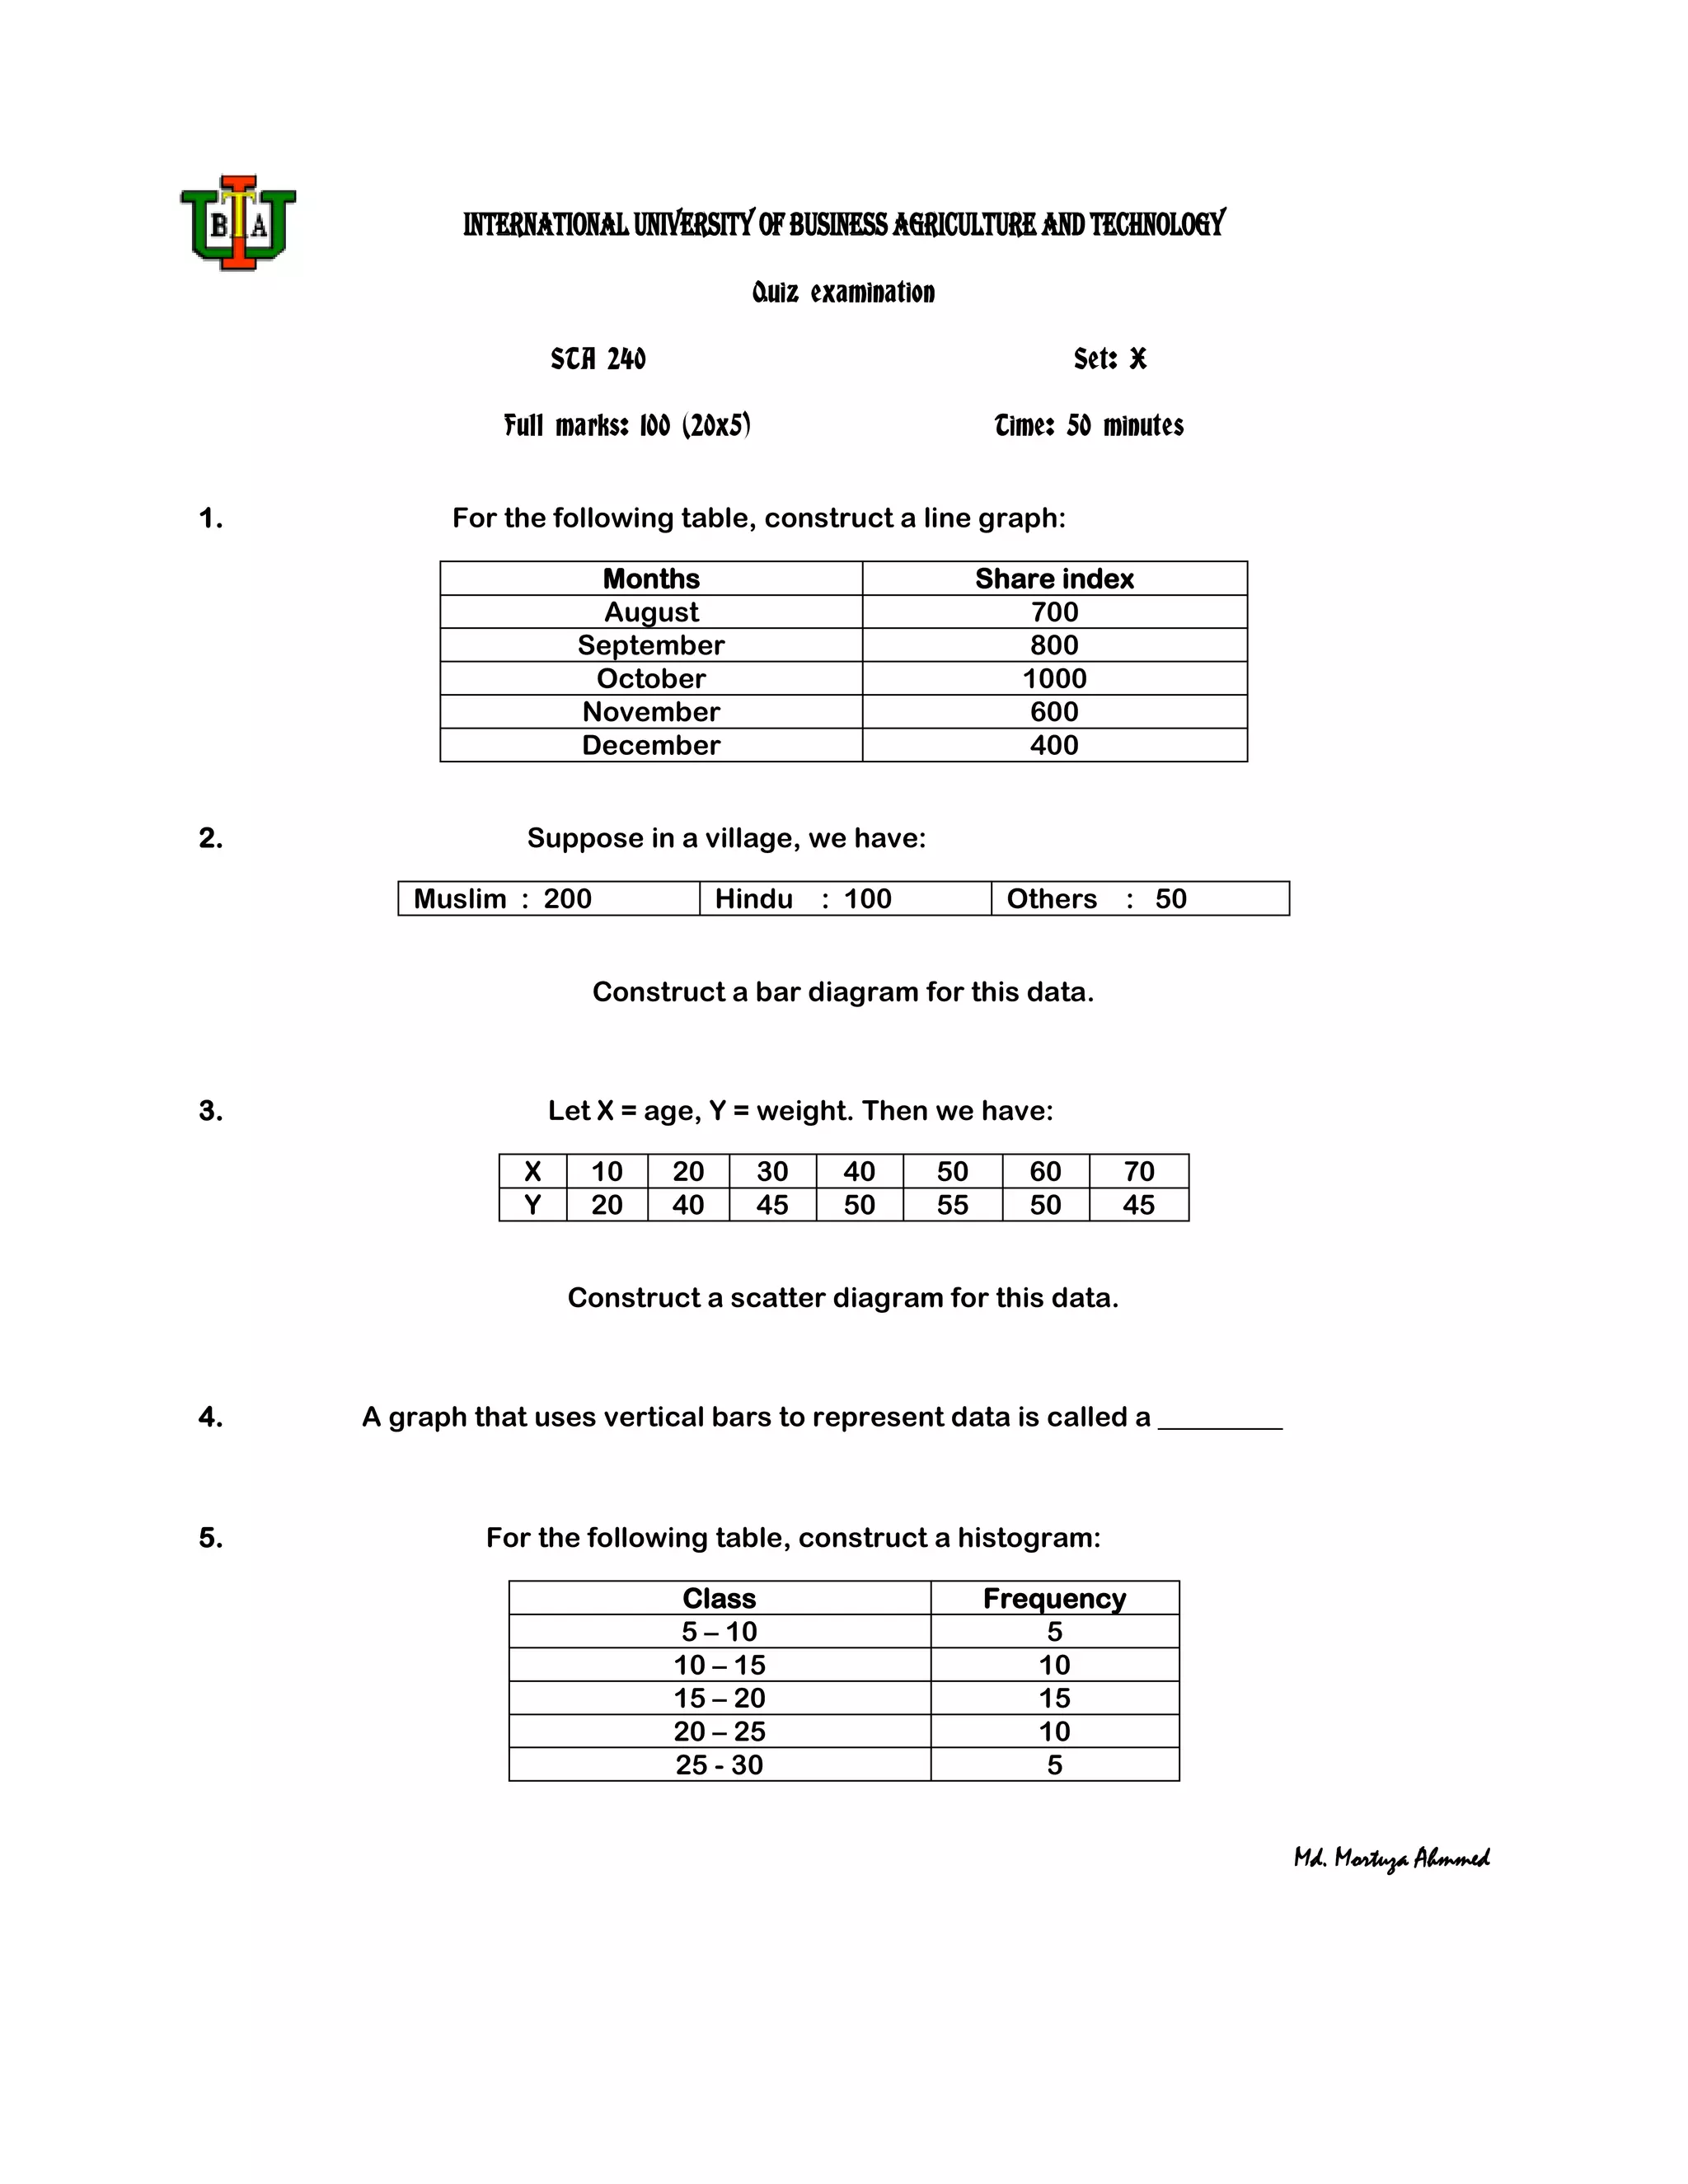

This document contains instructions for a quiz examination with 5 multiple choice questions. It provides data for constructing different types of graphs, including a line graph, bar diagram, scatter plot, and histogram. Students are asked to analyze the data and choose the correct graph type to represent each set of information. The quiz covers key concepts in data visualization and graphical representation of statistical data.


