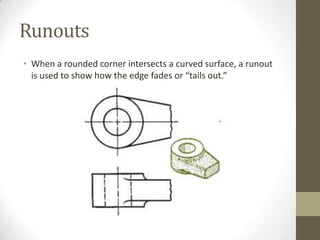
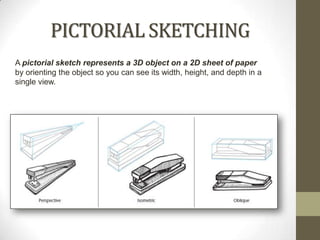
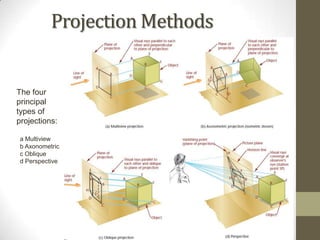
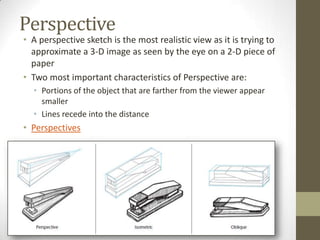
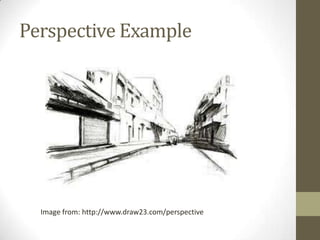
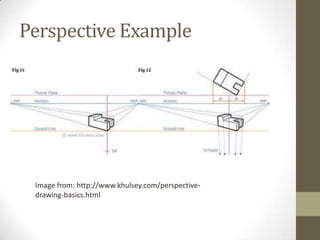
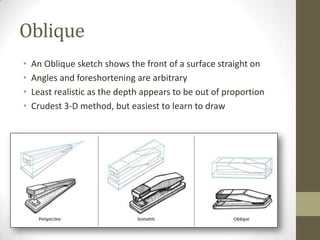
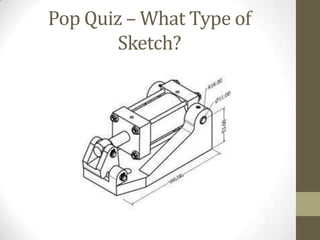
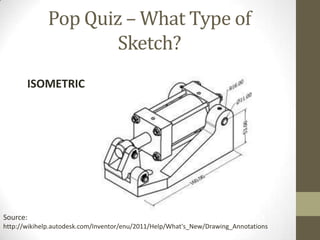
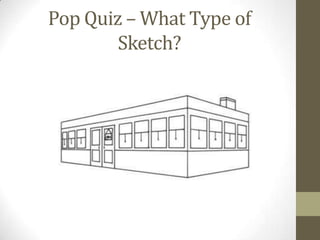
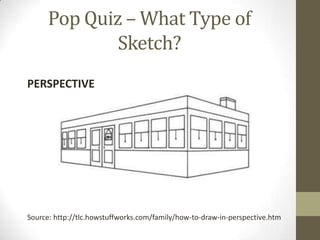
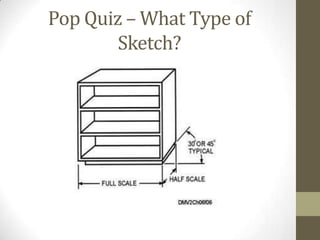
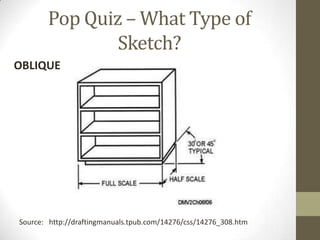
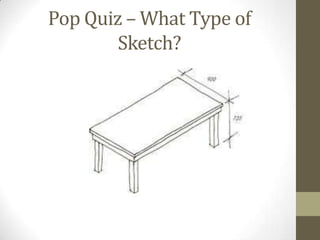
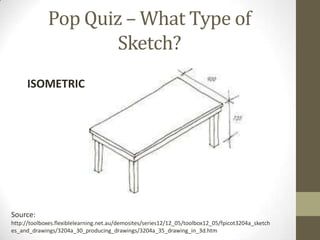
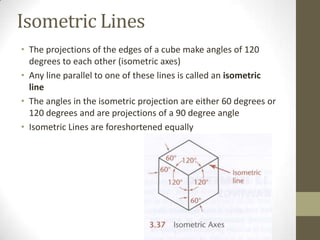
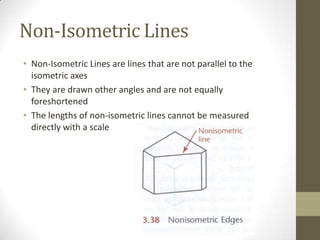
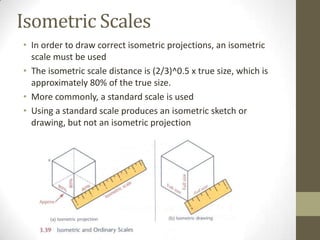
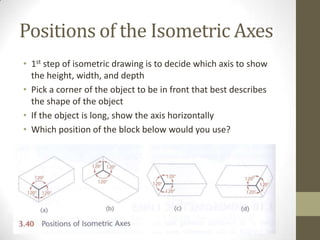
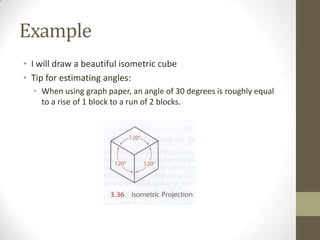
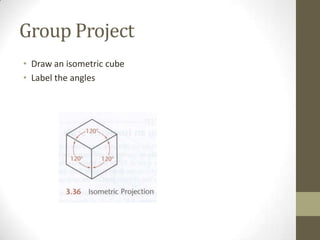
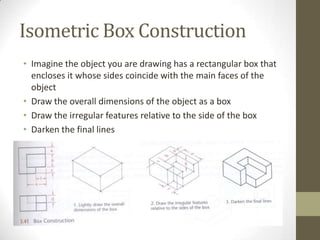
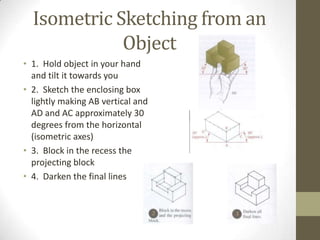
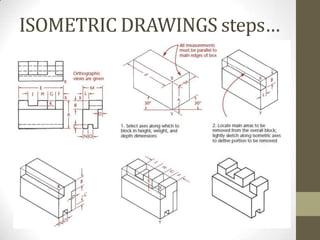
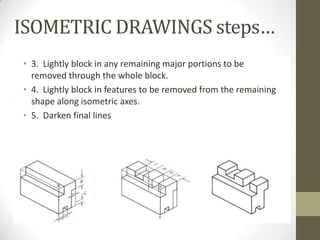
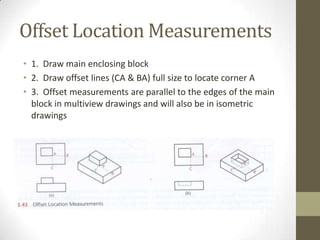
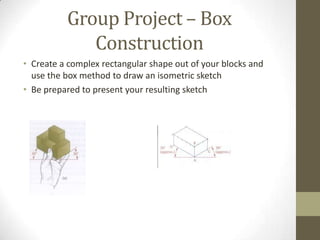
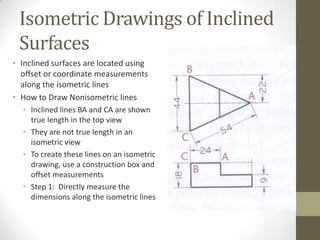
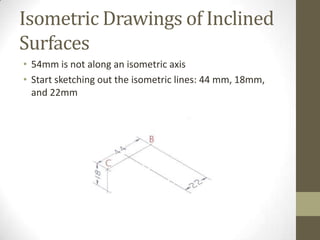
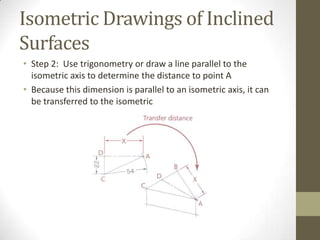
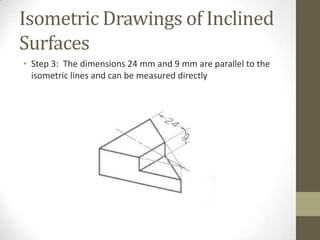
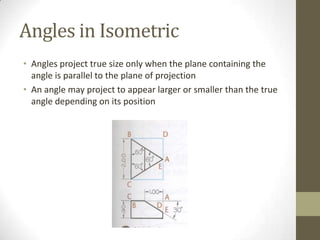
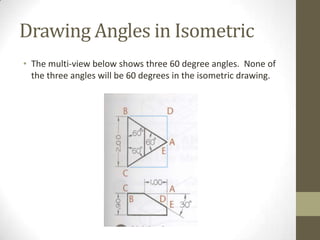
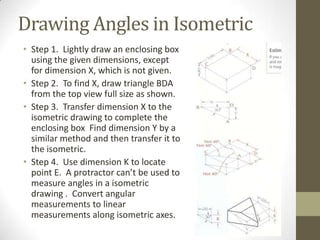
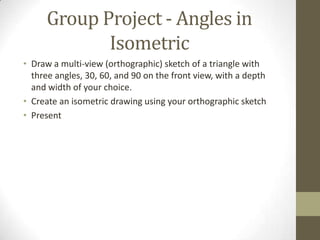
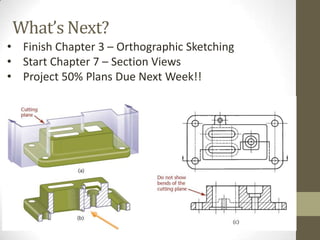
This document provides an overview and instructions for a 2D essentials class. It includes reminders about upcoming project deadlines, extra credit opportunities, and questions from prior chapters. It discusses concepts like runouts, plotting curves by hand, and isometric drawing. Students are instructed to break into groups to answer questions, sketch examples, and draw isometric shapes like cubes and boxes. The instructor emphasizes key pictorial drawing techniques including orthographic, oblique, perspective, and axonometric projections.
Lecture 1 - Technical Drawing Introduction II
Engineering drawings are important in conveying useful information to other engineers and manufacturer
Allow the readers to visualize what the proposed product would look like
Provide information on dimensions and material used to make the proposed product
Provide views from the top, the side, and the front
Transcript: Selling digital books in 2024: Insights from industry leaders - T...BookNet Canada
The publishing industry has been selling digital audiobooks and ebooks for over a decade and has found its groove. What’s changed? What has stayed the same? Where do we go from here? Join a group of leading sales peers from across the industry for a conversation about the lessons learned since the popularization of digital books, best practices, digital book supply chain management, and more.
Link to video recording: https://bnctechforum.ca/sessions/selling-digital-books-in-2024-insights-from-industry-leaders/
Presented by BookNet Canada on May 28, 2024, with support from the Department of Canadian Heritage.
Essentials of Automations: Optimizing FME Workflows with ParametersSafe Software
Are you looking to streamline your workflows and boost your projects’ efficiency? Do you find yourself searching for ways to add flexibility and control over your FME workflows? If so, you’re in the right place.
Join us for an insightful dive into the world of FME parameters, a critical element in optimizing workflow efficiency. This webinar marks the beginning of our three-part “Essentials of Automation” series. This first webinar is designed to equip you with the knowledge and skills to utilize parameters effectively: enhancing the flexibility, maintainability, and user control of your FME projects.
Here’s what you’ll gain:
- Essentials of FME Parameters: Understand the pivotal role of parameters, including Reader/Writer, Transformer, User, and FME Flow categories. Discover how they are the key to unlocking automation and optimization within your workflows.
- Practical Applications in FME Form: Delve into key user parameter types including choice, connections, and file URLs. Allow users to control how a workflow runs, making your workflows more reusable. Learn to import values and deliver the best user experience for your workflows while enhancing accuracy.
- Optimization Strategies in FME Flow: Explore the creation and strategic deployment of parameters in FME Flow, including the use of deployment and geometry parameters, to maximize workflow efficiency.
- Pro Tips for Success: Gain insights on parameterizing connections and leveraging new features like Conditional Visibility for clarity and simplicity.
We’ll wrap up with a glimpse into future webinars, followed by a Q&A session to address your specific questions surrounding this topic.
Don’t miss this opportunity to elevate your FME expertise and drive your projects to new heights of efficiency.
Neuro-symbolic is not enough, we need neuro-*semantic*Frank van Harmelen
Neuro-symbolic (NeSy) AI is on the rise. However, simply machine learning on just any symbolic structure is not sufficient to really harvest the gains of NeSy. These will only be gained when the symbolic structures have an actual semantics. I give an operational definition of semantics as “predictable inference”.
All of this illustrated with link prediction over knowledge graphs, but the argument is general.
State of ICS and IoT Cyber Threat Landscape Report 2024 previewPrayukth K V
The IoT and OT threat landscape report has been prepared by the Threat Research Team at Sectrio using data from Sectrio, cyber threat intelligence farming facilities spread across over 85 cities around the world. In addition, Sectrio also runs AI-based advanced threat and payload engagement facilities that serve as sinks to attract and engage sophisticated threat actors, and newer malware including new variants and latent threats that are at an earlier stage of development.
The latest edition of the OT/ICS and IoT security Threat Landscape Report 2024 also covers:
State of global ICS asset and network exposure
Sectoral targets and attacks as well as the cost of ransom
Global APT activity, AI usage, actor and tactic profiles, and implications
Rise in volumes of AI-powered cyberattacks
Major cyber events in 2024
Malware and malicious payload trends
Cyberattack types and targets
Vulnerability exploit attempts on CVEs
Attacks on counties – USA
Expansion of bot farms – how, where, and why
In-depth analysis of the cyber threat landscape across North America, South America, Europe, APAC, and the Middle East
Why are attacks on smart factories rising?
Cyber risk predictions
Axis of attacks – Europe
Systemic attacks in the Middle East
Download the full report from here:
https://sectrio.com/resources/ot-threat-landscape-reports/sectrio-releases-ot-ics-and-iot-security-threat-landscape-report-2024/
GDG Cloud Southlake #33: Boule & Rebala: Effective AppSec in SDLC using Deplo...James Anderson
Effective Application Security in Software Delivery lifecycle using Deployment Firewall and DBOM
The modern software delivery process (or the CI/CD process) includes many tools, distributed teams, open-source code, and cloud platforms. Constant focus on speed to release software to market, along with the traditional slow and manual security checks has caused gaps in continuous security as an important piece in the software supply chain. Today organizations feel more susceptible to external and internal cyber threats due to the vast attack surface in their applications supply chain and the lack of end-to-end governance and risk management.
The software team must secure its software delivery process to avoid vulnerability and security breaches. This needs to be achieved with existing tool chains and without extensive rework of the delivery processes. This talk will present strategies and techniques for providing visibility into the true risk of the existing vulnerabilities, preventing the introduction of security issues in the software, resolving vulnerabilities in production environments quickly, and capturing the deployment bill of materials (DBOM).
Speakers:
Bob Boule
Robert Boule is a technology enthusiast with PASSION for technology and making things work along with a knack for helping others understand how things work. He comes with around 20 years of solution engineering experience in application security, software continuous delivery, and SaaS platforms. He is known for his dynamic presentations in CI/CD and application security integrated in software delivery lifecycle.
Gopinath Rebala
Gopinath Rebala is the CTO of OpsMx, where he has overall responsibility for the machine learning and data processing architectures for Secure Software Delivery. Gopi also has a strong connection with our customers, leading design and architecture for strategic implementations. Gopi is a frequent speaker and well-known leader in continuous delivery and integrating security into software delivery.
JMeter webinar - integration with InfluxDB and GrafanaRTTS
Watch this recorded webinar about real-time monitoring of application performance. See how to integrate Apache JMeter, the open-source leader in performance testing, with InfluxDB, the open-source time-series database, and Grafana, the open-source analytics and visualization application.
In this webinar, we will review the benefits of leveraging InfluxDB and Grafana when executing load tests and demonstrate how these tools are used to visualize performance metrics.
Length: 30 minutes
Session Overview
-------------------------------------------
During this webinar, we will cover the following topics while demonstrating the integrations of JMeter, InfluxDB and Grafana:
- What out-of-the-box solutions are available for real-time monitoring JMeter tests?
- What are the benefits of integrating InfluxDB and Grafana into the load testing stack?
- Which features are provided by Grafana?
- Demonstration of InfluxDB and Grafana using a practice web application
To view the webinar recording, go to:
https://www.rttsweb.com/jmeter-integration-webinar
Dev Dives: Train smarter, not harder – active learning and UiPath LLMs for do...UiPathCommunity
💥 Speed, accuracy, and scaling – discover the superpowers of GenAI in action with UiPath Document Understanding and Communications Mining™:
See how to accelerate model training and optimize model performance with active learning
Learn about the latest enhancements to out-of-the-box document processing – with little to no training required
Get an exclusive demo of the new family of UiPath LLMs – GenAI models specialized for processing different types of documents and messages
This is a hands-on session specifically designed for automation developers and AI enthusiasts seeking to enhance their knowledge in leveraging the latest intelligent document processing capabilities offered by UiPath.
Speakers:
👨🏫 Andras Palfi, Senior Product Manager, UiPath
👩🏫 Lenka Dulovicova, Product Program Manager, UiPath
Builder.ai Founder Sachin Dev Duggal's Strategic Approach to Create an Innova...Ramesh Iyer
In today's fast-changing business world, Companies that adapt and embrace new ideas often need help to keep up with the competition. However, fostering a culture of innovation takes much work. It takes vision, leadership and willingness to take risks in the right proportion. Sachin Dev Duggal, co-founder of Builder.ai, has perfected the art of this balance, creating a company culture where creativity and growth are nurtured at each stage.
Encryption in Microsoft 365 - ExpertsLive Netherlands 2024Albert Hoitingh
In this session I delve into the encryption technology used in Microsoft 365 and Microsoft Purview. Including the concepts of Customer Key and Double Key Encryption.
Slack (or Teams) Automation for Bonterra Impact Management (fka Social Soluti...Jeffrey Haguewood
Sidekick Solutions uses Bonterra Impact Management (fka Social Solutions Apricot) and automation solutions to integrate data for business workflows.
We believe integration and automation are essential to user experience and the promise of efficient work through technology. Automation is the critical ingredient to realizing that full vision. We develop integration products and services for Bonterra Case Management software to support the deployment of automations for a variety of use cases.
This video focuses on the notifications, alerts, and approval requests using Slack for Bonterra Impact Management. The solutions covered in this webinar can also be deployed for Microsoft Teams.
Interested in deploying notification automations for Bonterra Impact Management? Contact us at sales@sidekicksolutionsllc.com to discuss next steps.
Securing your Kubernetes cluster_ a step-by-step guide to success !KatiaHIMEUR1
Today, after several years of existence, an extremely active community and an ultra-dynamic ecosystem, Kubernetes has established itself as the de facto standard in container orchestration. Thanks to a wide range of managed services, it has never been so easy to set up a ready-to-use Kubernetes cluster.
However, this ease of use means that the subject of security in Kubernetes is often left for later, or even neglected. This exposes companies to significant risks.
In this talk, I'll show you step-by-step how to secure your Kubernetes cluster for greater peace of mind and reliability.
1. 2D Essentials
Instructor: Laura Gerold, PE
Catalog #10614113
Class # 22784, 24113, 24136, & 24138
Class Start: January 18, 2012
Class End: May 16, 2012
2. Reminders
• 50% Project Plans are due next week on April 4th!
• Grading handout from last week is also on blackboard in the class
materials / project folder
• 3 Views with borders and scales due on April 4th for 30 points
• Optional extra credit is due on April 11th
• Find other countries where 1st and 3rd angle projections are used
for 5 extra points
• Details are on blackboard in class materials / extra credit folder
4. Runouts
• When a rounded corner intersects a curved surface, a runout
is used to show how the edge fades or “tails out.”
5. Runouts – Group Projects
• Break into groups
• Look at page 212 in the text, Figure 6.14.
• Answer the following questions as a group:
• Where are the runouts located on the orthographic sketches?
• Where are the corresponding points on the isometric sketches
• Be prepared to present one of the examples to the class.
• Does anyone have an example of a runout to show? Can you
think of any examples from home, work, in this room?
• Work in groups to sketch example of runouts.
6. Plotting Curves by Hand
• Step 1: Break up the curves
into several points and locate
them in the adjacent view
• Step 2: Project the points along
the projection lines into the
top view from the front view.
Transfer the depth from the
side view, using the back
surface as a reference plane.
• Step 3: Draw the curve
through the points.
7. Plotting Curves by Hand
• Break into groups and Plot a curve by hand using example one
on page 207.
• Start with the front and right views and use the method to
plot the top view.
• How many points do you think you should use for an accurate
curve?
9. Why Isometric Drawing?
• Isometric Drawing is used to visualize concepts and to present
results to a client and the public
10. Some Key Concepts
• To Understand Isometric Projection and drawing, we need to
learn a few key concepts first . . .
11. PICTORIAL SKETCHING
A pictorial sketch represents a 3D object on a 2D sheet of paper
by orienting the object so you can see its width, height, and depth in a
single view.
13. Perspective
• A perspective sketch is the most realistic view as it is trying to
approximate a 3-D image as seen by the eye on a 2-D piece of
paper
• Two most important characteristics of Perspective are:
• Portions of the object that are farther from the viewer appear
smaller
• Lines recede into the distance
• Perspectives
16. Oblique
• An Oblique sketch shows the front of a surface straight on
• Angles and foreshortening are arbitrary
• Least realistic as the depth appears to be out of proportion
• Crudest 3-D method, but easiest to learn to draw
18. Oblique Example
Source:
http://finearts.fontbonne.edu/tech/design/oth_per.html
19. Isometric
• Drawn so that the lines do not recede into the distance, but
remain parallel
• Easy to sketch, but doesn’t always appear realistic
• Coordinate axes appear equally foreshortened with the angles
between any two equal to 120 degrees.
• Comparison
20. Isometric Example
http://www.birkey.com/technical-illustration/tugboat-
isometric-cutaway/attachment/tugboat-isometric/
31. Pop Quiz – What Type of
Sketch?
ISOMETRIC
Source:
http://toolboxes.flexiblelearning.net.au/demosites/series12/12_05/toolbox12_05/fpicot3204a_sketch
es_and_drawings/3204a_30_producing_drawings/3204a_35_drawing_in_3d.htm
35. Pop Quiz – What Type of
Sketch?
ISOMETRIC
Source: http://www.brynmawr.edu/cities/Cities/imgb/071/071m.html
36. Axonometric Drawings
• Axonometric projection is a type of parallel
projection, more specifically a type of
orthographic projection, used to create a
pictorial drawing of an object, where the
object is rotated along one or more of its
axes relative to the plane of projection.
• There are three main types of axonometric
projection: isometric, dimetric, and trimetric
projection.
• "Axonometric" means "to measure along
axes".
• With axonometric projections the scale of
distant features is the same as for near
features, such pictures will look
distorted, as it is not how our eyes or
photography work.
• Isometric is the most common form of
axonometric projection used.
37. AXONOMETRIC
Various types of
DRAWINGS
pictorial drawings are
used extensively in
catalogs,
sales literature, and
technical work. They
are often used in
patent drawings; in
piping diagrams; in
machine, structural, a
rchitectural
design, and in
furniture design; and
for ideation sketching.
Axonometric
(Courtesy of Douglas Wintin.)
38. Isometric Projection
• To create an isometric projection, an object must be oriented
so that its principal edges (axes) make equal angles with the
plane of projection and are foreshortened equally
• On the figure below, when a cube is oriented this way, it has
equal angles of 120 degrees
• Isometric projection is the most common kind of projection
used by engineers
• Isometric Drawing Video
39. Isometric Lines
• The projections of the edges of a cube make angles of 120
degrees to each other (isometric axes)
• Any line parallel to one of these lines is called an isometric
line
• The angles in the isometric projection are either 60 degrees or
120 degrees and are projections of a 90 degree angle
• Isometric Lines are foreshortened equally
40. Non-Isometric Lines
• Non-Isometric Lines are lines that are not parallel to the
isometric axes
• They are drawn other angles and are not equally
foreshortened
• The lengths of non-isometric lines cannot be measured
directly with a scale
41. Isometric Scales
• In order to draw correct isometric projections, an isometric
scale must be used
• The isometric scale distance is (2/3)^0.5 x true size, which is
approximately 80% of the true size.
• More commonly, a standard scale is used
• Using a standard scale produces an isometric sketch or
drawing, but not an isometric projection
42. Positions of the Isometric Axes
• 1st step of isometric drawing is to decide which axis to show
the height, width, and depth
• Pick a corner of the object to be in front that best describes
the shape of the object
• If the object is long, show the axis horizontally
• Which position of the block below would you use?
43. Example
• I will draw a beautiful isometric cube
• Tip for estimating angles:
• When using graph paper, an angle of 30 degrees is roughly equal
to a rise of 1 block to a run of 2 blocks.
45. Isometric Box Construction
• Imagine the object you are drawing has a rectangular box that
encloses it whose sides coincide with the main faces of the
object
• Draw the overall dimensions of the object as a box
• Draw the irregular features relative to the side of the box
• Darken the final lines
46. Isometric Sketching from an
Object
• 1. Hold object in your hand
and tilt it towards you
• 2. Sketch the enclosing box
lightly making AB vertical and
AD and AC approximately 30
degrees from the horizontal
(isometric axes)
• 3. Block in the recess the
projecting block
• 4. Darken the final lines
48. ISOMETRIC DRAWINGS steps…
• 3. Lightly block in any remaining major portions to be
removed through the whole block.
• 4. Lightly block in features to be removed from the remaining
shape along isometric axes.
• 5. Darken final lines
49. Offset Location Measurements
• 1. Draw main enclosing block
• 2. Draw offset lines (CA & BA) full size to locate corner A
• 3. Offset measurements are parallel to the edges of the main
block in multiview drawings and will also be in isometric
drawings
50. Group Project – Box
Construction
• Create a complex rectangular shape out of your blocks and
use the box method to draw an isometric sketch
• Be prepared to present your resulting sketch
51. Isometric Drawings of Inclined
Surfaces
• Inclined surfaces are located using
offset or coordinate measurements
along the isometric lines
• How to Draw Nonisometric lines
• Inclined lines BA and CA are shown
true length in the top view
• They are not true length in an
isometric view
• To create these lines on an isometric
drawing, use a construction box and
offset measurements
• Step 1: Directly measure the
dimensions along the isometric lines
52. Isometric Drawings of Inclined
Surfaces
• 54mm is not along an isometric axis
• Start sketching out the isometric lines: 44 mm, 18mm,
and 22mm
53. Isometric Drawings of Inclined
Surfaces
• Step 2: Use trigonometry or draw a line parallel to the
isometric axis to determine the distance to point A
• Because this dimension is parallel to an isometric axis, it can
be transferred to the isometric
54. Isometric Drawings of Inclined
Surfaces
• Step 3: The dimensions 24 mm and 9 mm are parallel to the
isometric lines and can be measured directly
55. Group Project - Isometric
Drawings of Inclined Surfaces
• Draw an isometric drawing of an object with an inclined
surface. Use an object that you brought to class or one of
mine.
• In your drawing, identify the isometric and non-isometric lines
• Present your results
56. Oblique Surfaces in Isometric
• Step 1: Find the intersections of the oblique surfaces with the
isometric planes.
• Note that for this example, the oblique plane contains point A,
B, and C
57. Oblique Surfaces in Isometric
• Step 2: To draw the plane, extend line AB to X and Y, in the
same isometric plane as C
• Use lines XC and YC to locate points E and F
58. Oblique Surfaces in Isometric
• Step 3: Finally draw AD and ED using the rule that parallel
lines appear parallel in every orthographic or isometric view
59. Group Project - Oblique
Surfaces in Isometric
• Create a simple isometric sketch of an oblique surface. Use
items in the room, or go on a quick scavenger hunt around the
2nd floor
• Label the isometric and non-isometric lines
• Shade in the oblique planes
• Present your drawing as a group to the class
60. Inclined Surfaces Example
• (a) Orthographic Sketch of an item with inclined and oblique
surfaces to be drawn
• (b) Inclined surfaces are located using offset or coordinate
measurements along isometric lines
• (c) Final product with inclined surface M and oblique surface N
62. Hidden Lines and Centerlines
• Hidden lines are omitted from pictorial drawings unless they
are needed to make the drawing clear
• Draw centerlines locating the center of a hole only if they are
needed to indicate symmetry or for dimensioning
• Use centerlines sparingly in isometric drawings - “If in
doubt, leave them out”
63. Group Project - Hidden Lines
and Centerlines
• As a group, look through the isometric sketches on pages 228
and 229 of the text.
• When were hidden lines and centerlines used?
• When were they not used?
• Do you agree with the representation?
Look through your sketches from today.
Did you use hidden lines and centerlines.
Where they used appropriately?
64. Angles in Isometric
• Angles project true size only when the plane containing the
angle is parallel to the plane of projection
• An angle may project to appear larger or smaller than the true
angle depending on its position
65. Drawing Angles in Isometric
• The multi-view below shows three 60 degree angles. None of
the three angles will be 60 degrees in the isometric drawing.
66. Drawing Angles in Isometric
• Step 1. Lightly draw an enclosing box
using the given dimensions, except
for dimension X, which is not given.
• Step 2. To find X, draw triangle BDA
from the top view full size as shown.
• Step 3. Transfer dimension X to the
isometric drawing to complete the
enclosing box Find dimension Y by a
similar method and then transfer it to
the isometric.
• Step 4. Use dimension K to locate
point E. A protractor can’t be used to
measure angles in a isometric
drawing . Convert angular
measurements to linear
measurements along isometric axes.
67. Group Project - Angles in
Isometric
• Draw a multi-view (orthographic) sketch of a triangle with
three angles, 30, 60, and 90 on the front view, with a depth
and width of your choice.
• Create an isometric drawing using your orthographic sketch
• Present
69. Questions?
• On one of your sketches, answer the following two questions:
• What was the most useful thing that you learned today?
• What do you still have questions about?