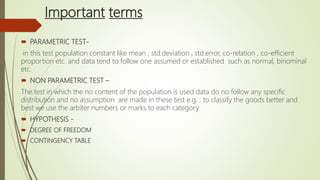
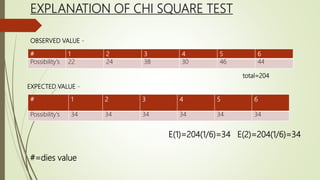
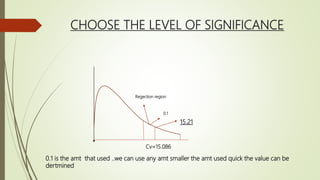
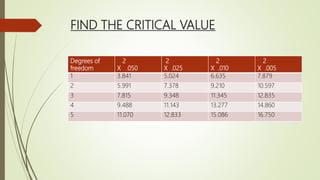
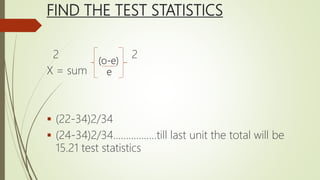
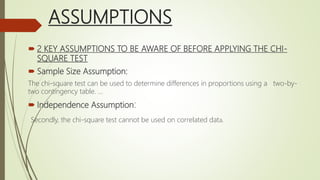
CHI SQUARE TEST
1st M.COM (IB)
VIKAS KUMAR
DEFINATION AND MEANING
What is chi square test ?
It is a statistical test used to compare expected data
with what we collected
Chi square test is tell us the difference between
collected no and the expected no
If the difference is large then there will be some thing
for the significant change
So it is also called as goodness to fit test
Important terms
 PARAMETRIC TEST-
in this test population constant like mean , std.deviation , std.error, co-relation , co-efficient
proportion etc. and data tend to follow one assumed or established such as normal, binominal
etc.
 NON PARAMETRIC TEST –
The test in which the no content of the population is used data do no follow any specific
distribution and no assumption are made in these test e.g. : to classify the goods better and
best we use the arbiter numbers or marks to each category
 HYPOTHESIS -
 DEGREE OF FREEDOM
 CONTINGENCY TABLE
EXPLANATION OF CHI SQUARE TEST
# 1 2 3 4 5 6
Possibility's 22 24 38 30 46 44
# 1 2 3 4 5 6
Possibility's 34 34 34 34 34 34
OBSERVED VALUE -
EXPECTED VALUE -
total=204
#=dies value
E(1)=204(1/6)=34 E(2)=204(1/6)=34
STEPS FOR PERFORMANCE OF CHI SQUARE
TEST/HYPOTHESIS TEST
State null (Ho) or alternative hypothesis (Ha)
Choose the level of significance (infinite)
Find the critical value
Find the test statistics
Conclusion
STATE NULL (HO) OR
ALTERNATIVE HYPOTHESIS (HA)
Null hypothesis
Ho=dies is fair
Observation fit the operation value
Alternative hypothesis
Ha=dies is no fair
CHOOSE THE LEVEL OF SIGNIFICANCE
Regection region
0.1
Cv=15.086
0.1 is the amt that used ..we can use any amt smaller the amt used quick the value can be
dertmined
15.21
FIND THE CRITICAL VALUE
Degrees of
freedom
2
X .050
2
X .025
2
X .010
2
X .005
1 3.841 5.024 6.635 7.879
2 5.991 7.378 9.210 10.597
3 7.815 9.348 11.345 12.835
4 9.488 11.143 13.277 14.860
5 11.070 12.833 15.086 16.750
FIND THE TEST STATISTICS
2 2
X = sum
 (22-34)2/34
 (24-34)2/34……………..till last unit the total will be
15.21 test statistics
(o-e)
e
ASSUMPTIONS
 2 KEY ASSUMPTIONS TO BE AWARE OF BEFORE APPLYING THE CHI-
SQUARE TEST
 Sample Size Assumption:
The chi-square test can be used to determine differences in proportions using a two-by-
two contingency table. ...
 Independence Assumption:
Secondly, the chi-square test cannot be used on correlated data.
LIMITATIONS OF THE CHI-SQUARE TEST
The chi-square test does not give us much information about the
strength of the relationship or its substantive significance in the
population.
The chi-square test is sensitive to sample size. The size of the
calculated chi-square is directly proportional to the size of the
sample, independent of the strength of the relationship between
the variables
The chi-square test is also sensitive to small expected frequencies
in one or more of the cells in the table.
WHAT IS THE USE OF CHI SQUARE
TEST?
The chi-squared test is used to determine whether
there is a significant difference between the expected
frequencies and the observed frequencies in one or
more categories.
APPLICATION OF A CHI SQUARE TEST
Good ness of fit of distribution
Test of independence of attributes
Test of homogeneity
Conclusion
The chi-square test is no doubt a most
frequently used test, but its correct
application is equally an uphill task.
Thank you

Chi squared test

  • 1.
    CHI SQUARE TEST 1stM.COM (IB) VIKAS KUMAR
  • 2.
    DEFINATION AND MEANING Whatis chi square test ? It is a statistical test used to compare expected data with what we collected Chi square test is tell us the difference between collected no and the expected no If the difference is large then there will be some thing for the significant change So it is also called as goodness to fit test
  • 3.
    Important terms  PARAMETRICTEST- in this test population constant like mean , std.deviation , std.error, co-relation , co-efficient proportion etc. and data tend to follow one assumed or established such as normal, binominal etc.  NON PARAMETRIC TEST – The test in which the no content of the population is used data do no follow any specific distribution and no assumption are made in these test e.g. : to classify the goods better and best we use the arbiter numbers or marks to each category  HYPOTHESIS -  DEGREE OF FREEDOM  CONTINGENCY TABLE
  • 4.
    EXPLANATION OF CHISQUARE TEST # 1 2 3 4 5 6 Possibility's 22 24 38 30 46 44 # 1 2 3 4 5 6 Possibility's 34 34 34 34 34 34 OBSERVED VALUE - EXPECTED VALUE - total=204 #=dies value E(1)=204(1/6)=34 E(2)=204(1/6)=34
  • 5.
    STEPS FOR PERFORMANCEOF CHI SQUARE TEST/HYPOTHESIS TEST State null (Ho) or alternative hypothesis (Ha) Choose the level of significance (infinite) Find the critical value Find the test statistics Conclusion
  • 6.
    STATE NULL (HO)OR ALTERNATIVE HYPOTHESIS (HA) Null hypothesis Ho=dies is fair Observation fit the operation value Alternative hypothesis Ha=dies is no fair
  • 7.
    CHOOSE THE LEVELOF SIGNIFICANCE Regection region 0.1 Cv=15.086 0.1 is the amt that used ..we can use any amt smaller the amt used quick the value can be dertmined 15.21
  • 8.
    FIND THE CRITICALVALUE Degrees of freedom 2 X .050 2 X .025 2 X .010 2 X .005 1 3.841 5.024 6.635 7.879 2 5.991 7.378 9.210 10.597 3 7.815 9.348 11.345 12.835 4 9.488 11.143 13.277 14.860 5 11.070 12.833 15.086 16.750
  • 9.
    FIND THE TESTSTATISTICS 2 2 X = sum  (22-34)2/34  (24-34)2/34……………..till last unit the total will be 15.21 test statistics (o-e) e
  • 10.
    ASSUMPTIONS  2 KEYASSUMPTIONS TO BE AWARE OF BEFORE APPLYING THE CHI- SQUARE TEST  Sample Size Assumption: The chi-square test can be used to determine differences in proportions using a two-by- two contingency table. ...  Independence Assumption: Secondly, the chi-square test cannot be used on correlated data.
  • 11.
    LIMITATIONS OF THECHI-SQUARE TEST The chi-square test does not give us much information about the strength of the relationship or its substantive significance in the population. The chi-square test is sensitive to sample size. The size of the calculated chi-square is directly proportional to the size of the sample, independent of the strength of the relationship between the variables The chi-square test is also sensitive to small expected frequencies in one or more of the cells in the table.
  • 12.
    WHAT IS THEUSE OF CHI SQUARE TEST? The chi-squared test is used to determine whether there is a significant difference between the expected frequencies and the observed frequencies in one or more categories.
  • 13.
    APPLICATION OF ACHI SQUARE TEST Good ness of fit of distribution Test of independence of attributes Test of homogeneity
  • 14.
    Conclusion The chi-square testis no doubt a most frequently used test, but its correct application is equally an uphill task.
  • 15.