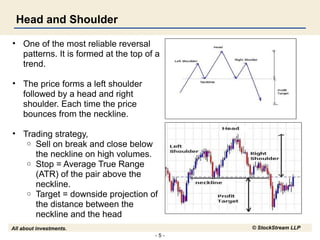
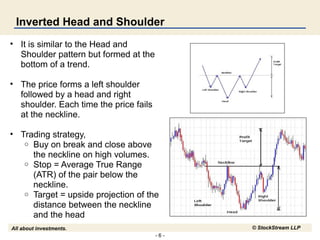
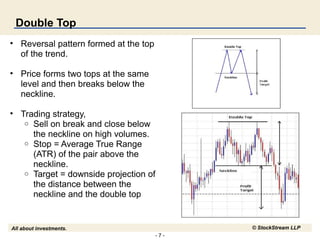
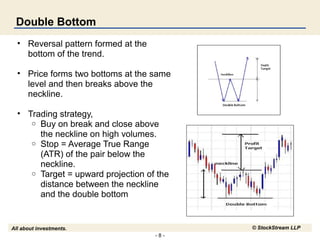
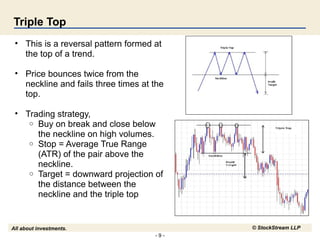
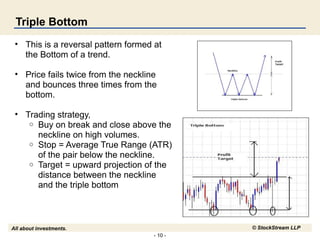
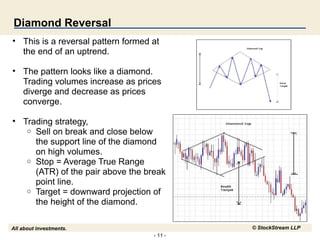
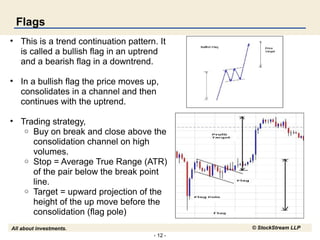
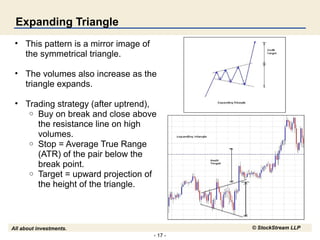
SlideShare a Scribd company logo
1 of 18
Investment InsightsInvestment Insights
Chart Patterns
StockStream LLP
All about investments. © StockStream LLP
Disclaimer
• Trading carries significant risk of losses and may not be suitable for all
investors. Traders should assess these risks either themselves or in
consultation with a financial advisor before investing.
• There is no guarantee that the trading techniques, methods and other
information in this presentation will result in profits. The content in this
presentation in only intended for educational and informational
purposes and not intended as trading recommendation.
• The content of this presentation is subject to change without notice.
• Stockstream Financial Advisory Services LLP or mystockstream.com
will not take any liability or accountability of losses arising from the use
of information in this presentation in any manner.
- 3 -
All about investments. © StockStream LLP
StockStream Education Model
- 4 -
All about investments. © StockStream LLP
Introduction
• Chart patterns are formations that indicate either a reversal or
continuation of a trend.
• These can be used independently or in combination with
other technical indicators to develop trading strategies.
• Some of the common chart patterns are,
o Head and Shoulder
o Double Tops and Bottoms
o Triangles, Wedges
o Flags, Pennants
o Rounded Tops and Bottoms
- 5 -
All about investments. © StockStream LLP
Head and Shoulder
• One of the most reliable reversal
patterns. It is formed at the top of a
trend.
• The price forms a left shoulder
followed by a head and right
shoulder. Each time the price
bounces from the neckline.
• Trading strategy,
o Sell on break and close below
the neckline on high volumes.
o Stop = Average True Range
(ATR) of the pair above the
neckline.
o Target = downside projection of
the distance between the
neckline and the head
- 6 -
All about investments. © StockStream LLP
Inverted Head and Shoulder
• It is similar to the Head and
Shoulder pattern but formed at the
bottom of a trend.
• The price forms a left shoulder
followed by a head and right
shoulder. Each time the price fails
at the neckline.
• Trading strategy,
o Buy on break and close above
the neckline on high volumes.
o Stop = Average True Range
(ATR) of the pair below the
neckline.
o Target = upside projection of the
distance between the neckline
and the head
- 7 -
All about investments. © StockStream LLP
Double Top
• Reversal pattern formed at the top
of the trend.
• Price forms two tops at the same
level and then breaks below the
neckline.
• Trading strategy,
o Sell on break and close below
the neckline on high volumes.
o Stop = Average True Range
(ATR) of the pair above the
neckline.
o Target = downside projection of
the distance between the
neckline and the double top
- 8 -
All about investments. © StockStream LLP
Double Bottom
• Reversal pattern formed at the
bottom of the trend.
• Price forms two bottoms at the same
level and then breaks above the
neckline.
• Trading strategy,
o Buy on break and close above
the neckline on high volumes.
o Stop = Average True Range
(ATR) of the pair below the
neckline.
o Target = upward projection of the
distance between the neckline
and the double bottom
- 9 -
All about investments. © StockStream LLP
Triple Top
• This is a reversal pattern formed at
the top of a trend.
• Price bounces twice from the
neckline and fails three times at the
top.
• Trading strategy,
o Buy on break and close below
the neckline on high volumes.
o Stop = Average True Range
(ATR) of the pair above the
neckline.
o Target = downward projection of
the distance between the
neckline and the triple top
- 10 -
All about investments. © StockStream LLP
Triple Bottom
• This is a reversal pattern formed at
the Bottom of a trend.
• Price fails twice from the neckline
and bounces three times from the
bottom.
• Trading strategy,
o Buy on break and close above the
neckline on high volumes.
o Stop = Average True Range (ATR)
of the pair below the neckline.
o Target = upward projection of the
distance between the neckline
and the triple bottom
- 11 -
All about investments. © StockStream LLP
Diamond Reversal
• This is a reversal pattern formed at
the end of an uptrend.
• The pattern looks like a diamond.
Trading volumes increase as prices
diverge and decrease as prices
converge.
• Trading strategy,
o Sell on break and close below
the support line of the diamond
on high volumes.
o Stop = Average True Range
(ATR) of the pair above the break
point line.
o Target = downward projection of
the height of the diamond.
- 12 -
All about investments. © StockStream LLP
Flags
• This is a trend continuation pattern. It
is called a bullish flag in an uptrend
and a bearish flag in a downtrend.
• In a bullish flag the price moves up,
consolidates in a channel and then
continues with the uptrend.
• Trading strategy,
o Buy on break and close above the
consolidation channel on high
volumes.
o Stop = Average True Range (ATR)
of the pair below the break point
line.
o Target = upward projection of the
height of the up move before the
consolidation (flag pole)
- 13 -
All about investments. © StockStream LLP
Pennants
• This is a trend continuation pattern.
It is called a bullish pennant in an
uptrend and a bearish pennant in a
downtrend.
• It is similar to a flag with the
exception that the consolidation area
looks like a pennant.
• Trading strategy,
o Buy on break and close above
the pennant on high volumes.
o Stop = Average True Range
(ATR) of the pair below the break
point line.
o Target = upward projection of the
height of the up move before the
consolidation (pennant pole)
- 14 -
All about investments. © StockStream LLP
Rectangles
• Rectangular pattern is a
consolidation after an uptrend or
downtrend.
• Markets continue to trade in the
direction of the trend after
consolidating. Thus, it is a
continuation pattern.
• Trading strategy (after uptrend),
o Buy on break and close above
the range top on high volumes.
o Stop = Average True Range
(ATR) of the pair below the
break point line.
o Target = upward projection of
the height of the rectangle
consolidation.
- 15 -
All about investments. © StockStream LLP
Symmetrical Triangles
• A triangle is a consolidation
pattern after an uptrend or
downtrend.
• A symmetrical triangle has 2
symmetrical converging support
and resistance lines.
• Trading strategy (after uptrend),
o Buy on break and close above
the resistance line on high
volumes.
o Stop = Average True Range
(ATR) of the pair below the
break point.
o Target = upward projection of
the height of the triangle.
- 16 -
All about investments. © StockStream LLP
Ascending Triangle
• This pattern is formed after an uptrend
and indicates increasing demand at
higher prices.
• This pattern consists of a flat resistance
line and an rising support line.
• Trading strategy (after uptrend),
o Buy on break and close above the
resistance line on high volumes.
o Stop = Average True Range (ATR) of
the pair below the break point.
o Target = upward projection of the
height of the triangle.
• A descending triangle is a similar pattern
that is formed after a downtrend.
- 17 -
All about investments. © StockStream LLP
Expanding Triangle
• This pattern is a mirror image of
the symmetrical triangle.
• The volumes also increase as the
triangle expands.
• Trading strategy (after uptrend),
o Buy on break and close above
the resistance line on high
volumes.
o Stop = Average True Range
(ATR) of the pair below the
break point.
o Target = upward projection of
the height of the triangle.
- 18 -
All about investments. © StockStream LLP
Questions
• Visit and register at mystockstream.com
• Follow and interact with StockStream Experts for answers
• StockStream Education
• StockStream Forex
• StockStream Commodity
• StockStream India

More Related Content

What's hot

Introduction to Technical Analysis
Introduction to Technical AnalysisIntroduction to Technical Analysis
Introduction to Technical Analysis
mediafin
 
Technical analysis ppt
Technical analysis pptTechnical analysis ppt
Technical analysis ppt
rahul94
 
Technical Analysis
Technical AnalysisTechnical Analysis
Technical Analysis
snehalsoni
 
Technical indicators
Technical indicatorsTechnical indicators
Technical indicators
vermaayushi
 
Candlestick presentation
Candlestick presentationCandlestick presentation
Candlestick presentation
Jenn Astwood
 

What's hot (20)

Technical analysis
Technical analysisTechnical analysis
Technical analysis
 
Introduction to Technical Analysis
Introduction to Technical AnalysisIntroduction to Technical Analysis
Introduction to Technical Analysis
 
Technical analysis doc
Technical analysis doc Technical analysis doc
Technical analysis doc
 
Technical analysis ppt
Technical analysis pptTechnical analysis ppt
Technical analysis ppt
 
Technical Analysis
Technical AnalysisTechnical Analysis
Technical Analysis
 
Technical indicators
Technical indicatorsTechnical indicators
Technical indicators
 
Technical Analysis
Technical AnalysisTechnical Analysis
Technical Analysis
 
Moving average -Technical Analysis
Moving average -Technical AnalysisMoving average -Technical Analysis
Moving average -Technical Analysis
 
Technical analysis OF STOCK MARKET presentation of mba 4 sem FINANCE PPT
Technical analysis OF STOCK MARKET  presentation of mba 4 sem FINANCE PPTTechnical analysis OF STOCK MARKET  presentation of mba 4 sem FINANCE PPT
Technical analysis OF STOCK MARKET presentation of mba 4 sem FINANCE PPT
 
technical analysis
technical analysistechnical analysis
technical analysis
 
Naked short selling
Naked short sellingNaked short selling
Naked short selling
 
Technical analysis
Technical analysisTechnical analysis
Technical analysis
 
mastering-candlestick-charts-part-i
mastering-candlestick-charts-part-imastering-candlestick-charts-part-i
mastering-candlestick-charts-part-i
 
Candlestick presentation
Candlestick presentationCandlestick presentation
Candlestick presentation
 
Basic Technical Analysis
Basic Technical AnalysisBasic Technical Analysis
Basic Technical Analysis
 
Elliot wave theory
Elliot wave theoryElliot wave theory
Elliot wave theory
 
Support resistance trading strategies
Support resistance trading strategiesSupport resistance trading strategies
Support resistance trading strategies
 
Technical Analysis Of Stock Market
Technical Analysis Of Stock MarketTechnical Analysis Of Stock Market
Technical Analysis Of Stock Market
 
Technical chart patterns
Technical chart patternsTechnical chart patterns
Technical chart patterns
 
Price action trading1
Price action trading1Price action trading1
Price action trading1
 

Viewers also liked (8)

Arbitrage
ArbitrageArbitrage
Arbitrage
 
Ch 05
Ch 05Ch 05
Ch 05
 
Arbitrage
ArbitrageArbitrage
Arbitrage
 
Portfolio rebalancing made simple
Portfolio rebalancing made simplePortfolio rebalancing made simple
Portfolio rebalancing made simple
 
Analysis of covariance
Analysis of covarianceAnalysis of covariance
Analysis of covariance
 
Resistance To Change
Resistance To ChangeResistance To Change
Resistance To Change
 
Portfolio revision
Portfolio revisionPortfolio revision
Portfolio revision
 
Fundamental analysis and technical analysis
Fundamental analysis and technical analysisFundamental analysis and technical analysis
Fundamental analysis and technical analysis
 

Similar to Chart patterns

Chart pattern is the new thing in technical indicators
Chart pattern is the new thing in technical indicatorsChart pattern is the new thing in technical indicators
Chart pattern is the new thing in technical indicators
asthadcffiles
 
Trading the news
Trading the newsTrading the news
Trading the news
ypendharkar
 
Using Triangles in Technical Analysis
Using Triangles  in Technical AnalysisUsing Triangles  in Technical Analysis
Using Triangles in Technical Analysis
Sangamèsh Ks
 
Using triangles in Technical Analysis
Using triangles  in Technical AnalysisUsing triangles  in Technical Analysis
Using triangles in Technical Analysis
Sangamesh K.S
 

Similar to Chart patterns (20)

Chart pattern is the new thing in technical indicators
Chart pattern is the new thing in technical indicatorsChart pattern is the new thing in technical indicators
Chart pattern is the new thing in technical indicators
 
candlestickpattern.ppt
candlestickpattern.pptcandlestickpattern.ppt
candlestickpattern.ppt
 
Technical analysis
Technical analysisTechnical analysis
Technical analysis
 
Technical analysis
Technical analysisTechnical analysis
Technical analysis
 
Technical analysis 101 part 3
Technical analysis 101 part 3Technical analysis 101 part 3
Technical analysis 101 part 3
 
Lesson BTF110. Chart Patterns for Binary Trading
Lesson BTF110. Chart Patterns for Binary TradingLesson BTF110. Chart Patterns for Binary Trading
Lesson BTF110. Chart Patterns for Binary Trading
 
Trading the news
Trading the newsTrading the news
Trading the news
 
Pivot points
Pivot pointsPivot points
Pivot points
 
Types of charts
Types of chartsTypes of charts
Types of charts
 
Time of the day
Time of the dayTime of the day
Time of the day
 
Fundamental analysis
Fundamental analysis Fundamental analysis
Fundamental analysis
 
Lecture no 33 short put butterfly
Lecture no 33   short put butterflyLecture no 33   short put butterfly
Lecture no 33 short put butterfly
 
Cmt learning objective 4 trend system part i
Cmt learning objective 4   trend system part iCmt learning objective 4   trend system part i
Cmt learning objective 4 trend system part i
 
LC's Forex Trading System
LC's Forex Trading SystemLC's Forex Trading System
LC's Forex Trading System
 
May 19 I Session 2 I GBIH
May 19 I Session 2 I GBIHMay 19 I Session 2 I GBIH
May 19 I Session 2 I GBIH
 
May 13 I Session 2 I GBIH
May 13 I Session 2 I GBIHMay 13 I Session 2 I GBIH
May 13 I Session 2 I GBIH
 
Using Triangles in Technical Analysis
Using Triangles  in Technical AnalysisUsing Triangles  in Technical Analysis
Using Triangles in Technical Analysis
 
Using triangles in Technical Analysis
Using triangles  in Technical AnalysisUsing triangles  in Technical Analysis
Using triangles in Technical Analysis
 
Technical analysis
Technical analysisTechnical analysis
Technical analysis
 
How to Trade Chart Patterns with Target and SL@forexgdp.com.pdf
How to Trade Chart Patterns with Target and SL@forexgdp.com.pdfHow to Trade Chart Patterns with Target and SL@forexgdp.com.pdf
How to Trade Chart Patterns with Target and SL@forexgdp.com.pdf
 

More from ypendharkar (6)

Fundamental vs technical
Fundamental vs technicalFundamental vs technical
Fundamental vs technical
 
Fibonacci analysis
Fibonacci analysisFibonacci analysis
Fibonacci analysis
 
Risk management
Risk managementRisk management
Risk management
 
Multiple time frames
Multiple time framesMultiple time frames
Multiple time frames
 
Elliott wave analysis
Elliott wave analysisElliott wave analysis
Elliott wave analysis
 
Carry trade
Carry tradeCarry trade
Carry trade
 

Recently uploaded

Spellings Wk 4 and Wk 5 for Grade 4 at CAPS
Spellings Wk 4 and Wk 5 for Grade 4 at CAPSSpellings Wk 4 and Wk 5 for Grade 4 at CAPS
Spellings Wk 4 and Wk 5 for Grade 4 at CAPS
AnaAcapella
 
Transparency, Recognition and the role of eSealing - Ildiko Mazar and Koen No...
Transparency, Recognition and the role of eSealing - Ildiko Mazar and Koen No...Transparency, Recognition and the role of eSealing - Ildiko Mazar and Koen No...
Transparency, Recognition and the role of eSealing - Ildiko Mazar and Koen No...
EADTU
 
The basics of sentences session 3pptx.pptx
The basics of sentences session 3pptx.pptxThe basics of sentences session 3pptx.pptx
The basics of sentences session 3pptx.pptx
heathfieldcps1
 

Recently uploaded (20)

Model Attribute _rec_name in the Odoo 17
Model Attribute _rec_name in the Odoo 17Model Attribute _rec_name in the Odoo 17
Model Attribute _rec_name in the Odoo 17
 
Python Notes for mca i year students osmania university.docx
Python Notes for mca i year students osmania university.docxPython Notes for mca i year students osmania university.docx
Python Notes for mca i year students osmania university.docx
 
Spellings Wk 4 and Wk 5 for Grade 4 at CAPS
Spellings Wk 4 and Wk 5 for Grade 4 at CAPSSpellings Wk 4 and Wk 5 for Grade 4 at CAPS
Spellings Wk 4 and Wk 5 for Grade 4 at CAPS
 
Our Environment Class 10 Science Notes pdf
Our Environment Class 10 Science Notes pdfOur Environment Class 10 Science Notes pdf
Our Environment Class 10 Science Notes pdf
 
Simple, Complex, and Compound Sentences Exercises.pdf
Simple, Complex, and Compound Sentences Exercises.pdfSimple, Complex, and Compound Sentences Exercises.pdf
Simple, Complex, and Compound Sentences Exercises.pdf
 
Transparency, Recognition and the role of eSealing - Ildiko Mazar and Koen No...
Transparency, Recognition and the role of eSealing - Ildiko Mazar and Koen No...Transparency, Recognition and the role of eSealing - Ildiko Mazar and Koen No...
Transparency, Recognition and the role of eSealing - Ildiko Mazar and Koen No...
 
UGC NET Paper 1 Unit 7 DATA INTERPRETATION.pdf
UGC NET Paper 1 Unit 7 DATA INTERPRETATION.pdfUGC NET Paper 1 Unit 7 DATA INTERPRETATION.pdf
UGC NET Paper 1 Unit 7 DATA INTERPRETATION.pdf
 
OS-operating systems- ch05 (CPU Scheduling) ...
OS-operating systems- ch05 (CPU Scheduling) ...OS-operating systems- ch05 (CPU Scheduling) ...
OS-operating systems- ch05 (CPU Scheduling) ...
 
How to Manage Global Discount in Odoo 17 POS
How to Manage Global Discount in Odoo 17 POSHow to Manage Global Discount in Odoo 17 POS
How to Manage Global Discount in Odoo 17 POS
 
Details on CBSE Compartment Exam.pptx1111
Details on CBSE Compartment Exam.pptx1111Details on CBSE Compartment Exam.pptx1111
Details on CBSE Compartment Exam.pptx1111
 
Play hard learn harder: The Serious Business of Play
Play hard learn harder:  The Serious Business of PlayPlay hard learn harder:  The Serious Business of Play
Play hard learn harder: The Serious Business of Play
 
Interdisciplinary_Insights_Data_Collection_Methods.pptx
Interdisciplinary_Insights_Data_Collection_Methods.pptxInterdisciplinary_Insights_Data_Collection_Methods.pptx
Interdisciplinary_Insights_Data_Collection_Methods.pptx
 
Unit 3 Emotional Intelligence and Spiritual Intelligence.pdf
Unit 3 Emotional Intelligence and Spiritual Intelligence.pdfUnit 3 Emotional Intelligence and Spiritual Intelligence.pdf
Unit 3 Emotional Intelligence and Spiritual Intelligence.pdf
 
Understanding Accommodations and Modifications
Understanding  Accommodations and ModificationsUnderstanding  Accommodations and Modifications
Understanding Accommodations and Modifications
 
The basics of sentences session 3pptx.pptx
The basics of sentences session 3pptx.pptxThe basics of sentences session 3pptx.pptx
The basics of sentences session 3pptx.pptx
 
FSB Advising Checklist - Orientation 2024
FSB Advising Checklist - Orientation 2024FSB Advising Checklist - Orientation 2024
FSB Advising Checklist - Orientation 2024
 
21st_Century_Skills_Framework_Final_Presentation_2.pptx
21st_Century_Skills_Framework_Final_Presentation_2.pptx21st_Century_Skills_Framework_Final_Presentation_2.pptx
21st_Century_Skills_Framework_Final_Presentation_2.pptx
 
Jamworks pilot and AI at Jisc (20/03/2024)
Jamworks pilot and AI at Jisc (20/03/2024)Jamworks pilot and AI at Jisc (20/03/2024)
Jamworks pilot and AI at Jisc (20/03/2024)
 
OSCM Unit 2_Operations Processes & Systems
OSCM Unit 2_Operations Processes & SystemsOSCM Unit 2_Operations Processes & Systems
OSCM Unit 2_Operations Processes & Systems
 
Beyond_Borders_Understanding_Anime_and_Manga_Fandom_A_Comprehensive_Audience_...
Beyond_Borders_Understanding_Anime_and_Manga_Fandom_A_Comprehensive_Audience_...Beyond_Borders_Understanding_Anime_and_Manga_Fandom_A_Comprehensive_Audience_...
Beyond_Borders_Understanding_Anime_and_Manga_Fandom_A_Comprehensive_Audience_...
 

Chart patterns

  • 2. All about investments. © StockStream LLP Disclaimer • Trading carries significant risk of losses and may not be suitable for all investors. Traders should assess these risks either themselves or in consultation with a financial advisor before investing. • There is no guarantee that the trading techniques, methods and other information in this presentation will result in profits. The content in this presentation in only intended for educational and informational purposes and not intended as trading recommendation. • The content of this presentation is subject to change without notice. • Stockstream Financial Advisory Services LLP or mystockstream.com will not take any liability or accountability of losses arising from the use of information in this presentation in any manner.
  • 3. - 3 - All about investments. © StockStream LLP StockStream Education Model
  • 4. - 4 - All about investments. © StockStream LLP Introduction • Chart patterns are formations that indicate either a reversal or continuation of a trend. • These can be used independently or in combination with other technical indicators to develop trading strategies. • Some of the common chart patterns are, o Head and Shoulder o Double Tops and Bottoms o Triangles, Wedges o Flags, Pennants o Rounded Tops and Bottoms
  • 5. - 5 - All about investments. © StockStream LLP Head and Shoulder • One of the most reliable reversal patterns. It is formed at the top of a trend. • The price forms a left shoulder followed by a head and right shoulder. Each time the price bounces from the neckline. • Trading strategy, o Sell on break and close below the neckline on high volumes. o Stop = Average True Range (ATR) of the pair above the neckline. o Target = downside projection of the distance between the neckline and the head
  • 6. - 6 - All about investments. © StockStream LLP Inverted Head and Shoulder • It is similar to the Head and Shoulder pattern but formed at the bottom of a trend. • The price forms a left shoulder followed by a head and right shoulder. Each time the price fails at the neckline. • Trading strategy, o Buy on break and close above the neckline on high volumes. o Stop = Average True Range (ATR) of the pair below the neckline. o Target = upside projection of the distance between the neckline and the head
  • 7. - 7 - All about investments. © StockStream LLP Double Top • Reversal pattern formed at the top of the trend. • Price forms two tops at the same level and then breaks below the neckline. • Trading strategy, o Sell on break and close below the neckline on high volumes. o Stop = Average True Range (ATR) of the pair above the neckline. o Target = downside projection of the distance between the neckline and the double top
  • 8. - 8 - All about investments. © StockStream LLP Double Bottom • Reversal pattern formed at the bottom of the trend. • Price forms two bottoms at the same level and then breaks above the neckline. • Trading strategy, o Buy on break and close above the neckline on high volumes. o Stop = Average True Range (ATR) of the pair below the neckline. o Target = upward projection of the distance between the neckline and the double bottom
  • 9. - 9 - All about investments. © StockStream LLP Triple Top • This is a reversal pattern formed at the top of a trend. • Price bounces twice from the neckline and fails three times at the top. • Trading strategy, o Buy on break and close below the neckline on high volumes. o Stop = Average True Range (ATR) of the pair above the neckline. o Target = downward projection of the distance between the neckline and the triple top
  • 10. - 10 - All about investments. © StockStream LLP Triple Bottom • This is a reversal pattern formed at the Bottom of a trend. • Price fails twice from the neckline and bounces three times from the bottom. • Trading strategy, o Buy on break and close above the neckline on high volumes. o Stop = Average True Range (ATR) of the pair below the neckline. o Target = upward projection of the distance between the neckline and the triple bottom
  • 11. - 11 - All about investments. © StockStream LLP Diamond Reversal • This is a reversal pattern formed at the end of an uptrend. • The pattern looks like a diamond. Trading volumes increase as prices diverge and decrease as prices converge. • Trading strategy, o Sell on break and close below the support line of the diamond on high volumes. o Stop = Average True Range (ATR) of the pair above the break point line. o Target = downward projection of the height of the diamond.
  • 12. - 12 - All about investments. © StockStream LLP Flags • This is a trend continuation pattern. It is called a bullish flag in an uptrend and a bearish flag in a downtrend. • In a bullish flag the price moves up, consolidates in a channel and then continues with the uptrend. • Trading strategy, o Buy on break and close above the consolidation channel on high volumes. o Stop = Average True Range (ATR) of the pair below the break point line. o Target = upward projection of the height of the up move before the consolidation (flag pole)
  • 13. - 13 - All about investments. © StockStream LLP Pennants • This is a trend continuation pattern. It is called a bullish pennant in an uptrend and a bearish pennant in a downtrend. • It is similar to a flag with the exception that the consolidation area looks like a pennant. • Trading strategy, o Buy on break and close above the pennant on high volumes. o Stop = Average True Range (ATR) of the pair below the break point line. o Target = upward projection of the height of the up move before the consolidation (pennant pole)
  • 14. - 14 - All about investments. © StockStream LLP Rectangles • Rectangular pattern is a consolidation after an uptrend or downtrend. • Markets continue to trade in the direction of the trend after consolidating. Thus, it is a continuation pattern. • Trading strategy (after uptrend), o Buy on break and close above the range top on high volumes. o Stop = Average True Range (ATR) of the pair below the break point line. o Target = upward projection of the height of the rectangle consolidation.
  • 15. - 15 - All about investments. © StockStream LLP Symmetrical Triangles • A triangle is a consolidation pattern after an uptrend or downtrend. • A symmetrical triangle has 2 symmetrical converging support and resistance lines. • Trading strategy (after uptrend), o Buy on break and close above the resistance line on high volumes. o Stop = Average True Range (ATR) of the pair below the break point. o Target = upward projection of the height of the triangle.
  • 16. - 16 - All about investments. © StockStream LLP Ascending Triangle • This pattern is formed after an uptrend and indicates increasing demand at higher prices. • This pattern consists of a flat resistance line and an rising support line. • Trading strategy (after uptrend), o Buy on break and close above the resistance line on high volumes. o Stop = Average True Range (ATR) of the pair below the break point. o Target = upward projection of the height of the triangle. • A descending triangle is a similar pattern that is formed after a downtrend.
  • 17. - 17 - All about investments. © StockStream LLP Expanding Triangle • This pattern is a mirror image of the symmetrical triangle. • The volumes also increase as the triangle expands. • Trading strategy (after uptrend), o Buy on break and close above the resistance line on high volumes. o Stop = Average True Range (ATR) of the pair below the break point. o Target = upward projection of the height of the triangle.
  • 18. - 18 - All about investments. © StockStream LLP Questions • Visit and register at mystockstream.com • Follow and interact with StockStream Experts for answers • StockStream Education • StockStream Forex • StockStream Commodity • StockStream India