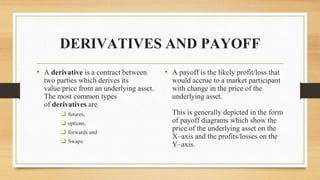
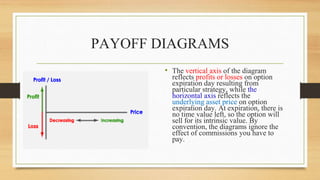
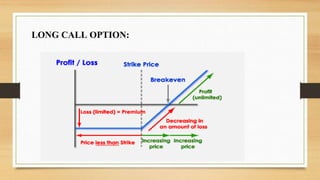
FUTURES AND
OPTIONS
SEMINAR TOPIC :
PAYOFF-OPTIONS
NAME : D.ANUSHYA
REG.NO.:182CM001
CLASS :II M.Com. (CA)
SYNOPSIS
❏ DERIVATIVES AND PAYOFF
❏ PAYOFF DIAGRAM
❏ MEANING
❏ PAYOFF CALL OPTION
❏ OPTION
❏ TYPES OF OPTION
❏ OPTION TERMINOLOGY
❏ REFERENCE
DERIVATIVES AND PAYOFF
• A derivative is a contract between
two parties which derives its
value/price from an underlying asset.
The most common types
of derivatives are
❑ futures,
❑ options,
❑ forwards and
❑ Swaps.
• A payoff is the likely profit/loss that
would accrue to a market participant
with change in the price of the
underlying asset.
This is generally depicted in the form
of payoff diagrams which show the
price of the underlying asset on the
X–axis and the profits/losses on the
Y–axis.
PAYOFF DIAGRAM MEANING
• “Pay off diagrams” a good way to understand the profits and losses
with a strategy
• A convenient way to envision what happens with option strategies as
the value of the underlying asset changes is with the use of a profit and
loss diagram, known as a “payoff diagram”. A Payoff diagram is a
graphical representation of the potential outcomes of a strategy. Results
may be depicted at any point in time, although the graph usually depicts
the results at expiration of the options involved in the strategy.
PAYOFF DIAGRAMS
• The vertical axis of the diagram
reflects profits or losses on option
expiration day resulting from
particular strategy, while the
horizontal axis reflects the
underlying asset price on option
expiration day. At expiration, there is
no time value left, so the option will
sell for its intrinsic value. By
convention, the diagrams ignore the
effect of commissions you have to
pay.
LONG CALL OPTION:
4 MAIN STRATEGIES OF OPTIONS
INVESTMENT
LONG CALL
OPTION
SHORT CALL
OPTION
LONG PUT
OPTION
SHORT PUT
OPTION
OPTIONS
● Options are financial instruments that are derivatives that are based on the
value of underlying securities such as stocks. An options contract offers
the buyer the opportunity to buy or sell—depending on the type of
contract they hold—the underlying asset.
● An option gives the holder the right/option, but no obligation, to buy or
sell a security to the option writer/seller.
○ for a pre-sepcified price(strike price)
○ at (or up to)a given time in the future(the expiry date)
TYPES OF OPTIONS
Options can be further categorized based on the method in
which they are traded, their expiration cycle, and the underlying security they
relate to.
• Calls
• Puts
• American Style
• European Style
• Exchange Traded Options
• Over The Counter Options
•Option Type by Expiration
•Option Type by Underlying Security
•Employee Stock Options
•Cash Settled Options
•Exotic Options
OPTION TERMINOLOGIES
★ STRIKE PRICE
★ MARKET PRICE
★ EXPIRATION DATE
★ OPTION TYPE
★ BUYER AND WRITER OF A OPTION
★ MONEYNESS
■ IN THE MONEY
■ OUT THE MONEY
■ AT THE MONEY
REFERENCE
• http://www.managementparadise.com/forums/financial-management-
fm/203087-payoff-pricing-futures-options.html
• https://www2.poems.in.th/home/derivatives/en/options04.htm
• http://faculty.baruch.cuny.edu/lwu/890/890payoff.pdf
Payoff options

Payoff options

  • 1.
    FUTURES AND OPTIONS SEMINAR TOPIC: PAYOFF-OPTIONS NAME : D.ANUSHYA REG.NO.:182CM001 CLASS :II M.Com. (CA)
  • 2.
    SYNOPSIS ❏ DERIVATIVES ANDPAYOFF ❏ PAYOFF DIAGRAM ❏ MEANING ❏ PAYOFF CALL OPTION ❏ OPTION ❏ TYPES OF OPTION ❏ OPTION TERMINOLOGY ❏ REFERENCE
  • 3.
    DERIVATIVES AND PAYOFF •A derivative is a contract between two parties which derives its value/price from an underlying asset. The most common types of derivatives are ❑ futures, ❑ options, ❑ forwards and ❑ Swaps. • A payoff is the likely profit/loss that would accrue to a market participant with change in the price of the underlying asset. This is generally depicted in the form of payoff diagrams which show the price of the underlying asset on the X–axis and the profits/losses on the Y–axis.
  • 4.
    PAYOFF DIAGRAM MEANING •“Pay off diagrams” a good way to understand the profits and losses with a strategy • A convenient way to envision what happens with option strategies as the value of the underlying asset changes is with the use of a profit and loss diagram, known as a “payoff diagram”. A Payoff diagram is a graphical representation of the potential outcomes of a strategy. Results may be depicted at any point in time, although the graph usually depicts the results at expiration of the options involved in the strategy.
  • 5.
    PAYOFF DIAGRAMS • Thevertical axis of the diagram reflects profits or losses on option expiration day resulting from particular strategy, while the horizontal axis reflects the underlying asset price on option expiration day. At expiration, there is no time value left, so the option will sell for its intrinsic value. By convention, the diagrams ignore the effect of commissions you have to pay.
  • 6.
  • 7.
    4 MAIN STRATEGIESOF OPTIONS INVESTMENT LONG CALL OPTION SHORT CALL OPTION LONG PUT OPTION SHORT PUT OPTION
  • 8.
    OPTIONS ● Options arefinancial instruments that are derivatives that are based on the value of underlying securities such as stocks. An options contract offers the buyer the opportunity to buy or sell—depending on the type of contract they hold—the underlying asset. ● An option gives the holder the right/option, but no obligation, to buy or sell a security to the option writer/seller. ○ for a pre-sepcified price(strike price) ○ at (or up to)a given time in the future(the expiry date)
  • 9.
    TYPES OF OPTIONS Optionscan be further categorized based on the method in which they are traded, their expiration cycle, and the underlying security they relate to. • Calls • Puts • American Style • European Style • Exchange Traded Options • Over The Counter Options •Option Type by Expiration •Option Type by Underlying Security •Employee Stock Options •Cash Settled Options •Exotic Options
  • 10.
    OPTION TERMINOLOGIES ★ STRIKEPRICE ★ MARKET PRICE ★ EXPIRATION DATE ★ OPTION TYPE ★ BUYER AND WRITER OF A OPTION ★ MONEYNESS ■ IN THE MONEY ■ OUT THE MONEY ■ AT THE MONEY
  • 11.