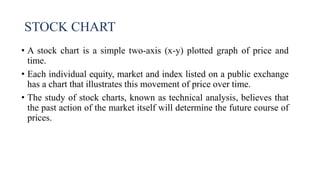
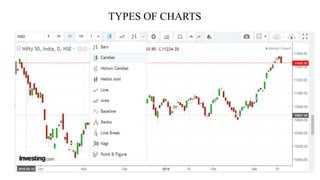
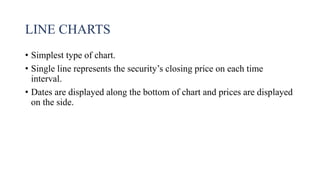
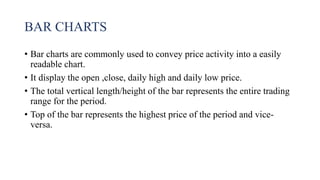
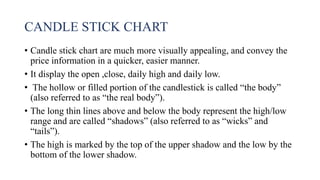
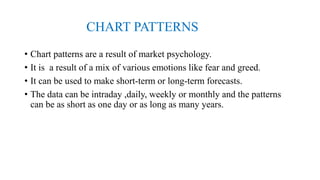
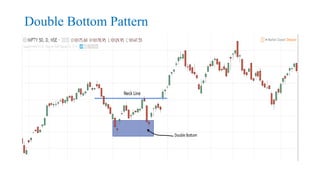
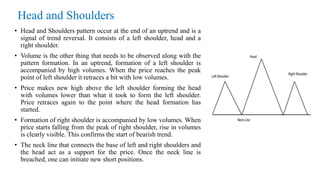
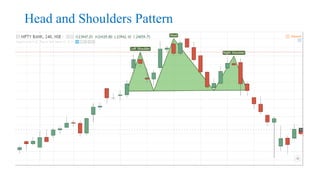
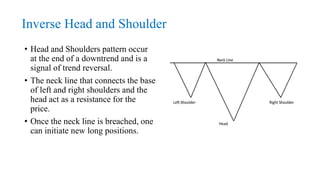
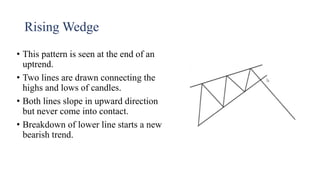
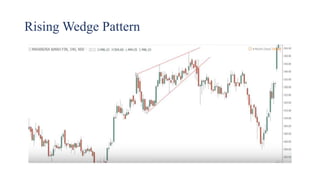
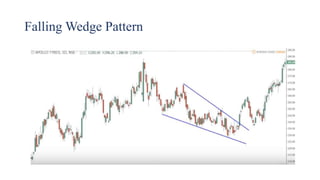
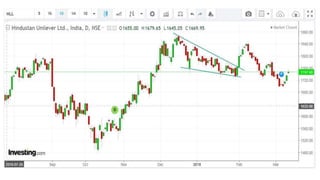
SlideShare a Scribd company logo
1 of 47
STOCK CHART -
CHART PATTERNS AND FORMATIONS -
ANALYSIS OF CHART PATTERN
AKBAR ALI.K
Dept. of Commerce
Pondicherry University
STOCK CHART
• A stock chart is a simple two-axis (x-y) plotted graph of price and
time.
• Each individual equity, market and index listed on a public exchange
has a chart that illustrates this movement of price over time.
• The study of stock charts, known as technical analysis, believes that
the past action of the market itself will determine the future course of
prices.
TYPES OF CHARTS
TIME INTERVAL
LINE CHARTS
• Simplest type of chart.
• Single line represents the security’s closing price on each time
interval.
• Dates are displayed along the bottom of chart and prices are displayed
on the side.
BAR CHARTS
• Bar charts are commonly used to convey price activity into a easily
readable chart.
• It display the open ,close, daily high and daily low price.
• The total vertical length/height of the bar represents the entire trading
range for the period.
• Top of the bar represents the highest price of the period and vice-
versa.
CANDLE STICK CHART
• Candle stick chart are much more visually appealing, and convey the
price information in a quicker, easier manner.
• It display the open ,close, daily high and daily low.
• The hollow or filled portion of the candlestick is called “the body”
(also referred to as “the real body”).
• The long thin lines above and below the body represent the high/low
range and are called “shadows” (also referred to as “wicks” and
“tails”).
• The high is marked by the top of the upper shadow and the low by the
bottom of the lower shadow.
Bullish Candle
• Open at bottom of body.
• Close at top of body.
• High – Top of wick.
• Low – Bottom of wick.
Bearish Candle
• Open at top of body.
• Close at bottom of body.
• High – Top of wick.
• Low – Bottom of wick.
CHART PATTERNS
• Chart patterns are a result of market psychology.
• It is a result of a mix of various emotions like fear and greed.
• It can be used to make short-term or long-term forecasts.
• The data can be intraday ,daily, weekly or monthly and the patterns
can be as short as one day or as long as many years.
Support
 A support zone is an area where buying interest exits.
 As the price reaches the support zone, participants are more inclined
towards buying.
 As the times passes by, demand will overcome supply and prevent the
price from falling below support.
 It is not true that, support levels will always hold.
 Breaking a support level further increases bearishness in the market.
Support Zone
Resistance
• A resistance zone is an area where selling interest exits.
• As the price reaches the resistance zone, participants are more inclined
towards selling.
• As the times passes by, supply will overcome demand and prevent the
price from rising above resistance.
• Breaking a resistance level further increases bullishness in the market.
Resistance Zone
Support Becoming Resistance And Vice-versa
When a support zone is broken, it can become a resistance zone for the future
price movement and vice versa. One such example is shown below
Types of chart patterns
• Double Top and Double Bottom
• Head and shoulder & Inverse Head and shoulder
• Symmetric Triangle
• Rectangle
• Rising & Falling Channel
• Rising & Falling wedges
Double Top
 A double top is a reversal pattern which
occurs following an extended uptrend.
 A pair of peaks is formed in which the 2nd
peak is at a lower height compared to the 1st
one.
 This signifies the weakness in prices to reach
a new high and sustain the existing trend.
Double Top Pattern
Double Bottom
• A double bottom is a reversal pattern which
occurs following an extended downtrend.
• A pair of troughs is formed in which the 2nd
trough is at a higher high compared to the 1st
one.
• This signifies the weakness in prices to reach
a new low and sustain the existing trend.
Double Bottom Pattern
Head and Shoulders
• Head and Shoulders pattern occur at the end of an uptrend and is a
signal of trend reversal. It consists of a left shoulder, head and a
right shoulder.
• Volume is the other thing that needs to be observed along with the
pattern formation. In an uptrend, formation of a left shoulder is
accompanied by high volumes. When the price reaches the peak
point of left shoulder it retraces a bit with low volumes.
• Price makes new high above the left shoulder forming the head
with volumes lower than what it took to form the left shoulder.
Price retraces again to the point where the head formation has
started.
• Formation of right shoulder is accompanied by low volumes. When
price starts falling from the peak of right shoulder, rise in volumes
is clearly visible. This confirms the start of bearish trend.
• The neck line that connects the base of left and right shoulders and
the head act as a support for the price. Once the neck line is
breached, one can initiate new short positions.
Head and Shoulders Pattern
Inverse Head and Shoulder
• Head and Shoulders pattern occur
at the end of a downtrend and is a
signal of trend reversal.
• The neck line that connects the base
of left and right shoulders and the
head act as a resistance for the
price.
• Once the neck line is breached, one
can initiate new long positions.
Inverse Head and Shoulder Pattern
Symmetric Triangle
• It can be seen anywhere in the chart.
• Price tend to follow in whichever direction
the breakout has happened.
• Lines are connected using Highs and Lows
of candles.
• Both the lines converge together.
Symmetric Triangle Pattern
Rectangle
• A rectangle is formed by connecting
the tops and bottoms of candles.
• Both the lines move parallelly in
horizontal direction.
• Price tends to move in whichever
direction there is a breakout.
Rectangle Pattern
Rising channel
• A Rising channel is formed by connecting the
tops and bottoms of candles.
• Both the lines slope parallel in upward
direction.
• At any time the distance between the lines is
same.
• Breakout happens on the lower line and price
tends to be bearish after that.
Rising channel Pattern
Falling Channel
• A falling channel is formed by
connecting the tops and bottoms of
candles.
• Both the lines slop parallelly in
downward direction.
• At any time the distance between
the lines is same.
• Breakout happens on the upper line
and price tends to be bullish after
that.
Falling Channel Pattern
Rising Wedge
• This pattern is seen at the end of an
uptrend.
• Two lines are drawn connecting the
highs and lows of candles.
• Both lines slope in upward direction
but never come into contact.
• Breakdown of lower line starts a new
bearish trend.
Rising Wedge Pattern
Falling Wedge
• This pattern is seen at the end of a
downtrend.
• Two lines are drawn connecting the
highs and lows of candles.
• Both line slope in downward direction
but never come into contact.
• Breakdown of upper line starts a new
bullish trend.
Falling Wedge Pattern
THANK YOU….

More Related Content

What's hot

17 Money Making Candlestick Formations
17 Money Making Candlestick Formations17 Money Making Candlestick Formations
17 Money Making Candlestick FormationsKenny Leng
 
Momentum indicators in tech. analysis
Momentum indicators in tech. analysisMomentum indicators in tech. analysis
Momentum indicators in tech. analysisPuneet Arora
 
Price action trading1
Price action trading1Price action trading1
Price action trading1labyo
 
Section 2 - Chapter 8 - Bar Chart Pattern (Price Pattern)
Section 2 - Chapter 8 - Bar Chart Pattern (Price Pattern)Section 2 - Chapter 8 - Bar Chart Pattern (Price Pattern)
Section 2 - Chapter 8 - Bar Chart Pattern (Price Pattern)Professional Training Academy
 
Using Triangles in Technical Analysis
Using Triangles  in Technical AnalysisUsing Triangles  in Technical Analysis
Using Triangles in Technical AnalysisSangamèsh Ks
 
Technical indicators
Technical indicatorsTechnical indicators
Technical indicatorsvermaayushi
 
Learn A Simple Range Trading Strategy
Learn A Simple Range Trading StrategyLearn A Simple Range Trading Strategy
Learn A Simple Range Trading StrategyNetpicksTrading
 
Introduction To Technical Analysis
Introduction To Technical AnalysisIntroduction To Technical Analysis
Introduction To Technical AnalysisTrilok Hg
 
Support and resistance trading
Support and resistance tradingSupport and resistance trading
Support and resistance tradingmgeek007
 
Candlestick cheat-sheet-rgb-final
Candlestick cheat-sheet-rgb-finalCandlestick cheat-sheet-rgb-final
Candlestick cheat-sheet-rgb-finalMichael Kleven
 
Technical analysis - By Sohan Khatri
Technical analysis - By Sohan KhatriTechnical analysis - By Sohan Khatri
Technical analysis - By Sohan KhatriSohan Khatri
 
Overview of price action trading
Overview of price action tradingOverview of price action trading
Overview of price action tradingChristineNelson17
 
A Look Back at 11 Stock Trading Setups
A Look Back at 11 Stock Trading SetupsA Look Back at 11 Stock Trading Setups
A Look Back at 11 Stock Trading SetupsInvestingWithOptions
 
Trade what you see not what you think
Trade what you see not what you thinkTrade what you see not what you think
Trade what you see not what you thinkNinja Tan
 
Understanding Japanese Candlesticks in Forex Trading by valentino heavens
Understanding Japanese Candlesticks in Forex Trading by valentino heavensUnderstanding Japanese Candlesticks in Forex Trading by valentino heavens
Understanding Japanese Candlesticks in Forex Trading by valentino heavensValentino Heavens
 
Cmt learning objective 1 c trends , trendlines & channels
Cmt learning objective  1 c   trends , trendlines & channelsCmt learning objective  1 c   trends , trendlines & channels
Cmt learning objective 1 c trends , trendlines & channelsProfessional Training Academy
 

What's hot (20)

17 Money Making Candlestick Formations
17 Money Making Candlestick Formations17 Money Making Candlestick Formations
17 Money Making Candlestick Formations
 
Technical Analysis Rudramurthy
Technical Analysis   RudramurthyTechnical Analysis   Rudramurthy
Technical Analysis Rudramurthy
 
Momentum indicators in tech. analysis
Momentum indicators in tech. analysisMomentum indicators in tech. analysis
Momentum indicators in tech. analysis
 
Price action trading1
Price action trading1Price action trading1
Price action trading1
 
Section 2 - Chapter 8 - Bar Chart Pattern (Price Pattern)
Section 2 - Chapter 8 - Bar Chart Pattern (Price Pattern)Section 2 - Chapter 8 - Bar Chart Pattern (Price Pattern)
Section 2 - Chapter 8 - Bar Chart Pattern (Price Pattern)
 
Using Triangles in Technical Analysis
Using Triangles  in Technical AnalysisUsing Triangles  in Technical Analysis
Using Triangles in Technical Analysis
 
Technical indicators
Technical indicatorsTechnical indicators
Technical indicators
 
Chart-Patterns.pptx
Chart-Patterns.pptxChart-Patterns.pptx
Chart-Patterns.pptx
 
Learn A Simple Range Trading Strategy
Learn A Simple Range Trading StrategyLearn A Simple Range Trading Strategy
Learn A Simple Range Trading Strategy
 
Introduction To Technical Analysis
Introduction To Technical AnalysisIntroduction To Technical Analysis
Introduction To Technical Analysis
 
Support and resistance trading
Support and resistance tradingSupport and resistance trading
Support and resistance trading
 
Candlestick cheat-sheet-rgb-final
Candlestick cheat-sheet-rgb-finalCandlestick cheat-sheet-rgb-final
Candlestick cheat-sheet-rgb-final
 
Technical analysis - By Sohan Khatri
Technical analysis - By Sohan KhatriTechnical analysis - By Sohan Khatri
Technical analysis - By Sohan Khatri
 
Overview of price action trading
Overview of price action tradingOverview of price action trading
Overview of price action trading
 
A Look Back at 11 Stock Trading Setups
A Look Back at 11 Stock Trading SetupsA Look Back at 11 Stock Trading Setups
A Look Back at 11 Stock Trading Setups
 
Trade what you see not what you think
Trade what you see not what you thinkTrade what you see not what you think
Trade what you see not what you think
 
Understanding Japanese Candlesticks in Forex Trading by valentino heavens
Understanding Japanese Candlesticks in Forex Trading by valentino heavensUnderstanding Japanese Candlesticks in Forex Trading by valentino heavens
Understanding Japanese Candlesticks in Forex Trading by valentino heavens
 
Moving average -Technical Analysis
Moving average -Technical AnalysisMoving average -Technical Analysis
Moving average -Technical Analysis
 
Cmt learning objective 1 c trends , trendlines & channels
Cmt learning objective  1 c   trends , trendlines & channelsCmt learning objective  1 c   trends , trendlines & channels
Cmt learning objective 1 c trends , trendlines & channels
 
Basic Technical Analysis
Basic Technical AnalysisBasic Technical Analysis
Basic Technical Analysis
 

Similar to Stock chart-Chart patterns and formations-Analysis of chart pattern

TECHNICAL ANALYSIS.pptx
TECHNICAL ANALYSIS.pptxTECHNICAL ANALYSIS.pptx
TECHNICAL ANALYSIS.pptxRahulMadhyani1
 
May 13 I Session 2 I GBIH
May 13 I Session 2 I GBIHMay 13 I Session 2 I GBIH
May 13 I Session 2 I GBIHGBIHSupport
 
SAPM lecture 6 Technical Analysis
SAPM lecture 6 Technical AnalysisSAPM lecture 6 Technical Analysis
SAPM lecture 6 Technical Analysisyogesh ingle
 
Wm 4 stock market technical analysis 2
Wm 4 stock market technical analysis 2Wm 4 stock market technical analysis 2
Wm 4 stock market technical analysis 2yogesh ingle
 
technical analysis stocks.pdf
technical analysis stocks.pdftechnical analysis stocks.pdf
technical analysis stocks.pdfPRADEEPKR41
 
MATERI - CHART PATTERNS (1) (4).pptx
MATERI - CHART PATTERNS (1) (4).pptxMATERI - CHART PATTERNS (1) (4).pptx
MATERI - CHART PATTERNS (1) (4).pptxMithaZonaAgustina
 
Technical-Analysis.pdf
Technical-Analysis.pdfTechnical-Analysis.pdf
Technical-Analysis.pdfSutarAtharv
 
Fundamental analysis
Fundamental analysis Fundamental analysis
Fundamental analysis Neeturai4
 
Technical Analysis - Asif Poiserwala
Technical Analysis - Asif PoiserwalaTechnical Analysis - Asif Poiserwala
Technical Analysis - Asif PoiserwalaAxis Direct
 
Lesson BTF110. Chart Patterns for Binary Trading
Lesson BTF110. Chart Patterns for Binary TradingLesson BTF110. Chart Patterns for Binary Trading
Lesson BTF110. Chart Patterns for Binary TradingOrlando G
 
Forex lesson 3 market trending
Forex lesson 3  market trendingForex lesson 3  market trending
Forex lesson 3 market trendingpipsumo traderfx
 
Section 2 - Chapter 9 Part II - Short Tem Pattern - Bar Chart Reversal Patterns
Section 2 - Chapter 9 Part II - Short Tem Pattern  - Bar Chart Reversal PatternsSection 2 - Chapter 9 Part II - Short Tem Pattern  - Bar Chart Reversal Patterns
Section 2 - Chapter 9 Part II - Short Tem Pattern - Bar Chart Reversal PatternsProfessional Training Academy
 
Technical anaylsis (day_8)
Technical anaylsis (day_8)Technical anaylsis (day_8)
Technical anaylsis (day_8)Vaibhav Banjan
 

Similar to Stock chart-Chart patterns and formations-Analysis of chart pattern (20)

Technical analysis
Technical analysisTechnical analysis
Technical analysis
 
TECHNICAL ANALYSIS.pptx
TECHNICAL ANALYSIS.pptxTECHNICAL ANALYSIS.pptx
TECHNICAL ANALYSIS.pptx
 
May 13 I Session 2 I GBIH
May 13 I Session 2 I GBIHMay 13 I Session 2 I GBIH
May 13 I Session 2 I GBIH
 
Technical Analysis
Technical Analysis  Technical Analysis
Technical Analysis
 
SAPM lecture 6 Technical Analysis
SAPM lecture 6 Technical AnalysisSAPM lecture 6 Technical Analysis
SAPM lecture 6 Technical Analysis
 
Wm 4 stock market technical analysis 2
Wm 4 stock market technical analysis 2Wm 4 stock market technical analysis 2
Wm 4 stock market technical analysis 2
 
technical analysis stocks.pdf
technical analysis stocks.pdftechnical analysis stocks.pdf
technical analysis stocks.pdf
 
MATERI - CHART PATTERNS (1) (4).pptx
MATERI - CHART PATTERNS (1) (4).pptxMATERI - CHART PATTERNS (1) (4).pptx
MATERI - CHART PATTERNS (1) (4).pptx
 
TECHNICAL ANALYSIS
TECHNICAL ANALYSISTECHNICAL ANALYSIS
TECHNICAL ANALYSIS
 
Technical-Analysis.pdf
Technical-Analysis.pdfTechnical-Analysis.pdf
Technical-Analysis.pdf
 
Webinar_-_2.pptx
Webinar_-_2.pptxWebinar_-_2.pptx
Webinar_-_2.pptx
 
Tech analysis part 1
Tech analysis part 1Tech analysis part 1
Tech analysis part 1
 
Fundamental analysis
Fundamental analysis Fundamental analysis
Fundamental analysis
 
Technical Analysis - Asif Poiserwala
Technical Analysis - Asif PoiserwalaTechnical Analysis - Asif Poiserwala
Technical Analysis - Asif Poiserwala
 
Lesson BTF110. Chart Patterns for Binary Trading
Lesson BTF110. Chart Patterns for Binary TradingLesson BTF110. Chart Patterns for Binary Trading
Lesson BTF110. Chart Patterns for Binary Trading
 
Forex lesson 3 market trending
Forex lesson 3  market trendingForex lesson 3  market trending
Forex lesson 3 market trending
 
Section 2 - Chapter 9 Part II - Short Tem Pattern - Bar Chart Reversal Patterns
Section 2 - Chapter 9 Part II - Short Tem Pattern  - Bar Chart Reversal PatternsSection 2 - Chapter 9 Part II - Short Tem Pattern  - Bar Chart Reversal Patterns
Section 2 - Chapter 9 Part II - Short Tem Pattern - Bar Chart Reversal Patterns
 
Section 2 - Chapter 11,12 - Volume Analysis
Section 2 - Chapter 11,12 - Volume AnalysisSection 2 - Chapter 11,12 - Volume Analysis
Section 2 - Chapter 11,12 - Volume Analysis
 
BIG BOOK OF CHART PATTERNS.pdf
BIG BOOK OF CHART PATTERNS.pdfBIG BOOK OF CHART PATTERNS.pdf
BIG BOOK OF CHART PATTERNS.pdf
 
Technical anaylsis (day_8)
Technical anaylsis (day_8)Technical anaylsis (day_8)
Technical anaylsis (day_8)
 

Recently uploaded

Vp Girls near me Delhi Call Now or WhatsApp
Vp Girls near me Delhi Call Now or WhatsAppVp Girls near me Delhi Call Now or WhatsApp
Vp Girls near me Delhi Call Now or WhatsAppmiss dipika
 
212MTAMount Durham University Bachelor's Diploma in Technology
212MTAMount Durham University Bachelor's Diploma in Technology212MTAMount Durham University Bachelor's Diploma in Technology
212MTAMount Durham University Bachelor's Diploma in Technologyz xss
 
Call Girls Near Delhi Pride Hotel, New Delhi|9873777170
Call Girls Near Delhi Pride Hotel, New Delhi|9873777170Call Girls Near Delhi Pride Hotel, New Delhi|9873777170
Call Girls Near Delhi Pride Hotel, New Delhi|9873777170Sonam Pathan
 
fca-bsps-decision-letter-redacted (1).pdf
fca-bsps-decision-letter-redacted (1).pdffca-bsps-decision-letter-redacted (1).pdf
fca-bsps-decision-letter-redacted (1).pdfHenry Tapper
 
Lundin Gold April 2024 Corporate Presentation v4.pdf
Lundin Gold April 2024 Corporate Presentation v4.pdfLundin Gold April 2024 Corporate Presentation v4.pdf
Lundin Gold April 2024 Corporate Presentation v4.pdfAdnet Communications
 
Call Girls Near Me WhatsApp:+91-9833363713
Call Girls Near Me WhatsApp:+91-9833363713Call Girls Near Me WhatsApp:+91-9833363713
Call Girls Near Me WhatsApp:+91-9833363713Sonam Pathan
 
chapter_2.ppt The labour market definitions and trends
chapter_2.ppt The labour market definitions and trendschapter_2.ppt The labour market definitions and trends
chapter_2.ppt The labour market definitions and trendslemlemtesfaye192
 
(办理原版一样)QUT毕业证昆士兰科技大学毕业证学位证留信学历认证成绩单补办
(办理原版一样)QUT毕业证昆士兰科技大学毕业证学位证留信学历认证成绩单补办(办理原版一样)QUT毕业证昆士兰科技大学毕业证学位证留信学历认证成绩单补办
(办理原版一样)QUT毕业证昆士兰科技大学毕业证学位证留信学历认证成绩单补办fqiuho152
 
Stock Market Brief Deck for 4/24/24 .pdf
Stock Market Brief Deck for 4/24/24 .pdfStock Market Brief Deck for 4/24/24 .pdf
Stock Market Brief Deck for 4/24/24 .pdfMichael Silva
 
Bladex Earnings Call Presentation 1Q2024
Bladex Earnings Call Presentation 1Q2024Bladex Earnings Call Presentation 1Q2024
Bladex Earnings Call Presentation 1Q2024Bladex
 
NO1 WorldWide online istikhara for love marriage vashikaran specialist love p...
NO1 WorldWide online istikhara for love marriage vashikaran specialist love p...NO1 WorldWide online istikhara for love marriage vashikaran specialist love p...
NO1 WorldWide online istikhara for love marriage vashikaran specialist love p...Amil Baba Dawood bangali
 
call girls in Nand Nagri (DELHI) 🔝 >༒9953330565🔝 genuine Escort Service 🔝✔️✔️
call girls in  Nand Nagri (DELHI) 🔝 >༒9953330565🔝 genuine Escort Service 🔝✔️✔️call girls in  Nand Nagri (DELHI) 🔝 >༒9953330565🔝 genuine Escort Service 🔝✔️✔️
call girls in Nand Nagri (DELHI) 🔝 >༒9953330565🔝 genuine Escort Service 🔝✔️✔️9953056974 Low Rate Call Girls In Saket, Delhi NCR
 
SBP-Market-Operations and market managment
SBP-Market-Operations and market managmentSBP-Market-Operations and market managment
SBP-Market-Operations and market managmentfactical
 
Monthly Market Risk Update: April 2024 [SlideShare]
Monthly Market Risk Update: April 2024 [SlideShare]Monthly Market Risk Update: April 2024 [SlideShare]
Monthly Market Risk Update: April 2024 [SlideShare]Commonwealth
 
Classical Theory of Macroeconomics by Adam Smith
Classical Theory of Macroeconomics by Adam SmithClassical Theory of Macroeconomics by Adam Smith
Classical Theory of Macroeconomics by Adam SmithAdamYassin2
 
Tenets of Physiocracy History of Economic
Tenets of Physiocracy History of EconomicTenets of Physiocracy History of Economic
Tenets of Physiocracy History of Economiccinemoviesu
 
Bladex 1Q24 Earning Results Presentation
Bladex 1Q24 Earning Results PresentationBladex 1Q24 Earning Results Presentation
Bladex 1Q24 Earning Results PresentationBladex
 
Economics, Commerce and Trade Management: An International Journal (ECTIJ)
Economics, Commerce and Trade Management: An International Journal (ECTIJ)Economics, Commerce and Trade Management: An International Journal (ECTIJ)
Economics, Commerce and Trade Management: An International Journal (ECTIJ)ECTIJ
 
NO1 WorldWide Love marriage specialist baba ji Amil Baba Kala ilam powerful v...
NO1 WorldWide Love marriage specialist baba ji Amil Baba Kala ilam powerful v...NO1 WorldWide Love marriage specialist baba ji Amil Baba Kala ilam powerful v...
NO1 WorldWide Love marriage specialist baba ji Amil Baba Kala ilam powerful v...Amil baba
 

Recently uploaded (20)

Vp Girls near me Delhi Call Now or WhatsApp
Vp Girls near me Delhi Call Now or WhatsAppVp Girls near me Delhi Call Now or WhatsApp
Vp Girls near me Delhi Call Now or WhatsApp
 
212MTAMount Durham University Bachelor's Diploma in Technology
212MTAMount Durham University Bachelor's Diploma in Technology212MTAMount Durham University Bachelor's Diploma in Technology
212MTAMount Durham University Bachelor's Diploma in Technology
 
Call Girls Near Delhi Pride Hotel, New Delhi|9873777170
Call Girls Near Delhi Pride Hotel, New Delhi|9873777170Call Girls Near Delhi Pride Hotel, New Delhi|9873777170
Call Girls Near Delhi Pride Hotel, New Delhi|9873777170
 
fca-bsps-decision-letter-redacted (1).pdf
fca-bsps-decision-letter-redacted (1).pdffca-bsps-decision-letter-redacted (1).pdf
fca-bsps-decision-letter-redacted (1).pdf
 
Monthly Economic Monitoring of Ukraine No 231, April 2024
Monthly Economic Monitoring of Ukraine No 231, April 2024Monthly Economic Monitoring of Ukraine No 231, April 2024
Monthly Economic Monitoring of Ukraine No 231, April 2024
 
Lundin Gold April 2024 Corporate Presentation v4.pdf
Lundin Gold April 2024 Corporate Presentation v4.pdfLundin Gold April 2024 Corporate Presentation v4.pdf
Lundin Gold April 2024 Corporate Presentation v4.pdf
 
Call Girls Near Me WhatsApp:+91-9833363713
Call Girls Near Me WhatsApp:+91-9833363713Call Girls Near Me WhatsApp:+91-9833363713
Call Girls Near Me WhatsApp:+91-9833363713
 
chapter_2.ppt The labour market definitions and trends
chapter_2.ppt The labour market definitions and trendschapter_2.ppt The labour market definitions and trends
chapter_2.ppt The labour market definitions and trends
 
(办理原版一样)QUT毕业证昆士兰科技大学毕业证学位证留信学历认证成绩单补办
(办理原版一样)QUT毕业证昆士兰科技大学毕业证学位证留信学历认证成绩单补办(办理原版一样)QUT毕业证昆士兰科技大学毕业证学位证留信学历认证成绩单补办
(办理原版一样)QUT毕业证昆士兰科技大学毕业证学位证留信学历认证成绩单补办
 
Stock Market Brief Deck for 4/24/24 .pdf
Stock Market Brief Deck for 4/24/24 .pdfStock Market Brief Deck for 4/24/24 .pdf
Stock Market Brief Deck for 4/24/24 .pdf
 
Bladex Earnings Call Presentation 1Q2024
Bladex Earnings Call Presentation 1Q2024Bladex Earnings Call Presentation 1Q2024
Bladex Earnings Call Presentation 1Q2024
 
NO1 WorldWide online istikhara for love marriage vashikaran specialist love p...
NO1 WorldWide online istikhara for love marriage vashikaran specialist love p...NO1 WorldWide online istikhara for love marriage vashikaran specialist love p...
NO1 WorldWide online istikhara for love marriage vashikaran specialist love p...
 
call girls in Nand Nagri (DELHI) 🔝 >༒9953330565🔝 genuine Escort Service 🔝✔️✔️
call girls in  Nand Nagri (DELHI) 🔝 >༒9953330565🔝 genuine Escort Service 🔝✔️✔️call girls in  Nand Nagri (DELHI) 🔝 >༒9953330565🔝 genuine Escort Service 🔝✔️✔️
call girls in Nand Nagri (DELHI) 🔝 >༒9953330565🔝 genuine Escort Service 🔝✔️✔️
 
SBP-Market-Operations and market managment
SBP-Market-Operations and market managmentSBP-Market-Operations and market managment
SBP-Market-Operations and market managment
 
Monthly Market Risk Update: April 2024 [SlideShare]
Monthly Market Risk Update: April 2024 [SlideShare]Monthly Market Risk Update: April 2024 [SlideShare]
Monthly Market Risk Update: April 2024 [SlideShare]
 
Classical Theory of Macroeconomics by Adam Smith
Classical Theory of Macroeconomics by Adam SmithClassical Theory of Macroeconomics by Adam Smith
Classical Theory of Macroeconomics by Adam Smith
 
Tenets of Physiocracy History of Economic
Tenets of Physiocracy History of EconomicTenets of Physiocracy History of Economic
Tenets of Physiocracy History of Economic
 
Bladex 1Q24 Earning Results Presentation
Bladex 1Q24 Earning Results PresentationBladex 1Q24 Earning Results Presentation
Bladex 1Q24 Earning Results Presentation
 
Economics, Commerce and Trade Management: An International Journal (ECTIJ)
Economics, Commerce and Trade Management: An International Journal (ECTIJ)Economics, Commerce and Trade Management: An International Journal (ECTIJ)
Economics, Commerce and Trade Management: An International Journal (ECTIJ)
 
NO1 WorldWide Love marriage specialist baba ji Amil Baba Kala ilam powerful v...
NO1 WorldWide Love marriage specialist baba ji Amil Baba Kala ilam powerful v...NO1 WorldWide Love marriage specialist baba ji Amil Baba Kala ilam powerful v...
NO1 WorldWide Love marriage specialist baba ji Amil Baba Kala ilam powerful v...
 

Stock chart-Chart patterns and formations-Analysis of chart pattern

  • 1. STOCK CHART - CHART PATTERNS AND FORMATIONS - ANALYSIS OF CHART PATTERN AKBAR ALI.K Dept. of Commerce Pondicherry University
  • 2. STOCK CHART • A stock chart is a simple two-axis (x-y) plotted graph of price and time. • Each individual equity, market and index listed on a public exchange has a chart that illustrates this movement of price over time. • The study of stock charts, known as technical analysis, believes that the past action of the market itself will determine the future course of prices.
  • 5. LINE CHARTS • Simplest type of chart. • Single line represents the security’s closing price on each time interval. • Dates are displayed along the bottom of chart and prices are displayed on the side.
  • 6.
  • 7. BAR CHARTS • Bar charts are commonly used to convey price activity into a easily readable chart. • It display the open ,close, daily high and daily low price. • The total vertical length/height of the bar represents the entire trading range for the period. • Top of the bar represents the highest price of the period and vice- versa.
  • 8.
  • 9. CANDLE STICK CHART • Candle stick chart are much more visually appealing, and convey the price information in a quicker, easier manner. • It display the open ,close, daily high and daily low. • The hollow or filled portion of the candlestick is called “the body” (also referred to as “the real body”). • The long thin lines above and below the body represent the high/low range and are called “shadows” (also referred to as “wicks” and “tails”). • The high is marked by the top of the upper shadow and the low by the bottom of the lower shadow.
  • 10. Bullish Candle • Open at bottom of body. • Close at top of body. • High – Top of wick. • Low – Bottom of wick.
  • 11. Bearish Candle • Open at top of body. • Close at bottom of body. • High – Top of wick. • Low – Bottom of wick.
  • 12.
  • 13.
  • 14.
  • 15. CHART PATTERNS • Chart patterns are a result of market psychology. • It is a result of a mix of various emotions like fear and greed. • It can be used to make short-term or long-term forecasts. • The data can be intraday ,daily, weekly or monthly and the patterns can be as short as one day or as long as many years.
  • 16. Support  A support zone is an area where buying interest exits.  As the price reaches the support zone, participants are more inclined towards buying.  As the times passes by, demand will overcome supply and prevent the price from falling below support.  It is not true that, support levels will always hold.  Breaking a support level further increases bearishness in the market.
  • 18. Resistance • A resistance zone is an area where selling interest exits. • As the price reaches the resistance zone, participants are more inclined towards selling. • As the times passes by, supply will overcome demand and prevent the price from rising above resistance. • Breaking a resistance level further increases bullishness in the market.
  • 20. Support Becoming Resistance And Vice-versa When a support zone is broken, it can become a resistance zone for the future price movement and vice versa. One such example is shown below
  • 21. Types of chart patterns • Double Top and Double Bottom • Head and shoulder & Inverse Head and shoulder • Symmetric Triangle • Rectangle • Rising & Falling Channel • Rising & Falling wedges
  • 22. Double Top  A double top is a reversal pattern which occurs following an extended uptrend.  A pair of peaks is formed in which the 2nd peak is at a lower height compared to the 1st one.  This signifies the weakness in prices to reach a new high and sustain the existing trend.
  • 24. Double Bottom • A double bottom is a reversal pattern which occurs following an extended downtrend. • A pair of troughs is formed in which the 2nd trough is at a higher high compared to the 1st one. • This signifies the weakness in prices to reach a new low and sustain the existing trend.
  • 26. Head and Shoulders • Head and Shoulders pattern occur at the end of an uptrend and is a signal of trend reversal. It consists of a left shoulder, head and a right shoulder. • Volume is the other thing that needs to be observed along with the pattern formation. In an uptrend, formation of a left shoulder is accompanied by high volumes. When the price reaches the peak point of left shoulder it retraces a bit with low volumes. • Price makes new high above the left shoulder forming the head with volumes lower than what it took to form the left shoulder. Price retraces again to the point where the head formation has started. • Formation of right shoulder is accompanied by low volumes. When price starts falling from the peak of right shoulder, rise in volumes is clearly visible. This confirms the start of bearish trend. • The neck line that connects the base of left and right shoulders and the head act as a support for the price. Once the neck line is breached, one can initiate new short positions.
  • 28. Inverse Head and Shoulder • Head and Shoulders pattern occur at the end of a downtrend and is a signal of trend reversal. • The neck line that connects the base of left and right shoulders and the head act as a resistance for the price. • Once the neck line is breached, one can initiate new long positions.
  • 29. Inverse Head and Shoulder Pattern
  • 30. Symmetric Triangle • It can be seen anywhere in the chart. • Price tend to follow in whichever direction the breakout has happened. • Lines are connected using Highs and Lows of candles. • Both the lines converge together.
  • 32.
  • 33. Rectangle • A rectangle is formed by connecting the tops and bottoms of candles. • Both the lines move parallelly in horizontal direction. • Price tends to move in whichever direction there is a breakout.
  • 35.
  • 36. Rising channel • A Rising channel is formed by connecting the tops and bottoms of candles. • Both the lines slope parallel in upward direction. • At any time the distance between the lines is same. • Breakout happens on the lower line and price tends to be bearish after that.
  • 38.
  • 39. Falling Channel • A falling channel is formed by connecting the tops and bottoms of candles. • Both the lines slop parallelly in downward direction. • At any time the distance between the lines is same. • Breakout happens on the upper line and price tends to be bullish after that.
  • 41.
  • 42. Rising Wedge • This pattern is seen at the end of an uptrend. • Two lines are drawn connecting the highs and lows of candles. • Both lines slope in upward direction but never come into contact. • Breakdown of lower line starts a new bearish trend.
  • 44. Falling Wedge • This pattern is seen at the end of a downtrend. • Two lines are drawn connecting the highs and lows of candles. • Both line slope in downward direction but never come into contact. • Breakdown of upper line starts a new bullish trend.
  • 46.