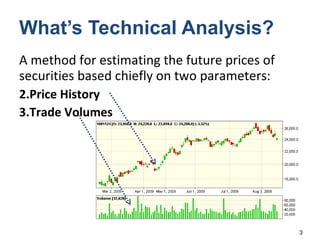
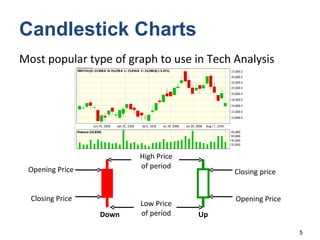
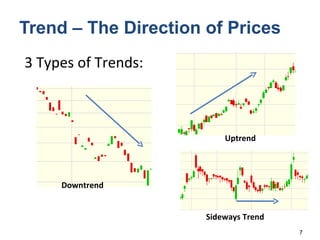
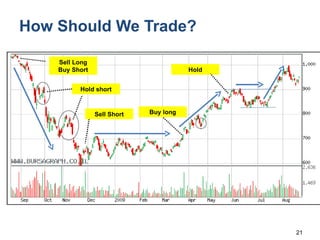
Introduction to Technical Analysis
Contents What’s Technical Analysis? Graphs Trends The Golden Rule Trends Lines, Support and Resistance Levels Retracements Summary
What’s Technical Analysis? A method for estimating the future prices of securities based chiefly on two parameters:  Price History Trade Volumes
Quarterly Reports, Macro/Micro  Indicators, Interest Rates, Stock  Market Indices, Predictions,  Statements, News, Rumors…  Because *:  Security prices are ultimately set by market forces – buyers and sellers.   History repeats itself, so… Historic price and volume data is sufficient to assess and predict buyer and seller behavior *  Per Technical Analysis theory Technical Analysis  Does Not  Look At…
Candlestick Charts Most popular type of graph to use in Tech Analysis Up Down Opening Price Closing price Low Price of period High Price of period Opening Price Closing Price
Graph Time Resolutions Daily –  1 candle = 1day Useful for analyzing short-term trends Weekly –  1 candle = 1 week Useful for analyzing intermediate trends Monthly  – 1 candle = 1month Useful for long-term analysis
Trend – The Direction of Prices 3 Types of Trends: Downtrend Uptrend Sideways Trend
Golden Rule of T. Analysis Trading ( The Trend is your Friend) In an uptrend –  Buy (Long) In a downtrend –  Sell/Don’t Buy/Short In a sideways-trend –  Sell/Don’t Buy So, how do you recognize a trend? Trade With The Trend
Trend Characteristics - Price Formal Uptrend Every peak is  higher  than the previous peak Every  trough is  higher  than the previous  trough  Formal Downtrend Every peak is  lower  than the previous peak Every trough is  lower  than the previous  trough 
Trend Characteristics - Volume Trade volume  = amount of securities traded In distinct  trends volumes typically: Are larger than in periods of sideways trends Grow with the trend  sideways uptrend uptrend growing sideways Small volumes Medium volumes growing
Trend Characteristics – Time Period Trends are limited to a time period : Long Term Trend –  1 year or more AKA  Main Trend Use monthly chart to detect Intermediate Trend –  2-12 months Most investors use it Use weekly or daily chart to analyze Short term Trend –  1 month or less Use daily chart Important:   Long-term trends will almost always include intermediate and short term trends in the opposite direction
Trendline Trendline  = A line drawn over highs or under lows to show the prevailing direction of price   Needs to touch at  least 3 peaks or troughs Helps determine future prices, change rates,  buy/sell opportunities and more Intermediate term trendline Short term trendline
Support and Resistance Levels Horizontal trendlines may indicate Support and Resistance levels Support level  – The price level which the security has had difficulty falling below. It is thought of as the level at which a lot of buyers tend to enter the stock. Resistance level -  The price level which the security has had difficulty rising over. It is thought of as the level at which a lot of sellers tend to offload. Note : Round numbers (100, 800, etc.) tend to create support/resistance levels Support Level Resistance Level Breakout
Support and Resistance - 2 Trendlines may indicate the change in support and resistance levels during a trend Resistance line Support line Breakout Example: an uptrending security with parallel support and resistance lines ( price channel ) Note: support and resistance trendlines are not always parallel
Support and Resistance Role Reversal When a support level is broken it may turn into a resistance level  And vice-versa  Breakout of support level turns it into a resistance level
Retracements Retracement  = A temporary reversal in the direction of the price of a security, countering the prevailing trend.  Retracements usually occur due to profit-taking  Retracements break the distinctiveness of trends In uptrends – create a trough that is lower than the previous trough  In downtrends – create a peak that is higher than the previous trough
The Risk of Retracements Retracements may fool us into thinking the trend has stopped or reversed Trading based on retracements will cause us to lose or profit less Example: in this downtrend there are two retracements.  Buying the security at these times will result in loss.
Retracement Indicators- Price In theory the change would often correlate with Fibonacci’s  ratios:  23.6%, 38.2%, 50%, 61.8% Fibonacci retracements is a popular tool to predict retracement end prices Draw a line between the high and low of the last trend and the tool will show relative Fibonacci levels 38.2% 1. Price should retrace by no more than 66% of the size of the previous move Uptrend Retracement size 0 % Move size 50% 61.8% Retracement
Retracement Indicators - Other Duration - retracements are  short-lived No more than 2-3 weeks in intermediate term Usually arrive  after strong price moves Inducing profit taking Volumes decline  as the retracement progresses Contradicting/Weak strength indicators  We’ll discuss those in the next slide  deck Invariably  followed by a higher/lower peak/trough
Summary -  Med-Short Trends Example * Note how support and resistance level build at round numbers: 700, 800, 900… Strong down-trend Sideway Trend  b/w 630-700  Uptrend Sideways Trend Retracement Starts at 700 and stops at 800 Retracement Uptrend stopped at 900 800 level induces a retracement 700 level breakout Small volumes Volume growth High Volumes 900 level  broken Uptrend stopped at 1000 Up
How Should We Trade?  Hold Buy long Sell Long Buy Short Hold short Sell Short
Photo Credits Stopwatch /  casey.marshall  -  http://www.flickr.com/photos/rsdio/3642425935/

Technical Analysis

  • 1.
  • 2.
    Contents What’s TechnicalAnalysis? Graphs Trends The Golden Rule Trends Lines, Support and Resistance Levels Retracements Summary
  • 3.
    What’s Technical Analysis?A method for estimating the future prices of securities based chiefly on two parameters: Price History Trade Volumes
  • 4.
    Quarterly Reports, Macro/Micro Indicators, Interest Rates, Stock Market Indices, Predictions, Statements, News, Rumors… Because *: Security prices are ultimately set by market forces – buyers and sellers. History repeats itself, so… Historic price and volume data is sufficient to assess and predict buyer and seller behavior * Per Technical Analysis theory Technical Analysis Does Not Look At…
  • 5.
    Candlestick Charts Mostpopular type of graph to use in Tech Analysis Up Down Opening Price Closing price Low Price of period High Price of period Opening Price Closing Price
  • 6.
    Graph Time ResolutionsDaily – 1 candle = 1day Useful for analyzing short-term trends Weekly – 1 candle = 1 week Useful for analyzing intermediate trends Monthly – 1 candle = 1month Useful for long-term analysis
  • 7.
    Trend – TheDirection of Prices 3 Types of Trends: Downtrend Uptrend Sideways Trend
  • 8.
    Golden Rule ofT. Analysis Trading ( The Trend is your Friend) In an uptrend – Buy (Long) In a downtrend – Sell/Don’t Buy/Short In a sideways-trend – Sell/Don’t Buy So, how do you recognize a trend? Trade With The Trend
  • 9.
    Trend Characteristics -Price Formal Uptrend Every peak is higher than the previous peak Every trough is higher than the previous trough  Formal Downtrend Every peak is lower than the previous peak Every trough is lower than the previous trough 
  • 10.
    Trend Characteristics -Volume Trade volume = amount of securities traded In distinct trends volumes typically: Are larger than in periods of sideways trends Grow with the trend sideways uptrend uptrend growing sideways Small volumes Medium volumes growing
  • 11.
    Trend Characteristics –Time Period Trends are limited to a time period : Long Term Trend – 1 year or more AKA Main Trend Use monthly chart to detect Intermediate Trend – 2-12 months Most investors use it Use weekly or daily chart to analyze Short term Trend – 1 month or less Use daily chart Important: Long-term trends will almost always include intermediate and short term trends in the opposite direction
  • 12.
    Trendline Trendline = A line drawn over highs or under lows to show the prevailing direction of price Needs to touch at least 3 peaks or troughs Helps determine future prices, change rates, buy/sell opportunities and more Intermediate term trendline Short term trendline
  • 13.
    Support and ResistanceLevels Horizontal trendlines may indicate Support and Resistance levels Support level – The price level which the security has had difficulty falling below. It is thought of as the level at which a lot of buyers tend to enter the stock. Resistance level - The price level which the security has had difficulty rising over. It is thought of as the level at which a lot of sellers tend to offload. Note : Round numbers (100, 800, etc.) tend to create support/resistance levels Support Level Resistance Level Breakout
  • 14.
    Support and Resistance- 2 Trendlines may indicate the change in support and resistance levels during a trend Resistance line Support line Breakout Example: an uptrending security with parallel support and resistance lines ( price channel ) Note: support and resistance trendlines are not always parallel
  • 15.
    Support and ResistanceRole Reversal When a support level is broken it may turn into a resistance level And vice-versa Breakout of support level turns it into a resistance level
  • 16.
    Retracements Retracement = A temporary reversal in the direction of the price of a security, countering the prevailing trend. Retracements usually occur due to profit-taking Retracements break the distinctiveness of trends In uptrends – create a trough that is lower than the previous trough In downtrends – create a peak that is higher than the previous trough
  • 17.
    The Risk ofRetracements Retracements may fool us into thinking the trend has stopped or reversed Trading based on retracements will cause us to lose or profit less Example: in this downtrend there are two retracements. Buying the security at these times will result in loss.
  • 18.
    Retracement Indicators- PriceIn theory the change would often correlate with Fibonacci’s ratios: 23.6%, 38.2%, 50%, 61.8% Fibonacci retracements is a popular tool to predict retracement end prices Draw a line between the high and low of the last trend and the tool will show relative Fibonacci levels 38.2% 1. Price should retrace by no more than 66% of the size of the previous move Uptrend Retracement size 0 % Move size 50% 61.8% Retracement
  • 19.
    Retracement Indicators -Other Duration - retracements are short-lived No more than 2-3 weeks in intermediate term Usually arrive after strong price moves Inducing profit taking Volumes decline as the retracement progresses Contradicting/Weak strength indicators We’ll discuss those in the next slide deck Invariably followed by a higher/lower peak/trough
  • 20.
    Summary - Med-Short Trends Example * Note how support and resistance level build at round numbers: 700, 800, 900… Strong down-trend Sideway Trend b/w 630-700 Uptrend Sideways Trend Retracement Starts at 700 and stops at 800 Retracement Uptrend stopped at 900 800 level induces a retracement 700 level breakout Small volumes Volume growth High Volumes 900 level broken Uptrend stopped at 1000 Up
  • 21.
    How Should WeTrade? Hold Buy long Sell Long Buy Short Hold short Sell Short
  • 22.
    Photo Credits Stopwatch/ casey.marshall - http://www.flickr.com/photos/rsdio/3642425935/