Download as PDF, PPTX
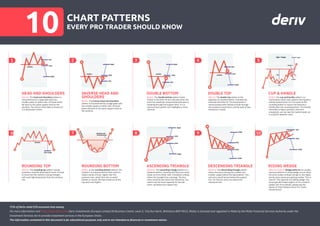
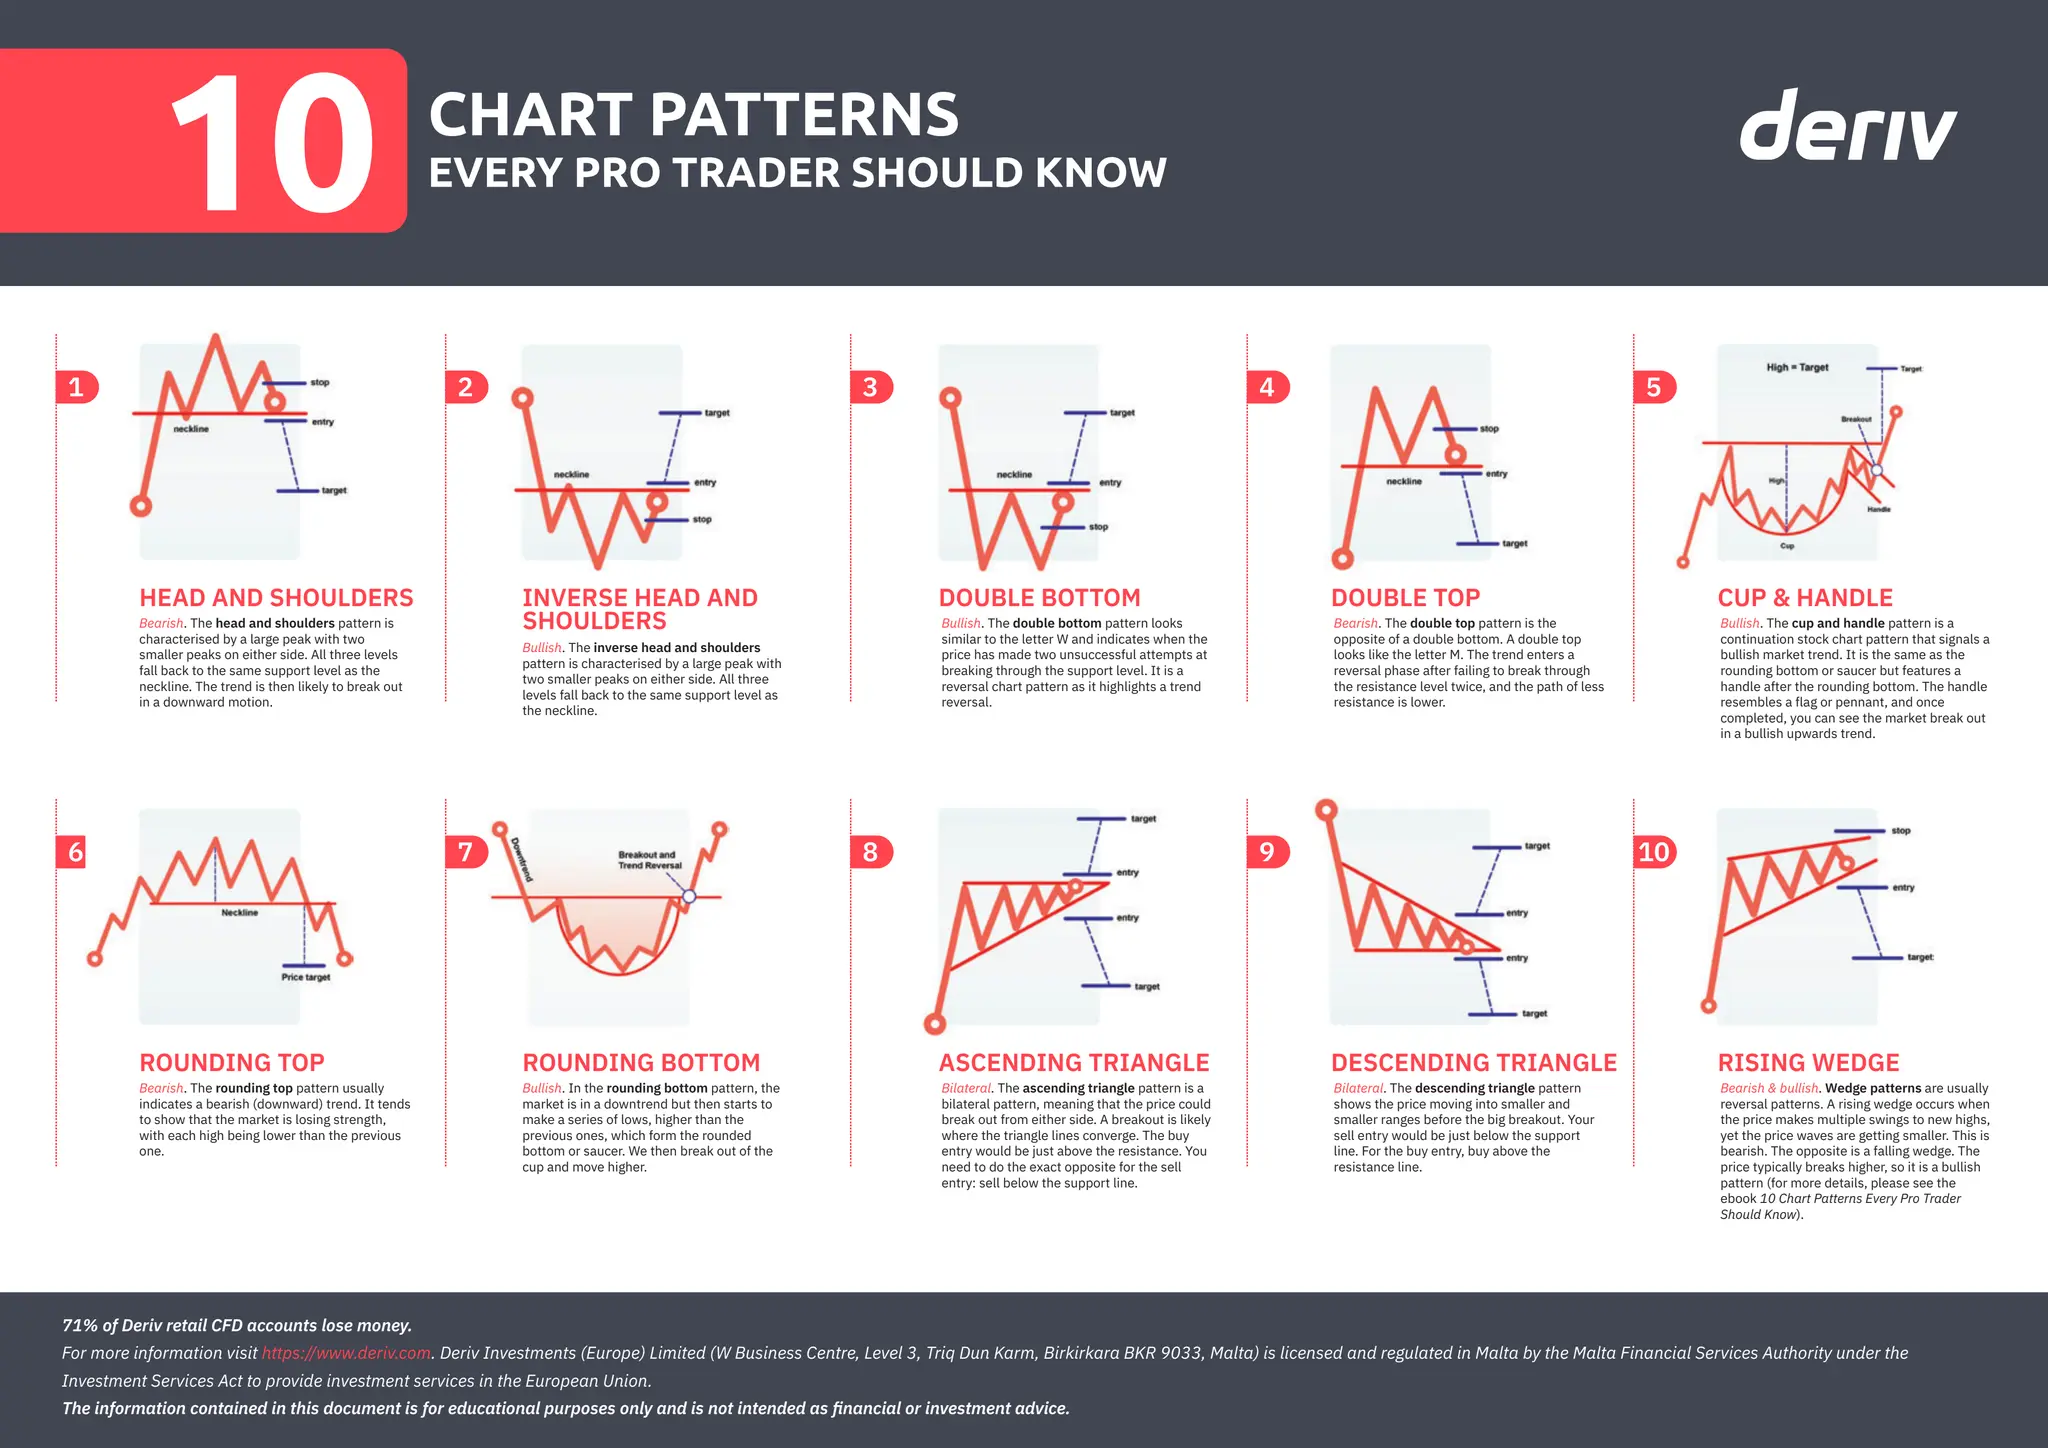

The document describes ten important chart patterns for traders, including head and shoulders, inverse head and shoulders, and double tops and bottoms, with implications for bullish or bearish market trends. It also outlines various bilateral patterns such as ascending and descending triangles, as well as wedge patterns that indicate potential reversals. The content serves as educational material rather than financial advice.