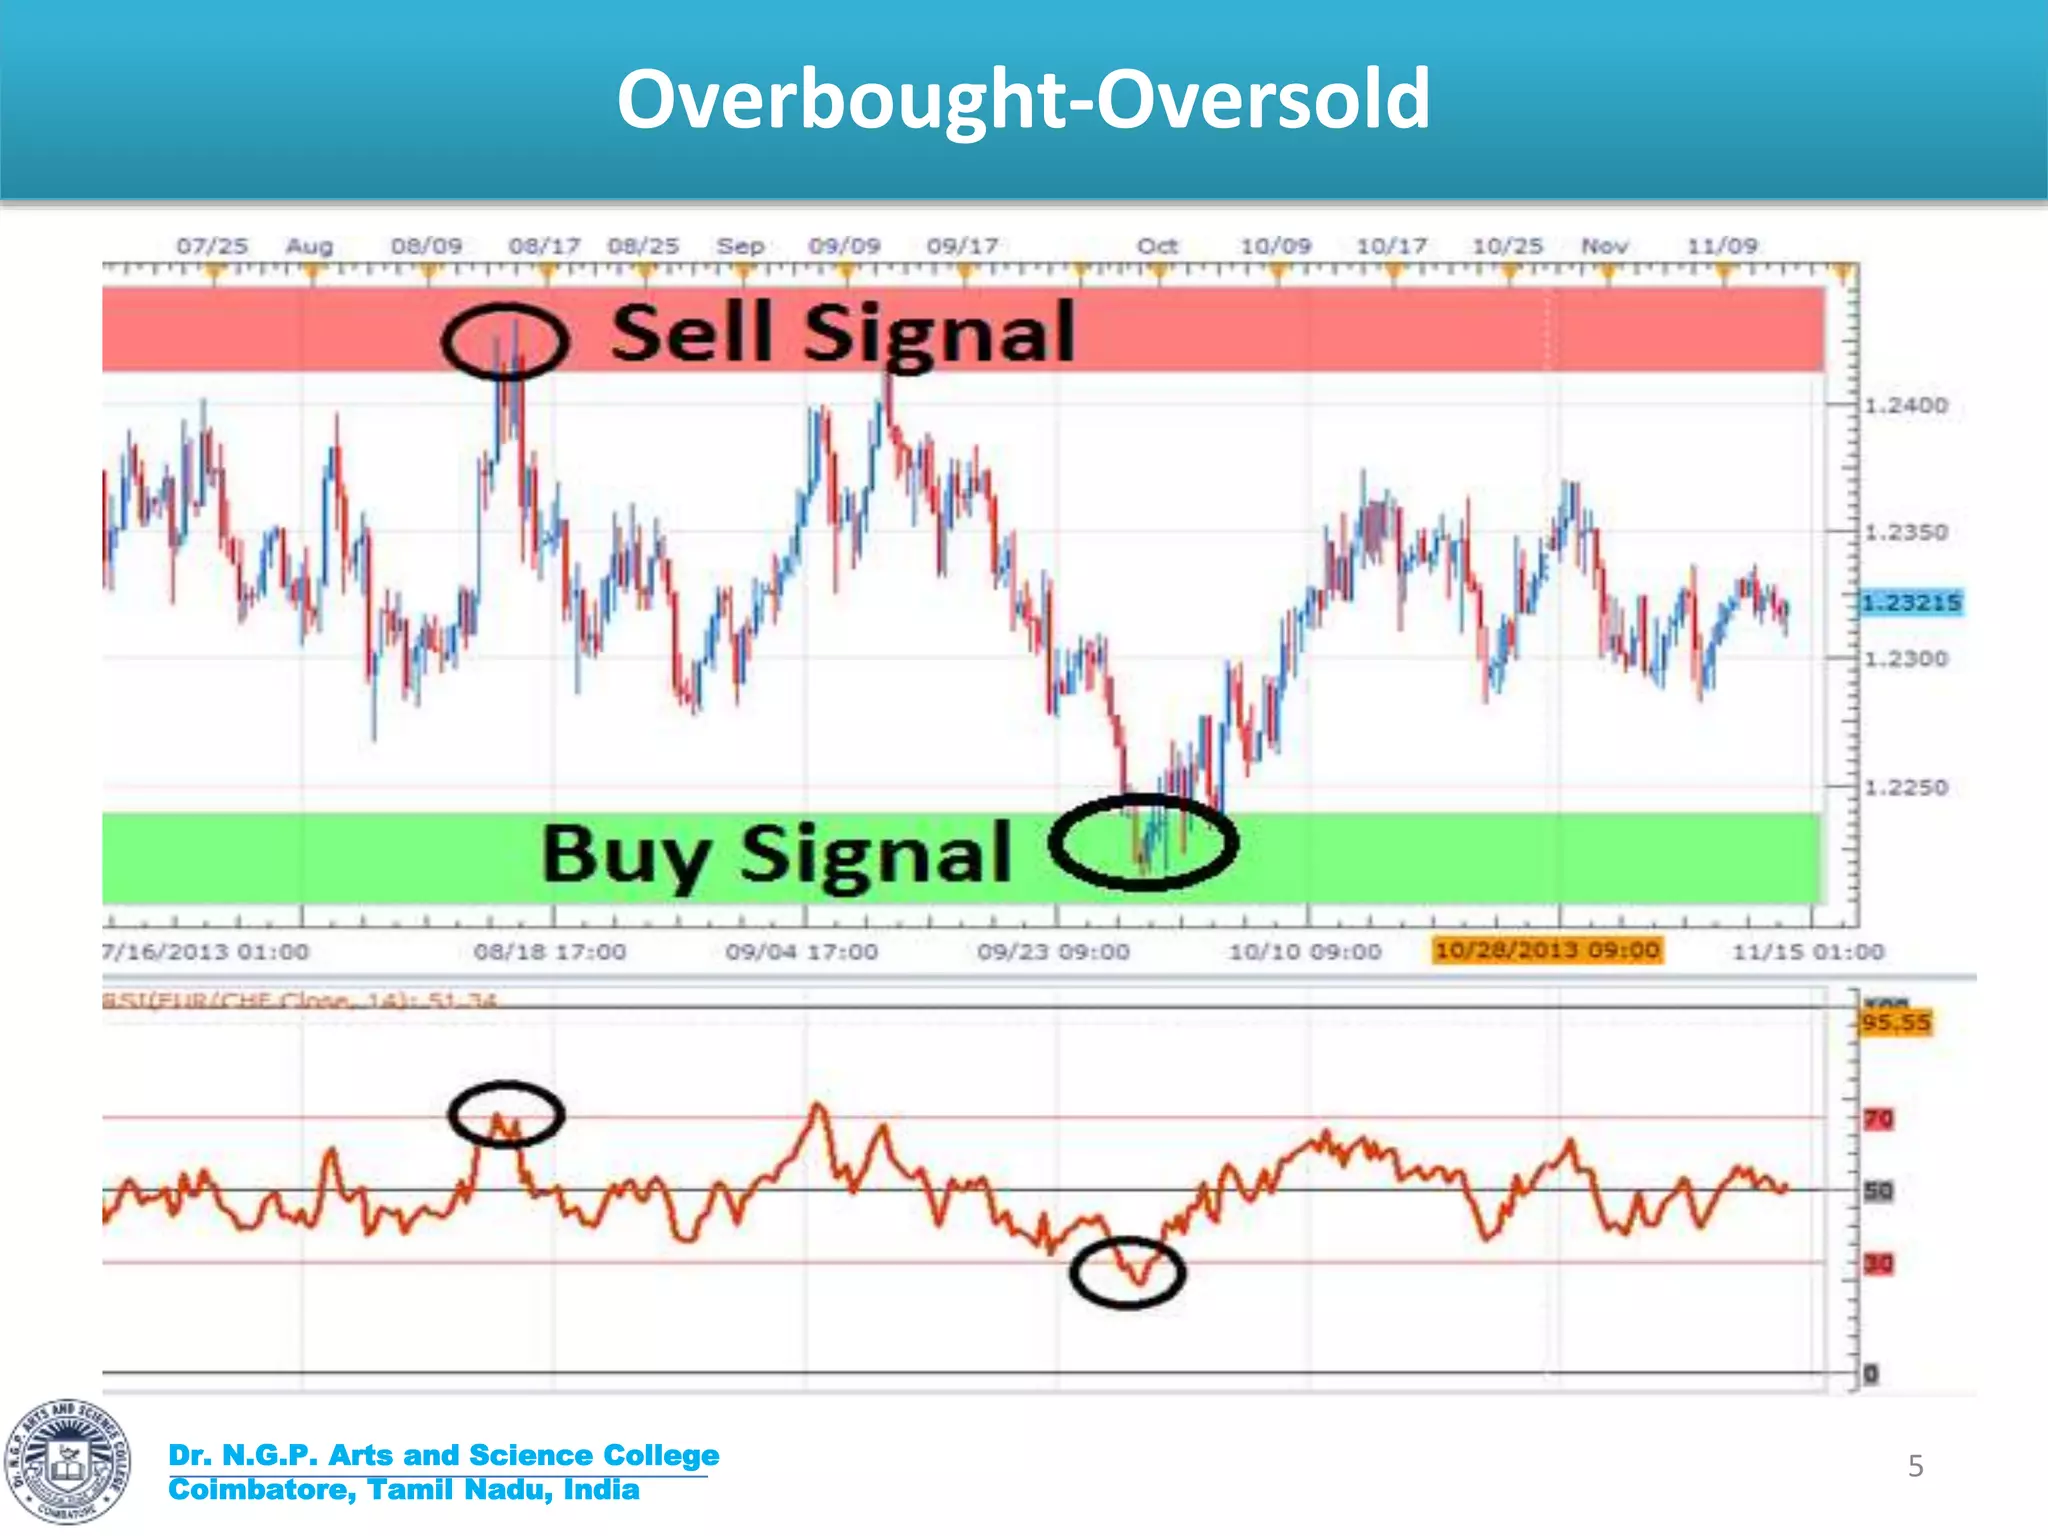
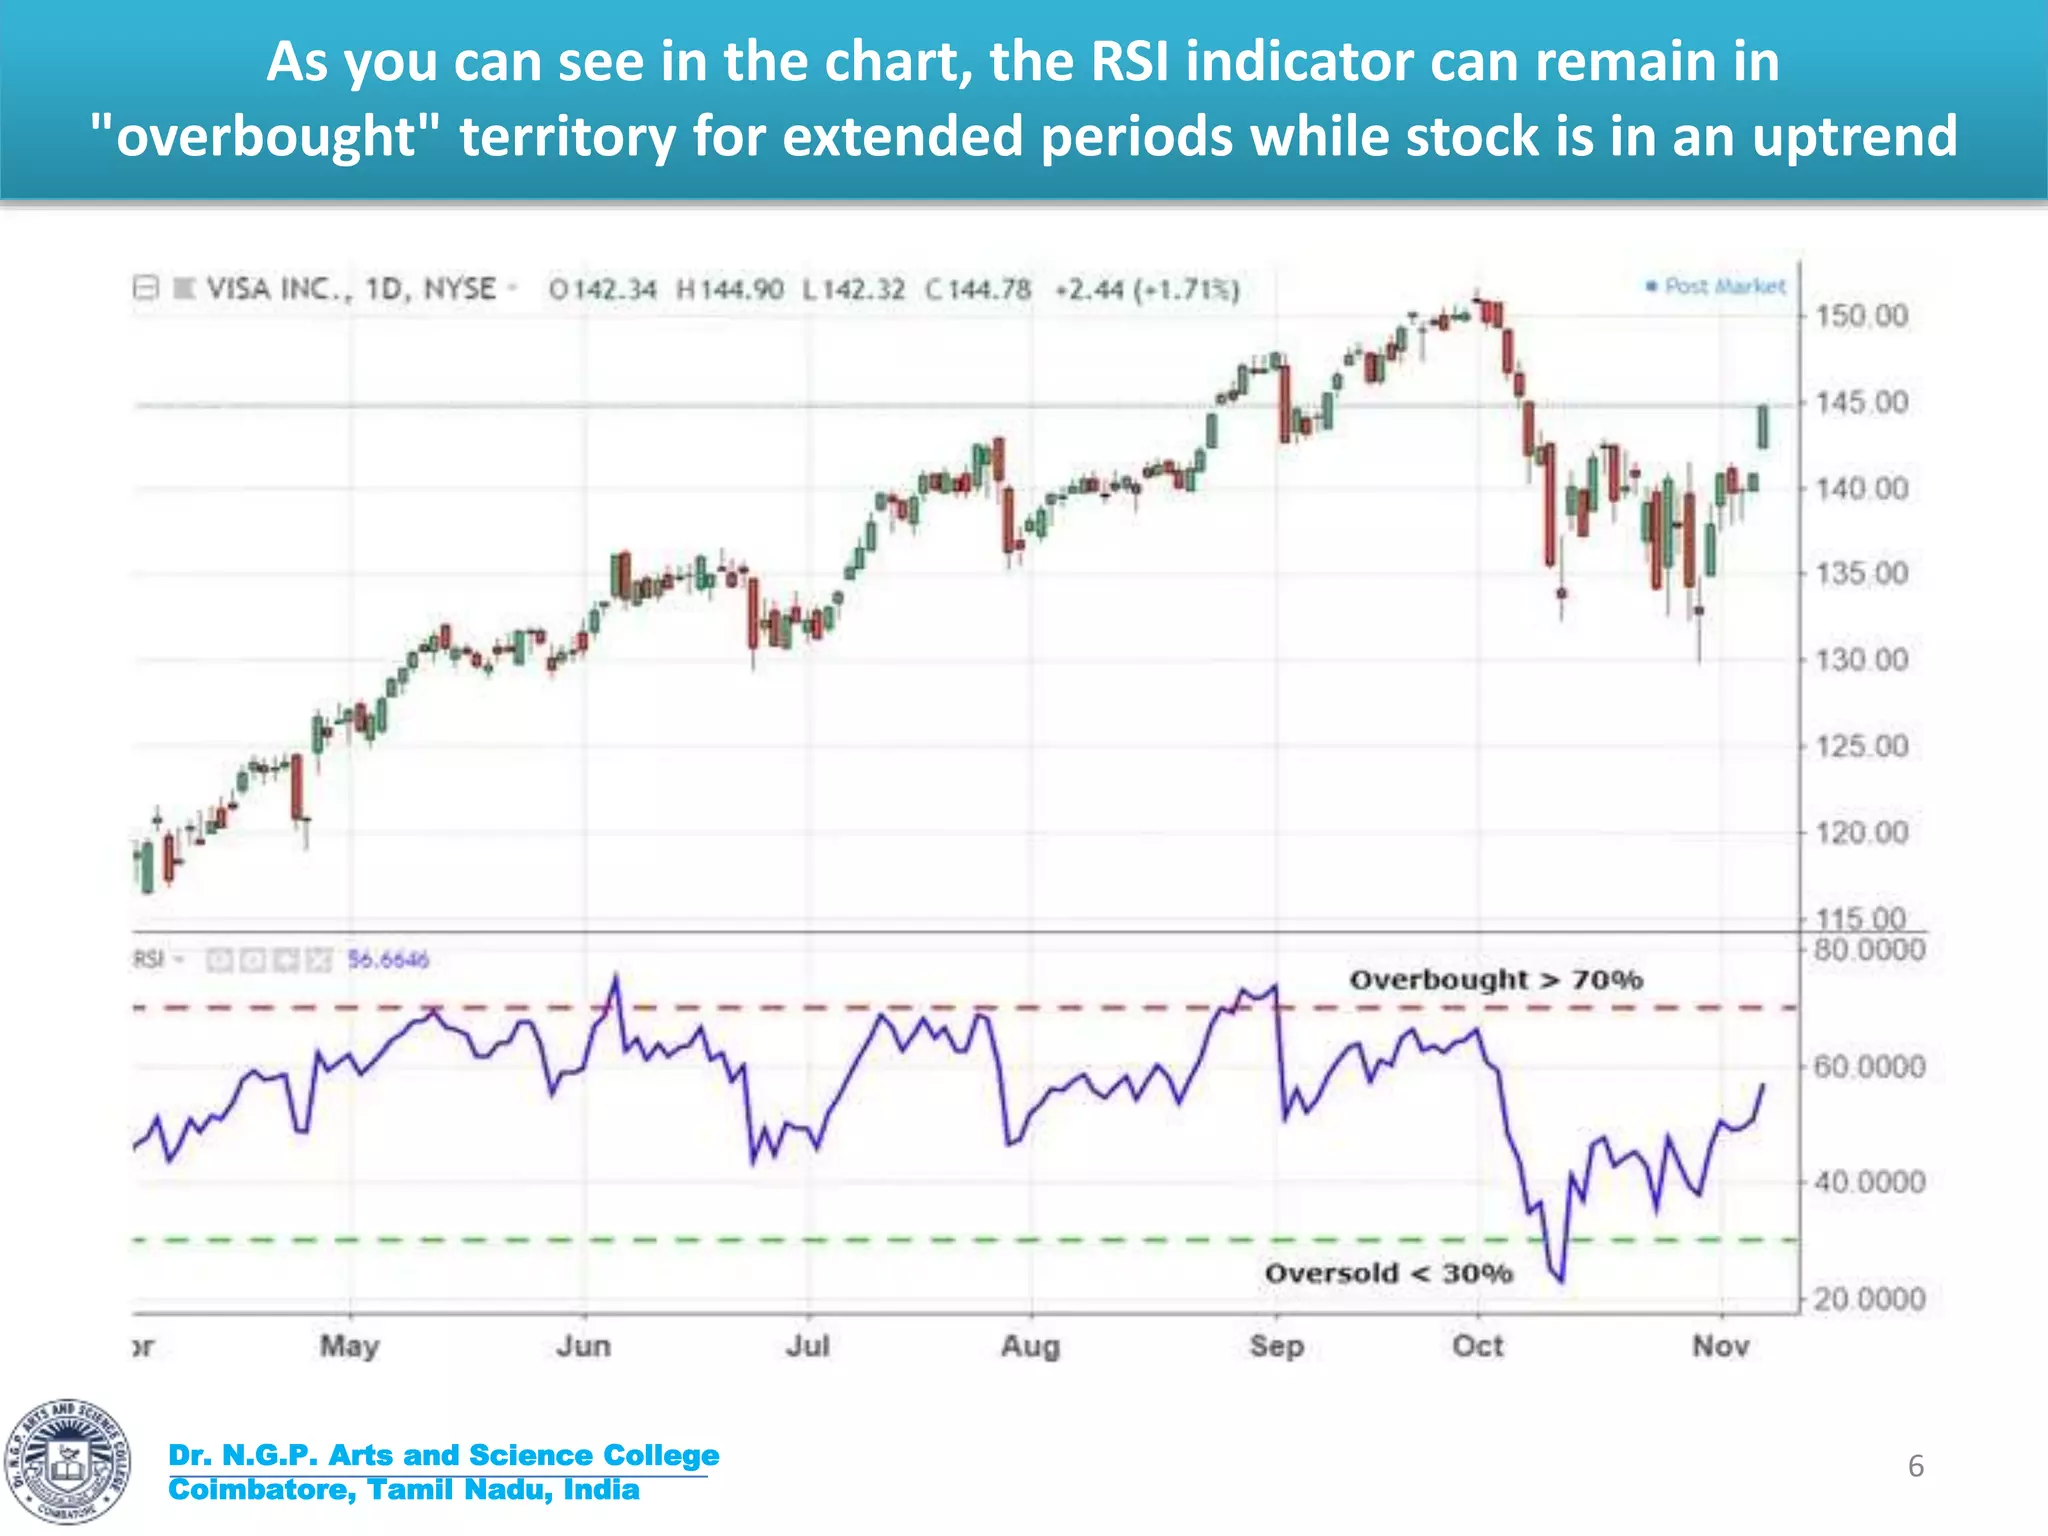
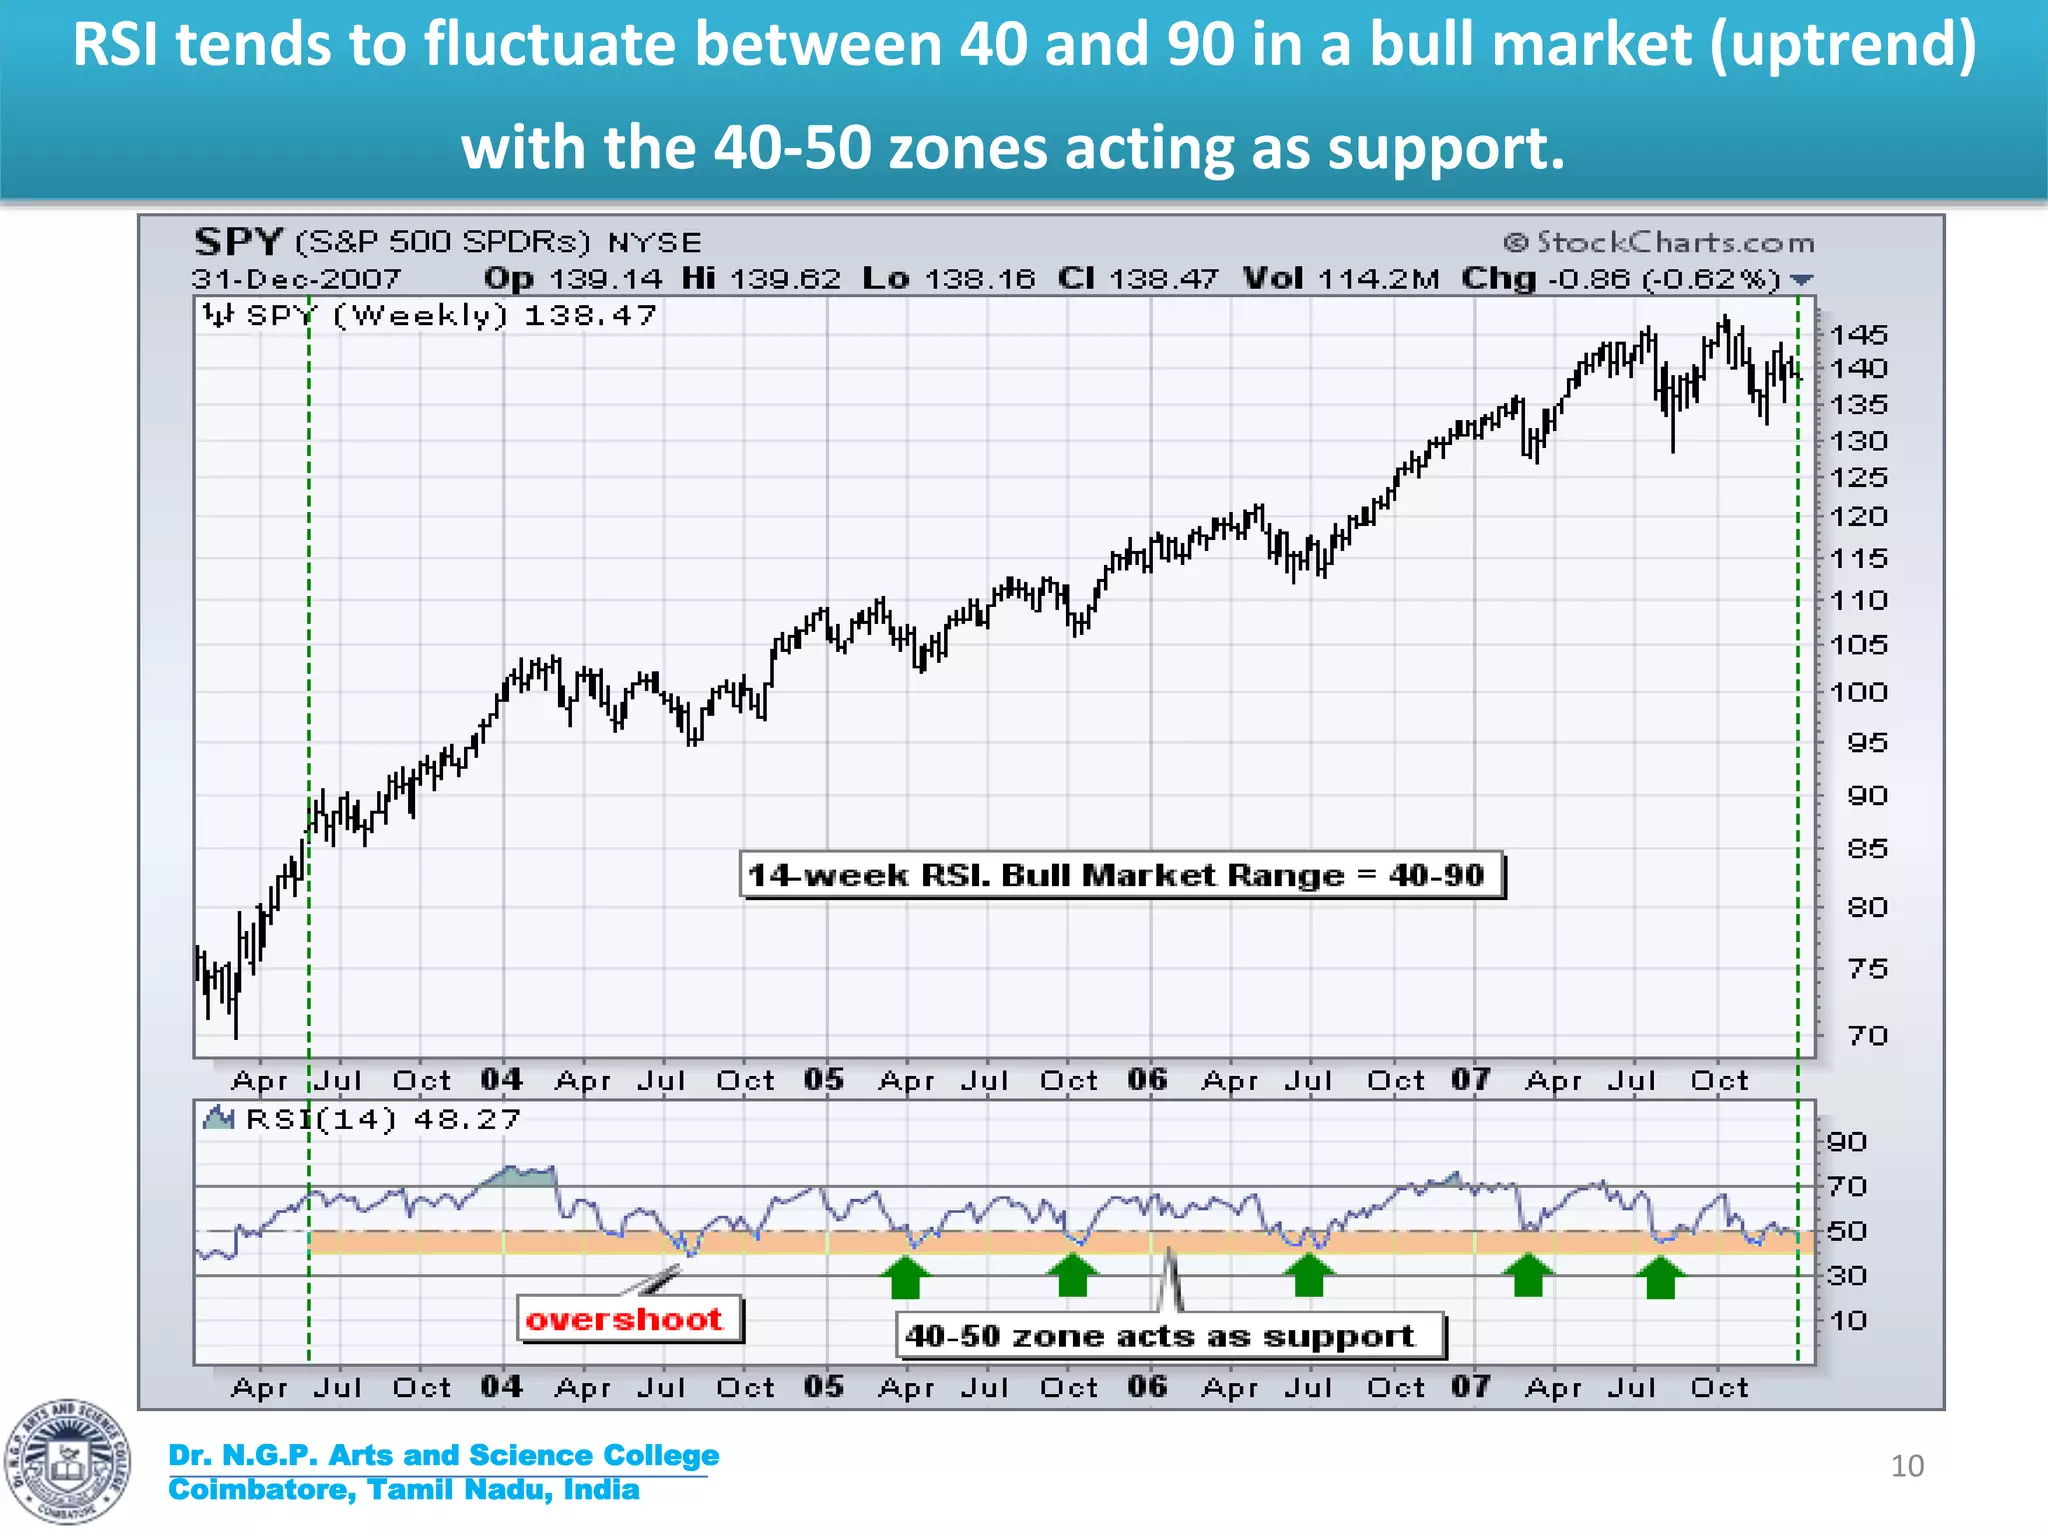
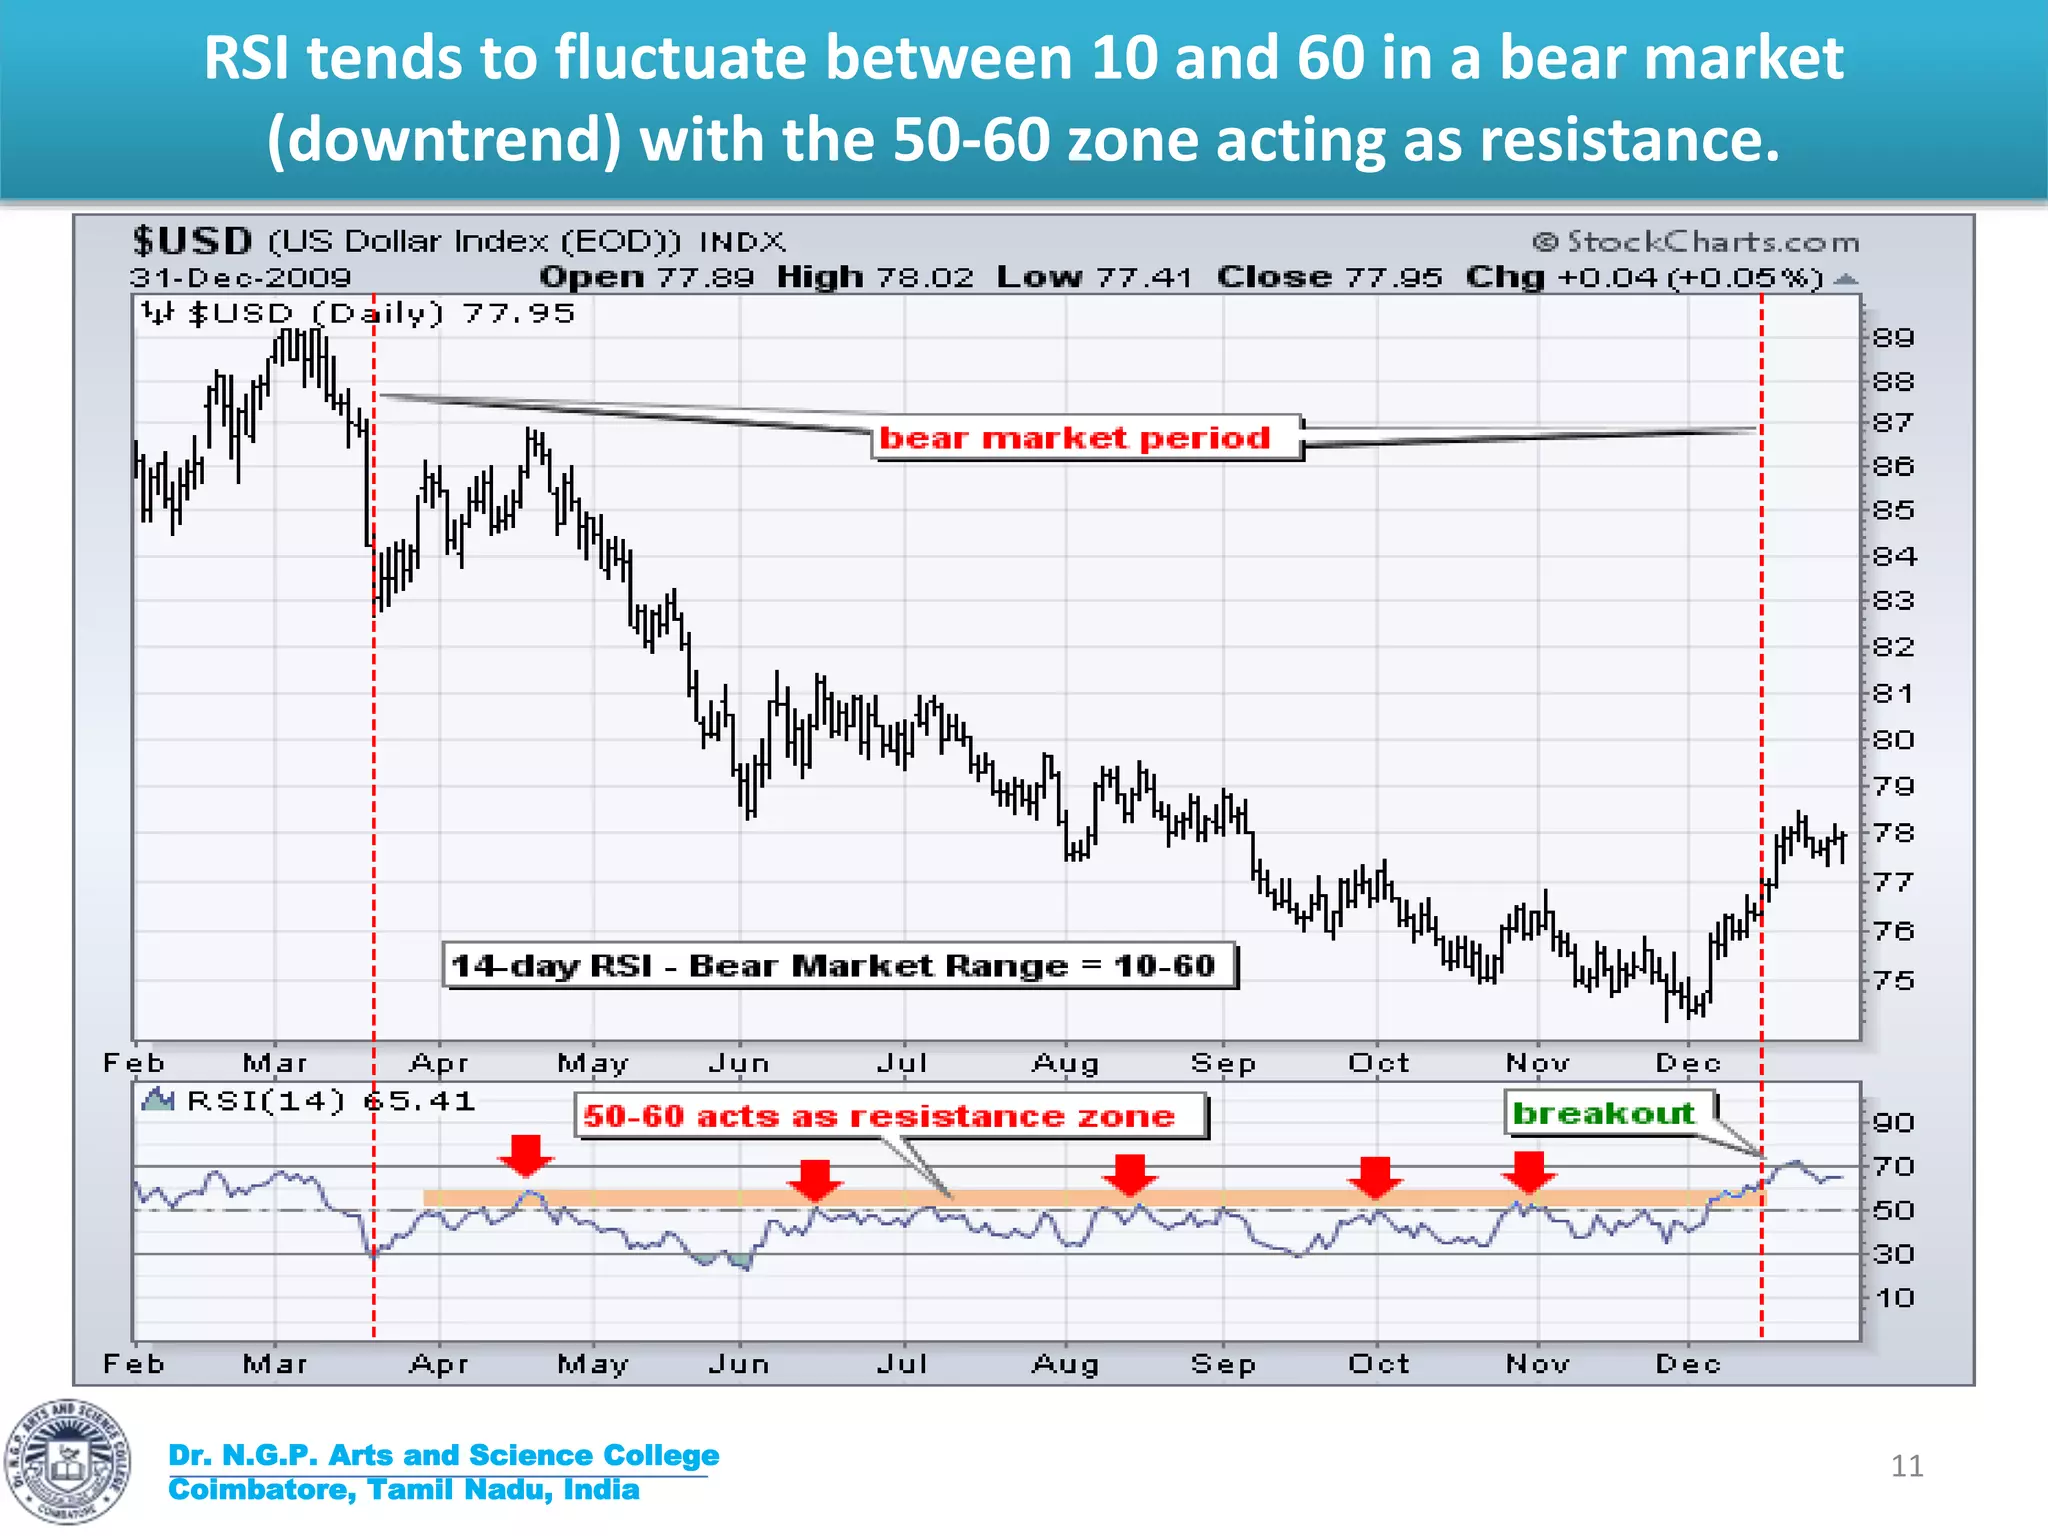
Relative Strength Index
1
Rajakrishnan M
Assistant Professor in Commerce CA
Fundamental and
Technical Analysis
Relative Strength Index – RSI
Dr. N.G.P. Arts and Science College
Coimbatore, Tamil Nadu, India
2
Developed by J. Welles Wilder, the
Relative Strength Index (RSI) is a
momentum indicator that measures
the magnitude of recent price
changes to evaluate overbought or
oversold conditions in the price of a
stock or other asset.
Calculation
Dr. N.G.P. Arts and Science College
Coimbatore, Tamil Nadu, India
3
Average Gain = Sum of Gains
over the past 14 periods / 14.
Average Loss = Sum of Losses
over the past 14 periods / 14
Overbought-Oversold
Dr. N.G.P. Arts and Science College
Coimbatore, Tamil Nadu, India
4
Wilder considered
RSI overbought when the
indicator is above 70
and oversold below 30.
The RSI will rise as the
number and size of
positive closes increase,
and it will fall as the
number and size of
negative closes increase.
Overbought-Oversold
Dr. N.G.P. Arts and Science College
Coimbatore, Tamil Nadu, India
5
As you can see in the chart, the RSI indicator can remain in
"overbought" territory for extended periods while stock is in an uptrend
Dr. N.G.P. Arts and Science College
Coimbatore, Tamil Nadu, India
6
Momentum oscillators
Dr. N.G.P. Arts and Science College
Coimbatore, Tamil Nadu, India
7
Despite this overbought reading, the stock did not
decline; instead, it stalled for a couple weeks and
then continued higher.
Three more overbought readings occurred before
the stock finally peaked in December (2).
Momentum oscillators can become overbought
(oversold) and remain so in a strong up (down)
trend.
Momentum oscillators
Dr. N.G.P. Arts and Science College
Coimbatore, Tamil Nadu, India
8
Divergences
Dr. N.G.P. Arts and Science College
Coimbatore, Tamil Nadu, India
9
RSI tends to fluctuate between 40 and 90 in a bull market (uptrend)
with the 40-50 zones acting as support.
Dr. N.G.P. Arts and Science College
Coimbatore, Tamil Nadu, India
10
RSI tends to fluctuate between 10 and 60 in a bear market
(downtrend) with the 50-60 zone acting as resistance.
Dr. N.G.P. Arts and Science College
Coimbatore, Tamil Nadu, India
11
Takeaway
Dr. N.G.P. Arts and Science College
Coimbatore, Tamil Nadu, India
12
The biggest takeaway is to make
sure that you have fully tested
your trading plan when using the
relative strength index trading
indicator. It’s a lot of work but
without testing, you will never
fully trust your trading strategy
and will never allow it to reach
it’s full potential.
Trading Plan
Dr. N.G.P. Arts and Science College
Coimbatore, Tamil Nadu, India
13
Identify the
Trend.
Look at
Moving
Average
Crossover.
Look at RSI
& MACD in
all time
frames.
Look at
candlestick
formation
all time
frames.
Support
and
Resistance
levels
Stop Loss
and Target
Analysis
Dr. N.G.P. Arts and Science College
Coimbatore, Tamil Nadu, India
14
15

Relative Strength Index

  • 1.
    Relative Strength Index 1 RajakrishnanM Assistant Professor in Commerce CA Fundamental and Technical Analysis
  • 2.
    Relative Strength Index– RSI Dr. N.G.P. Arts and Science College Coimbatore, Tamil Nadu, India 2 Developed by J. Welles Wilder, the Relative Strength Index (RSI) is a momentum indicator that measures the magnitude of recent price changes to evaluate overbought or oversold conditions in the price of a stock or other asset.
  • 3.
    Calculation Dr. N.G.P. Artsand Science College Coimbatore, Tamil Nadu, India 3 Average Gain = Sum of Gains over the past 14 periods / 14. Average Loss = Sum of Losses over the past 14 periods / 14
  • 4.
    Overbought-Oversold Dr. N.G.P. Artsand Science College Coimbatore, Tamil Nadu, India 4 Wilder considered RSI overbought when the indicator is above 70 and oversold below 30. The RSI will rise as the number and size of positive closes increase, and it will fall as the number and size of negative closes increase.
  • 5.
    Overbought-Oversold Dr. N.G.P. Artsand Science College Coimbatore, Tamil Nadu, India 5
  • 6.
    As you cansee in the chart, the RSI indicator can remain in "overbought" territory for extended periods while stock is in an uptrend Dr. N.G.P. Arts and Science College Coimbatore, Tamil Nadu, India 6
  • 7.
    Momentum oscillators Dr. N.G.P.Arts and Science College Coimbatore, Tamil Nadu, India 7 Despite this overbought reading, the stock did not decline; instead, it stalled for a couple weeks and then continued higher. Three more overbought readings occurred before the stock finally peaked in December (2). Momentum oscillators can become overbought (oversold) and remain so in a strong up (down) trend.
  • 8.
    Momentum oscillators Dr. N.G.P.Arts and Science College Coimbatore, Tamil Nadu, India 8
  • 9.
    Divergences Dr. N.G.P. Artsand Science College Coimbatore, Tamil Nadu, India 9
  • 10.
    RSI tends tofluctuate between 40 and 90 in a bull market (uptrend) with the 40-50 zones acting as support. Dr. N.G.P. Arts and Science College Coimbatore, Tamil Nadu, India 10
  • 11.
    RSI tends tofluctuate between 10 and 60 in a bear market (downtrend) with the 50-60 zone acting as resistance. Dr. N.G.P. Arts and Science College Coimbatore, Tamil Nadu, India 11
  • 12.
    Takeaway Dr. N.G.P. Artsand Science College Coimbatore, Tamil Nadu, India 12 The biggest takeaway is to make sure that you have fully tested your trading plan when using the relative strength index trading indicator. It’s a lot of work but without testing, you will never fully trust your trading strategy and will never allow it to reach it’s full potential.
  • 13.
    Trading Plan Dr. N.G.P.Arts and Science College Coimbatore, Tamil Nadu, India 13 Identify the Trend. Look at Moving Average Crossover. Look at RSI & MACD in all time frames. Look at candlestick formation all time frames. Support and Resistance levels Stop Loss and Target
  • 14.
    Analysis Dr. N.G.P. Artsand Science College Coimbatore, Tamil Nadu, India 14
  • 15.