Downloaded 203 times

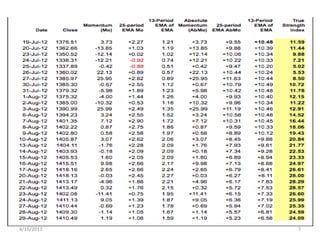
![Relative Strength Index - RSI
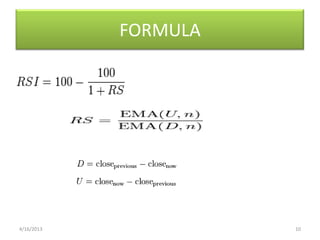
• The RSI is presented on a graph above or
below the price chart. The indicator has an
upper line, typically at 70, a lower line at
30, and a dashed mid-line at 50. Wilder
recommended a smoothing period of 14 (see
EMA smoothing, i.e. α = 1/14 or N = 27).
• [edit]
4/16/2013 9](https://image.slidesharecdn.com/momentumindicatorsintech-analysis-130416104648-phpapp01/85/Momentum-indicators-in-tech-analysis-9-320.jpg)
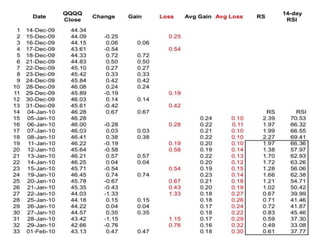
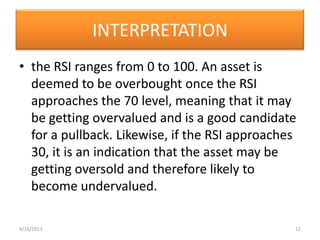
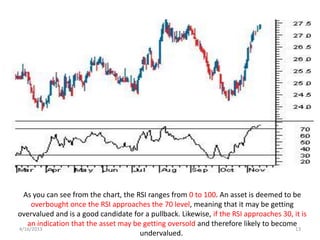
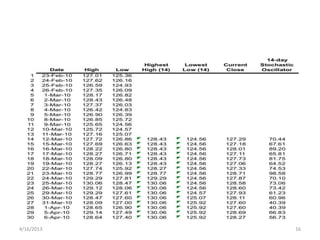
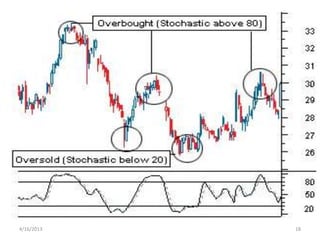
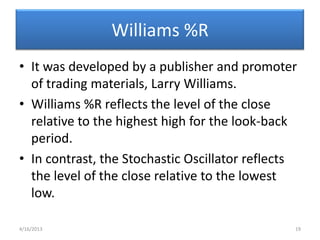
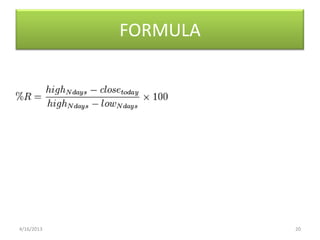
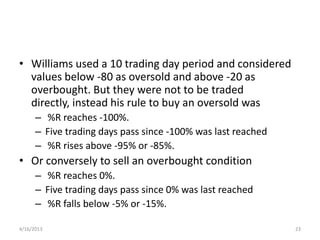


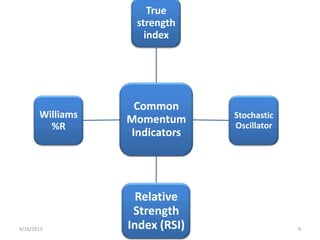
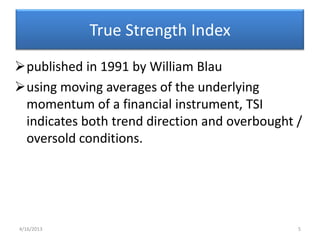
The document discusses several momentum indicators used in technical analysis: 1) The True Strength Index (TSI) uses exponential moving averages of momentum to indicate trend direction and overbought/oversold conditions. Values between +25 and -25 suggest the market may turn. 2) The Relative Strength Index (RSI) compares recent gains to recent losses to measure momentum. Values above 70 suggest an asset is overbought and below 30 means it is oversold. 3) The Stochastic Oscillator compares the current close to the high-low range to indicate if a stock is near the high or low end of its recent trading range. 4) The Williams %R reflects the


![Support and-resistance-simplified[1]](https://cdn.slidesharecdn.com/ss_thumbnails/support-and-resistance-simplified1-120113122100-phpapp01-thumbnail.jpg?width=640&height=640&fit=bounds)