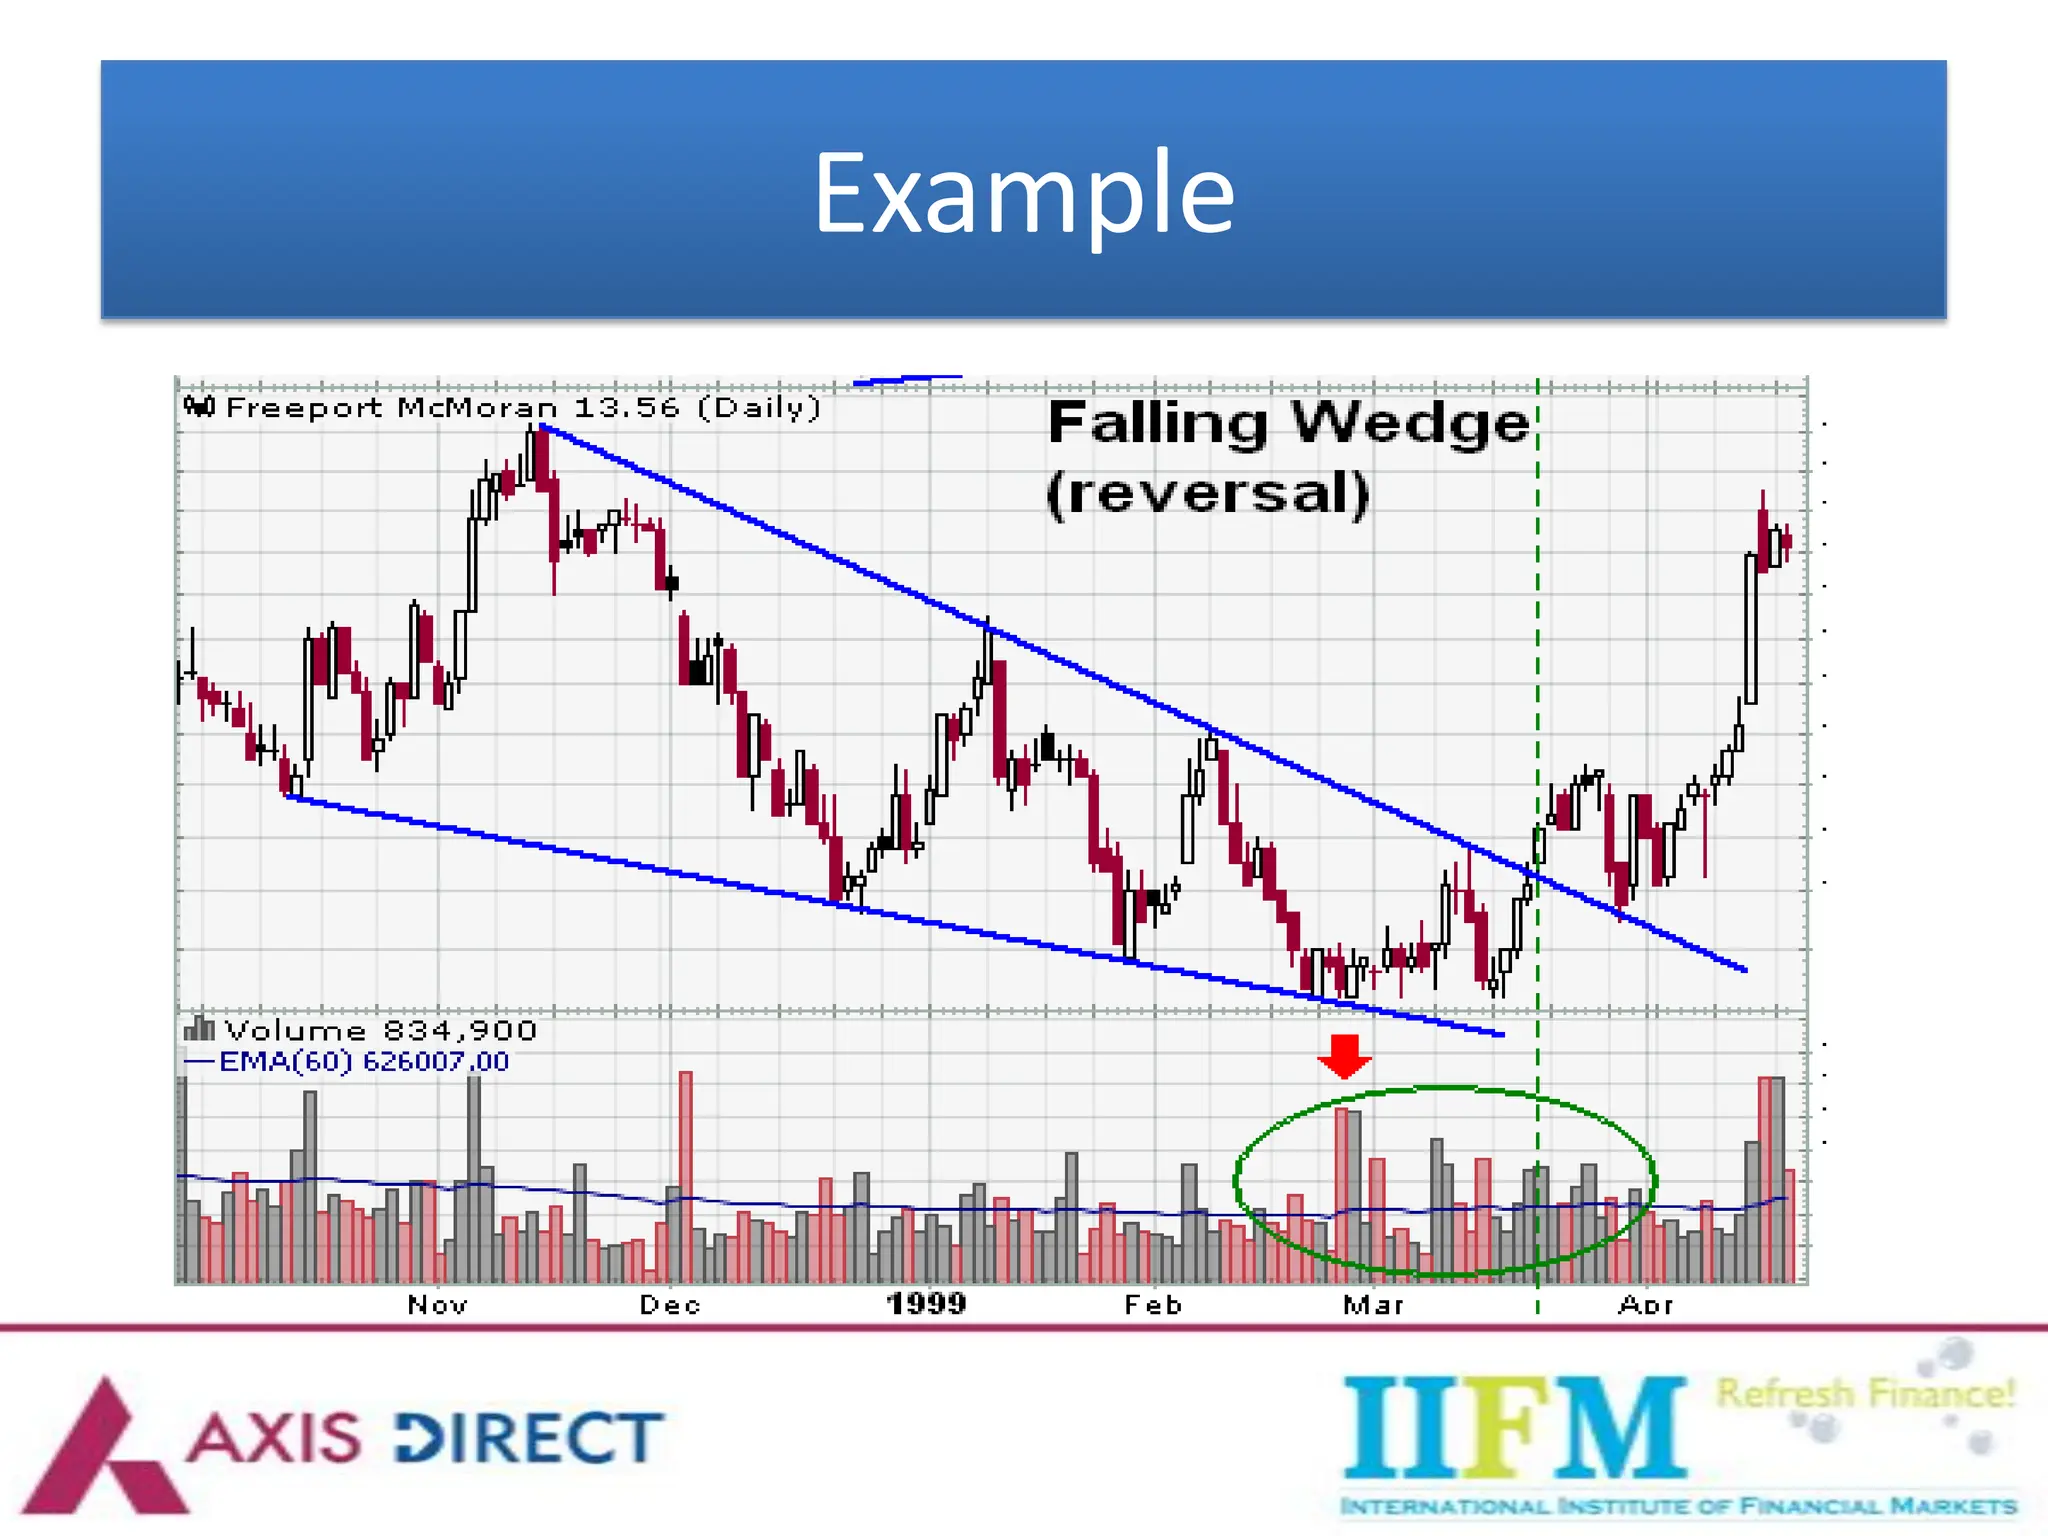
PRICE PATTERN IDENTIFICATION
Objective
One critical aspect of technical analysis is the identifying price
patterns. The topic discusses certain patterns are formed in the
price charts which tend to impact price movements in a
particular order.
Agenda
• Process
• Price pattern recognition
• Continual and Reversal Pattern
• Head & Shoulders Top and Bottom
• Double Top and Double Bottom
• Symmetrical Triangles
• Right Angle Triangle
• Wedge Formations
• Flags
• Minor Trend Change Indicators
• Gaps
Process
1. Direction of Major Price Trend
2. Internal Health of trend (V & OI)
3. Closest Support and Resistance levels
4. Look for orthodox price pattern
5. Determine measuring objective and the stop-out levels
6. Create a trading plan based
7. Do not force a conclusion; sometimes no trade is the best trade
8. Diversify the analysis
Price Pattern Recognition
• The patterns indicate the high probability direction of the
major price trend
 Carry specific measuring objectives and, most importantly
 Alert a trader where things are going wrong
• Rationale of price charts => supply and demand synthesized
into price
• Reversal patterns
• Continuation patterns
Continual and Reversal Pattern
• Continual Patterns
 Patterns in which major underlying trend continues
 Generally associated with a correction before trend resumes
 Exp: Symmetrical triangles
o Flags
o Wedges
• Reversal Patterns
 Patterns in which major underlying trend reverses
 Reversals generally happen before market sentiment changes(i.e.
before fundamental news change)
 Exp. Head and Shoulders
o Double Top, Double Bottom
Continual and Reversal Pattern
Head & Shoulder
• Most reliable (86-88%) reversal pattern
• Physically resembles a head & shoulders
• Precautions
 Presence of trend
 5 point reversal
 High Volume @ head
 OI decline @ head
 Declining Vol @Right shoulder
 Right shoulder lower than Head
 Close outside pattern
 SYMMETREY
Head & Shoulder
• Activation
 Close beyond pattern
• Measuring objective
 Perpendicular distance from neckline to Head
• When to ENTER ?
 Starts from breaking of pattern
• Stop Loss
 Head taken off
 Failsafe trendline
Head & Shoulder
Year Trend
Multiple H&S
CAUTION!!!
• Any H&S formation, Top or Bottom, cannot be expected to re-
trace more than the price move that preceded it
• This price extreme is the limiting factor if application of the
standard height objective results in a price beyond where the
previous price move began
CAUTION!!!
Double Top & Double Bottom
• Two price highs at approximately the same price level
• Prices must decline below and close below the low point
established in-between the two price highs before a Double
Top pattern has been officially activated
Double Top & Double Bottom
• Caution
 A ‘double’ formation is not all that reliable price pattern
 A ‘double’ formation, Top or Bottom, is not a common pattern on a
future or forward chart
• Measuring Objective
 Vertical height of the pattern is subtracted from the price low in-
between the two highs or lows
Double Top: Example
Double Bottom
Double Bottom Example
TRIPLE TOP
Symmetrical Triangle
• Continual Pattern
• Net sideways price movement on the chart, after which, a
significant directional price move ensues
• New price move can be in either direction - but there is an
overwhelming tendency for a valid triangle to act as a continuation
pattern
Symmetrical triangle
• ‘Works’ on all time frame charts
• Four reversals of the ‘minor’ price trend are necessary to
create the two converging boundary lines
• Any triangle is not an active pattern until a closing tic mark is
posted beyond one of the boundary lines
• The first reversal point (1) in any valid triangle is always at a
relative price high in a bull market or at a relative price low in
a bear market
• Volume usually moves irregularly lower
What’s Wrong ?
Pattern has not given a break out. Hence risky to enter a position
Triangle
• Breakout
 Associated with High Volume
 Breakout cannot occur too far into the pattern
o Too far is defined as more than 3/4 of the horizontal distance from
reversal point one to the apex
• Measuring Implication
 vertical height of the pattern
 Counted from reversal point 2
Triangle
• Pullback
 Underlying support (for an upside breakout) is created at the price
level of the breakout
 violation of the opposite boundary line or its extension beyond the
apex, even intra-price bar, Destroys the pattern
• Reliability of triangles: 76-78%
• Redrawing the Boundary Lines:
 Relocating point 3-4
Multiple triangles
Measuring Objective - Alternative
Measuring Objective is Reached: Close 3/4th of position
• If either boundary line is horizontal, the pattern that forms is
a relatively rare variation of the triangle; a 90 degree angle is
present
• This results in an Ascending (bullish) or Descending (bearish)
continuation pattern
• The market ‘wants’ to penetrate the horizontal line
• If both lines slope in the same direction, yet still converge, the
resulting pattern is a Rising or Falling Wedge
Measuring Objective - Alternative
Right Angle Triangles
• one of the boundary lines is horizontal, and
• a 90-degree angle is present - a right angle
• 4 point reversal
RIGHT TRIANGLE
• Stop loss order would ideally be placed slightly (say 2
minimum price tics) beyond the sloping boundary line
• Price is expected to move beyond the boundary line
penetrated, by the vertical height of the pattern
• Height is always measured from reversal point two
• High probability (75-80%)
• Rare patterns on forward or futures charts
• Right Triangles are likely to be more prevalent on a cash or
spot chart
Descending right triangle
Example: Descending Triangle
Example: Ascending Triangle
Wedge Formation
• Continuation pattern
• Four reversals of the minor trend for the two converging
boundary lines to be constructed
Rising wedge
Wedge
• Falling Wedge is a bullish pattern
• high volume close above the upper boundary line is necessary to activate the
pattern
• Minimum upside measuring objective of a Falling Wedge is to take out the highest
point in the pattern (reversal point one)
• Minimum downside measuring objective of a rising Wedge is to take out the
lowest point in the pattern (reversal point one)
Example
Example
Flags & Pennants
• Flags occur within the course of a ‘rapid, straight-line’ price
move
• Mark a half-way, breath-catching, resting place before the
prevailing trend resumes
• Flags normally slope against the trend
• On a daily futures chart, the body of the Flag seldom lasts
more than five trading sessions before a resumption of the
trend occurs
• Risk is small compared to the expected reward
• Trader knows quickly if the newly placed position is a winner
or loser
Flags & Pennants
• Minimum measuring objective => duplicating the rapid
straight-line price move that preceded it. Remove all positions
• Historical observation has shown that once a Flag objective
has been reached, a violent price move in the opposite
direction often occurs
• Any trailing protective stop order would more than likely be
executed
• Ideally there will no price activity in the price range of the Flag
for quite some time
• Flags work best on daily time frame charts
• No market can go below zero to the downside
Flags & Pennants
Flags & Pennants
Flag Example
Pennants Example
Pennants
Minor Trend Change Indicators
• Short term forecasting significance of minor trend change
indicators
 Key Reversal
 Inside Range
 Outside Range
 Mid-Range Close
• Aim : To identify what might happen the next trading session
• The end of a major price move could be signaled by one of
the minor trend change indicators
Key Reversal
• If there are three higher highs, the minor trend is considered
to be up
• After a series of higher price activity, a new high and a lower
close
Example
Key Reversal
• Key Reversal might mark the end of a major price move
• At key reversal high volume will result
• Losers are finally giving up!
“When the last weak short is finished buying, the silence is deafening”
• There are no more buyers - so price plummets
• This situation results in open interest declining
• The participants with the correct market judgement going into that
trading session are taking profits
• the loser is getting to the sidelines
• Both sides liquidate
Inside Range/Day
• Entire price bar’s activity is contained within the previous bar’s price range
• Moment is in one side
• 2nd side comes in and lot of volume action happens
• Rendering both positions in small range
• Likely to shift momentum in different direction
Outside Range
• A widely swinging market resulting in a price range where the
high is higher and the low is lower than the previous price
bar’s activity
Mid Range Close
• Prices close equidistant between the high and low of the price bar, a Mid-
Range Close is formed
• Trend previously in progress was not dominant going into the end of
trading for this time period
• There is an excellent probability that an adverse move against the minor
trend is about to occur
• Market is trying to change its short term direction
Gap Theory
• Gap is no overlap in prices from one trading session to next
• Used to identify
 Sideway consolidation
 Start of new price trend
 Likely termination of trend
 Continuation of a dynamic price move
Pattern Gap
• Occurs within a congestion area
• Quickly closed => within few trading sessions
• Also known as common or area gap
• One type of pattern gap not closed
Breakaway Gap
• At the beginning of new price
move
• Associated with penetration of
trendline
• Can also form on a new price
move into new high/ low
ground on chart
• Breakaway gap does not have
to be closed
• Indicates that trendline break
was definitely Significant
Measuring Gap or Runaway Gap
• Found during rapid straight line price move
• Sharp increase or decrease in investors’ interest
• Typically takes place at the middle or halfway point, of a trend
• If gap is filled, signals that prevailing trend is losing strength
and can end soon
Measuring Gap or Runaway Gap
Exhaustion Gap
• Signals end of a move
• These gaps are associated with a rapid,
straight-line advance or decline
• At the top with heavy volume
• Probable that the market is exhausted
and reversal is ahead
 Any open pattern
 Blowoff volume
 Gap wide (Largest)
 Minor trend change
 Change in OI
Gaps Example
Island Formations
• An Island Bottom is a bullish signal indicating a possible reversal of the
current downtrend to a new uptrend. This pattern is an indication of a
financial instrument's SHORT-TERM outlook
• The Island Bottom occurs when the price "gaps" below a specific price
range for a number of days and then is confirmed when the price "gaps"
above the original range

Technical analysis-Price paohgtterns.pdf

  • 1.
  • 2.
    Objective One critical aspectof technical analysis is the identifying price patterns. The topic discusses certain patterns are formed in the price charts which tend to impact price movements in a particular order.
  • 3.
    Agenda • Process • Pricepattern recognition • Continual and Reversal Pattern • Head & Shoulders Top and Bottom • Double Top and Double Bottom • Symmetrical Triangles • Right Angle Triangle • Wedge Formations • Flags • Minor Trend Change Indicators • Gaps
  • 4.
    Process 1. Direction ofMajor Price Trend 2. Internal Health of trend (V & OI) 3. Closest Support and Resistance levels 4. Look for orthodox price pattern 5. Determine measuring objective and the stop-out levels 6. Create a trading plan based 7. Do not force a conclusion; sometimes no trade is the best trade 8. Diversify the analysis
  • 5.
    Price Pattern Recognition •The patterns indicate the high probability direction of the major price trend  Carry specific measuring objectives and, most importantly  Alert a trader where things are going wrong • Rationale of price charts => supply and demand synthesized into price • Reversal patterns • Continuation patterns
  • 6.
    Continual and ReversalPattern • Continual Patterns  Patterns in which major underlying trend continues  Generally associated with a correction before trend resumes  Exp: Symmetrical triangles o Flags o Wedges
  • 7.
    • Reversal Patterns Patterns in which major underlying trend reverses  Reversals generally happen before market sentiment changes(i.e. before fundamental news change)  Exp. Head and Shoulders o Double Top, Double Bottom Continual and Reversal Pattern
  • 8.
    Head & Shoulder •Most reliable (86-88%) reversal pattern • Physically resembles a head & shoulders • Precautions  Presence of trend  5 point reversal  High Volume @ head  OI decline @ head  Declining Vol @Right shoulder  Right shoulder lower than Head  Close outside pattern  SYMMETREY
  • 9.
    Head & Shoulder •Activation  Close beyond pattern • Measuring objective  Perpendicular distance from neckline to Head • When to ENTER ?  Starts from breaking of pattern • Stop Loss  Head taken off  Failsafe trendline
  • 10.
  • 11.
  • 12.
  • 13.
    CAUTION!!! • Any H&Sformation, Top or Bottom, cannot be expected to re- trace more than the price move that preceded it • This price extreme is the limiting factor if application of the standard height objective results in a price beyond where the previous price move began
  • 14.
  • 15.
    Double Top &Double Bottom • Two price highs at approximately the same price level • Prices must decline below and close below the low point established in-between the two price highs before a Double Top pattern has been officially activated
  • 16.
    Double Top &Double Bottom • Caution  A ‘double’ formation is not all that reliable price pattern  A ‘double’ formation, Top or Bottom, is not a common pattern on a future or forward chart • Measuring Objective  Vertical height of the pattern is subtracted from the price low in- between the two highs or lows
  • 17.
  • 18.
  • 19.
  • 20.
  • 21.
    Symmetrical Triangle • ContinualPattern • Net sideways price movement on the chart, after which, a significant directional price move ensues • New price move can be in either direction - but there is an overwhelming tendency for a valid triangle to act as a continuation pattern
  • 22.
    Symmetrical triangle • ‘Works’on all time frame charts • Four reversals of the ‘minor’ price trend are necessary to create the two converging boundary lines • Any triangle is not an active pattern until a closing tic mark is posted beyond one of the boundary lines • The first reversal point (1) in any valid triangle is always at a relative price high in a bull market or at a relative price low in a bear market • Volume usually moves irregularly lower
  • 23.
    What’s Wrong ? Patternhas not given a break out. Hence risky to enter a position
  • 24.
    Triangle • Breakout  Associatedwith High Volume  Breakout cannot occur too far into the pattern o Too far is defined as more than 3/4 of the horizontal distance from reversal point one to the apex • Measuring Implication  vertical height of the pattern  Counted from reversal point 2
  • 25.
    Triangle • Pullback  Underlyingsupport (for an upside breakout) is created at the price level of the breakout  violation of the opposite boundary line or its extension beyond the apex, even intra-price bar, Destroys the pattern • Reliability of triangles: 76-78% • Redrawing the Boundary Lines:  Relocating point 3-4
  • 26.
  • 27.
    Measuring Objective -Alternative Measuring Objective is Reached: Close 3/4th of position
  • 28.
    • If eitherboundary line is horizontal, the pattern that forms is a relatively rare variation of the triangle; a 90 degree angle is present • This results in an Ascending (bullish) or Descending (bearish) continuation pattern • The market ‘wants’ to penetrate the horizontal line • If both lines slope in the same direction, yet still converge, the resulting pattern is a Rising or Falling Wedge Measuring Objective - Alternative
  • 29.
    Right Angle Triangles •one of the boundary lines is horizontal, and • a 90-degree angle is present - a right angle • 4 point reversal
  • 30.
    RIGHT TRIANGLE • Stoploss order would ideally be placed slightly (say 2 minimum price tics) beyond the sloping boundary line • Price is expected to move beyond the boundary line penetrated, by the vertical height of the pattern • Height is always measured from reversal point two • High probability (75-80%) • Rare patterns on forward or futures charts • Right Triangles are likely to be more prevalent on a cash or spot chart
  • 31.
  • 32.
  • 33.
  • 34.
    Wedge Formation • Continuationpattern • Four reversals of the minor trend for the two converging boundary lines to be constructed Rising wedge
  • 35.
    Wedge • Falling Wedgeis a bullish pattern • high volume close above the upper boundary line is necessary to activate the pattern • Minimum upside measuring objective of a Falling Wedge is to take out the highest point in the pattern (reversal point one) • Minimum downside measuring objective of a rising Wedge is to take out the lowest point in the pattern (reversal point one)
  • 36.
  • 37.
  • 38.
    Flags & Pennants •Flags occur within the course of a ‘rapid, straight-line’ price move • Mark a half-way, breath-catching, resting place before the prevailing trend resumes • Flags normally slope against the trend • On a daily futures chart, the body of the Flag seldom lasts more than five trading sessions before a resumption of the trend occurs • Risk is small compared to the expected reward • Trader knows quickly if the newly placed position is a winner or loser
  • 39.
    Flags & Pennants •Minimum measuring objective => duplicating the rapid straight-line price move that preceded it. Remove all positions • Historical observation has shown that once a Flag objective has been reached, a violent price move in the opposite direction often occurs • Any trailing protective stop order would more than likely be executed • Ideally there will no price activity in the price range of the Flag for quite some time • Flags work best on daily time frame charts • No market can go below zero to the downside
  • 40.
  • 41.
  • 42.
  • 43.
  • 44.
    Minor Trend ChangeIndicators • Short term forecasting significance of minor trend change indicators  Key Reversal  Inside Range  Outside Range  Mid-Range Close • Aim : To identify what might happen the next trading session • The end of a major price move could be signaled by one of the minor trend change indicators
  • 45.
    Key Reversal • Ifthere are three higher highs, the minor trend is considered to be up • After a series of higher price activity, a new high and a lower close
  • 46.
  • 47.
    Key Reversal • KeyReversal might mark the end of a major price move • At key reversal high volume will result • Losers are finally giving up! “When the last weak short is finished buying, the silence is deafening” • There are no more buyers - so price plummets • This situation results in open interest declining • The participants with the correct market judgement going into that trading session are taking profits • the loser is getting to the sidelines • Both sides liquidate
  • 48.
    Inside Range/Day • Entireprice bar’s activity is contained within the previous bar’s price range • Moment is in one side • 2nd side comes in and lot of volume action happens • Rendering both positions in small range • Likely to shift momentum in different direction
  • 49.
    Outside Range • Awidely swinging market resulting in a price range where the high is higher and the low is lower than the previous price bar’s activity
  • 50.
    Mid Range Close •Prices close equidistant between the high and low of the price bar, a Mid- Range Close is formed • Trend previously in progress was not dominant going into the end of trading for this time period • There is an excellent probability that an adverse move against the minor trend is about to occur • Market is trying to change its short term direction
  • 51.
    Gap Theory • Gapis no overlap in prices from one trading session to next • Used to identify  Sideway consolidation  Start of new price trend  Likely termination of trend  Continuation of a dynamic price move
  • 52.
    Pattern Gap • Occurswithin a congestion area • Quickly closed => within few trading sessions • Also known as common or area gap • One type of pattern gap not closed
  • 53.
    Breakaway Gap • Atthe beginning of new price move • Associated with penetration of trendline • Can also form on a new price move into new high/ low ground on chart • Breakaway gap does not have to be closed • Indicates that trendline break was definitely Significant
  • 54.
    Measuring Gap orRunaway Gap • Found during rapid straight line price move • Sharp increase or decrease in investors’ interest • Typically takes place at the middle or halfway point, of a trend • If gap is filled, signals that prevailing trend is losing strength and can end soon
  • 55.
    Measuring Gap orRunaway Gap
  • 56.
    Exhaustion Gap • Signalsend of a move • These gaps are associated with a rapid, straight-line advance or decline • At the top with heavy volume • Probable that the market is exhausted and reversal is ahead  Any open pattern  Blowoff volume  Gap wide (Largest)  Minor trend change  Change in OI
  • 57.
  • 58.
    Island Formations • AnIsland Bottom is a bullish signal indicating a possible reversal of the current downtrend to a new uptrend. This pattern is an indication of a financial instrument's SHORT-TERM outlook • The Island Bottom occurs when the price "gaps" below a specific price range for a number of days and then is confirmed when the price "gaps" above the original range