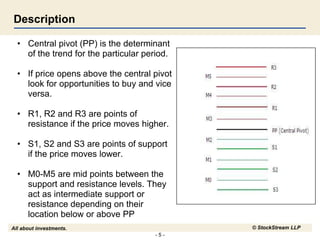
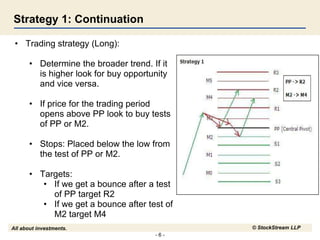
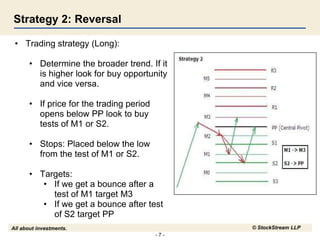
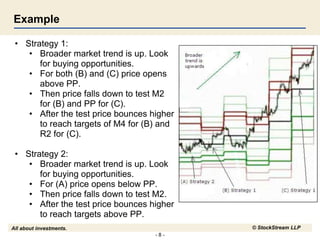
Investment InsightsInvestment Insights
Pivot Points
StockStream LLP
All about investments. © StockStream LLP
Disclaimer
• Trading carries significant risk of losses and may not be suitable for all
investors. Traders should assess these risks either themselves or in
consultation with a financial advisor before investing.
• There is no guarantee that the trading techniques, methods and other
information in this presentation will result in profits. The content in this
presentation in only intended for educational and informational
purposes and not intended as trading recommendation.
• The content of this presentation is subject to change without notice.
• Stockstream Financial Advisory Services LLP or mystockstream.com
will not take any liability or accountability of losses arising from the use
of information in this presentation in any manner.
- 3 -
All about investments. © StockStream LLP
StockStream Education Model
- 4 -
All about investments. © StockStream LLP
Introduction
• Pivot points provide support and resistance levels for a particular
trading period. For example, if you are using daily charts you will get
daily pivots, hourly charts will give hourly pivots, etc
• Pivot Points were conceived when there were no electronic systems
and were used by pit traders.
• Pivot Points are leading indicators of price action.
• Pivot points are calculated using price data for the previous trading
period.
- 5 -
All about investments. © StockStream LLP
Description
• Central pivot (PP) is the determinant
of the trend for the particular period.
• If price opens above the central pivot
look for opportunities to buy and vice
versa.
• R1, R2 and R3 are points of
resistance if the price moves higher.
• S1, S2 and S3 are points of support
if the price moves lower.
• M0-M5 are mid points between the
support and resistance levels. They
act as intermediate support or
resistance depending on their
location below or above PP
- 6 -
All about investments. © StockStream LLP
Strategy 1: Continuation
• Trading strategy (Long):
• Determine the broader trend. If it
is higher look for buy opportunity
and vice versa.
• If price for the trading period
opens above PP look to buy tests
of PP or M2.
• Stops: Placed below the low from
the test of PP or M2.
• Targets:
• If we get a bounce after a test
of PP target R2
• If we get a bounce after test of
M2 target M4
- 7 -
All about investments. © StockStream LLP
Strategy 2: Reversal
• Trading strategy (Long):
• Determine the broader trend. If it
is higher look for buy opportunity
and vice versa.
• If price for the trading period
opens below PP look to buy
tests of M1 or S2.
• Stops: Placed below the low
from the test of M1 or S2.
• Targets:
• If we get a bounce after a
test of M1 target M3
• If we get a bounce after test
of S2 target PP
- 8 -
All about investments. © StockStream LLP
Example
• Strategy 1:
• Broader market trend is up. Look
for buying opportunities.
• For both (B) and (C) price opens
above PP.
• Then price falls down to test M2
for (B) and PP for (C).
• After the test price bounces higher
to reach targets of M4 for (B) and
R2 for (C).
• Strategy 2:
• Broader market trend is up. Look
for buying opportunities.
• For (A) price opens below PP.
• Then price falls down to test M2.
• After the test price bounces higher
to reach targets above PP.
- 9 -
All about investments. © StockStream LLP
Questions
• Visit and register at mystockstream.com
• Follow and interact with StockStream Experts for answers
• StockStream Education
• StockStream Forex
• StockStream Commodity
• StockStream India

Pivot points

  • 1.
  • 2.
    All about investments.© StockStream LLP Disclaimer • Trading carries significant risk of losses and may not be suitable for all investors. Traders should assess these risks either themselves or in consultation with a financial advisor before investing. • There is no guarantee that the trading techniques, methods and other information in this presentation will result in profits. The content in this presentation in only intended for educational and informational purposes and not intended as trading recommendation. • The content of this presentation is subject to change without notice. • Stockstream Financial Advisory Services LLP or mystockstream.com will not take any liability or accountability of losses arising from the use of information in this presentation in any manner.
  • 3.
    - 3 - Allabout investments. © StockStream LLP StockStream Education Model
  • 4.
    - 4 - Allabout investments. © StockStream LLP Introduction • Pivot points provide support and resistance levels for a particular trading period. For example, if you are using daily charts you will get daily pivots, hourly charts will give hourly pivots, etc • Pivot Points were conceived when there were no electronic systems and were used by pit traders. • Pivot Points are leading indicators of price action. • Pivot points are calculated using price data for the previous trading period.
  • 5.
    - 5 - Allabout investments. © StockStream LLP Description • Central pivot (PP) is the determinant of the trend for the particular period. • If price opens above the central pivot look for opportunities to buy and vice versa. • R1, R2 and R3 are points of resistance if the price moves higher. • S1, S2 and S3 are points of support if the price moves lower. • M0-M5 are mid points between the support and resistance levels. They act as intermediate support or resistance depending on their location below or above PP
  • 6.
    - 6 - Allabout investments. © StockStream LLP Strategy 1: Continuation • Trading strategy (Long): • Determine the broader trend. If it is higher look for buy opportunity and vice versa. • If price for the trading period opens above PP look to buy tests of PP or M2. • Stops: Placed below the low from the test of PP or M2. • Targets: • If we get a bounce after a test of PP target R2 • If we get a bounce after test of M2 target M4
  • 7.
    - 7 - Allabout investments. © StockStream LLP Strategy 2: Reversal • Trading strategy (Long): • Determine the broader trend. If it is higher look for buy opportunity and vice versa. • If price for the trading period opens below PP look to buy tests of M1 or S2. • Stops: Placed below the low from the test of M1 or S2. • Targets: • If we get a bounce after a test of M1 target M3 • If we get a bounce after test of S2 target PP
  • 8.
    - 8 - Allabout investments. © StockStream LLP Example • Strategy 1: • Broader market trend is up. Look for buying opportunities. • For both (B) and (C) price opens above PP. • Then price falls down to test M2 for (B) and PP for (C). • After the test price bounces higher to reach targets of M4 for (B) and R2 for (C). • Strategy 2: • Broader market trend is up. Look for buying opportunities. • For (A) price opens below PP. • Then price falls down to test M2. • After the test price bounces higher to reach targets above PP.
  • 9.
    - 9 - Allabout investments. © StockStream LLP Questions • Visit and register at mystockstream.com • Follow and interact with StockStream Experts for answers • StockStream Education • StockStream Forex • StockStream Commodity • StockStream India