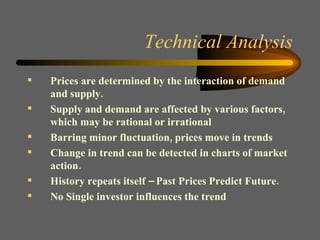
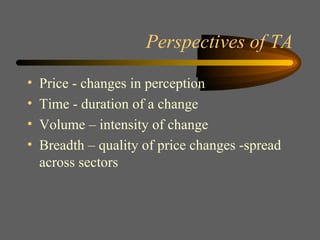
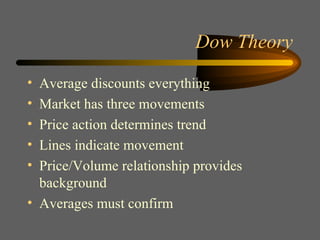
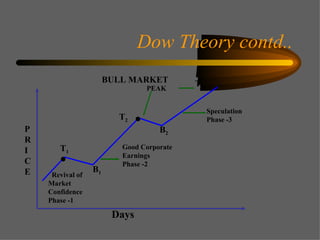
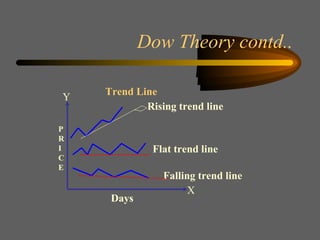
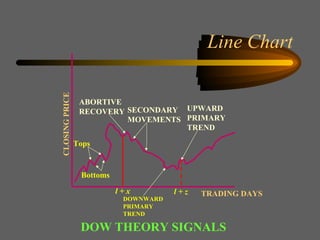
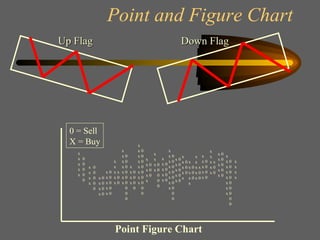
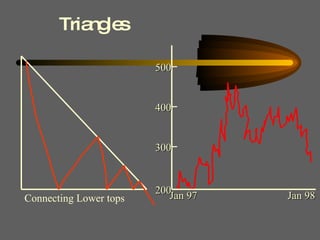
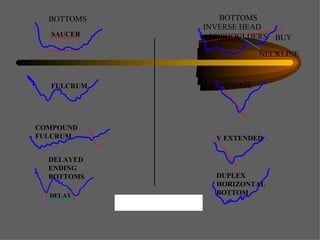
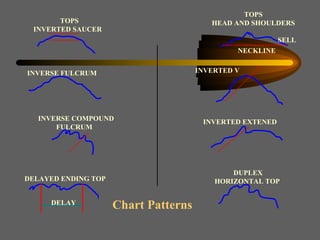
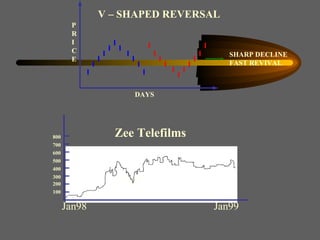
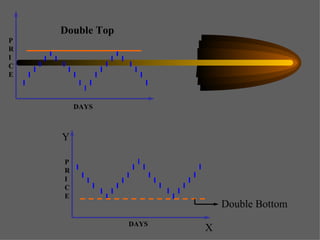
Technical Analysis
Technical Analysis Prices are determined by the interaction of demand and supply. Supply and demand are affected by various factors, which may be rational or irrational Barring minor fluctuation, prices move in trends Change in trend can be detected in charts of market action. History repeats itself – Past Prices Predict Future. No Single investor influences the trend
Perspectives of TA Price - changes in perception Time - duration of a change Volume – intensity of change Breadth – quality of price changes -spread across sectors
Dow Theory Average discounts everything Market has three movements Price action determines trend Lines indicate movement Price/Volume relationship provides background Averages must confirm
Dow Theory contd.. Revival of Market Confidence Phase -1 B 1 B 2 T 1 T 2 T 3 Good Corporate Earnings Phase -2 Speculation Phase -3 PEAK ● ● BULL MARKET PRICE Days
Dow Theory contd.. Falling trend line Flat trend line Rising trend line Trend Line Days P R I C E X Y
Tops Bottoms ABORTIVE RECOVERY SECONDARY MOVEMENTS UPWARD PRIMARY TREND DOWNWARD PRIMARY TREND l + x l + z TRADING DAYS CLOSING PRICE DOW THEORY SIGNALS Line Chart
Point Figure Chart 0 = Sell X = Buy Up Flag Down Flag Point and Figure Chart x x x x x x x x x x x x x 0 0 0 0 x  x 0 x 0 x 0 0 x  x 0 x 0 x 0 x  x  x 0 x 0 x 0 x 0 x  x 0 x 0 x 0 x  x  x  x x x 0 x 0 x 0 x 0 x 0 x 0 x 0 0 0 0 0 0 0 0 0 0 0 x x x 0 x 0 0 0 0 x 0 x 0 x 0 x 0 x 0 x  x  x x x 0 x 0 x  x 0 x 0 x 0 x 0 x 0 x 0 0 0 0 x  x 0 x 0 x 0 x 0 x 0 x 0 x 0 0 0 x  x 0 x 0 x 0 x 0 x 0 x 0 x 0 0 0 x 0 x 0 x 0 x 0 x 0 x  x 0 x 0 x 0 x  x  x 0 x 0 x 0 x 0 x  x  x x x 0 x 0 x  x 0 x 0 x 0 x 0 x 0 x 0 x 0 0 0 x x x x
Charts Line Charts Bar Charts Point & Figure Charts
Price Patterns Triangles Heads & Shoulders Double Tops & Bottoms Rectangles Flags Saucers & Rounding Tops Gaps
Triangles Connecting Lower tops 300 200 400 500 Jan 97 Jan 98
NECKLINE   Fig. Chart Patterns BOTTOMS   SAUCER   BOTTOMS   INVERSE HEAD ANDSHOULDERS  BUY   FULCRUM   V BASE   COMPOUND FULCRUM  V EXTENDED   DUPLEX HORIZONTAL BOTTOM  DELAYED   ENDING   BOTTOMS   DELAY
TOPS INVERTED SAUCER  TOPS HEAD AND SHOULDERS   SELL   NECKLINE   INVERSE FULCRUM   INVERSE COMPOUND FULCRUM  INVERTED V INVERTED EXTENED   DELAYED ENDING TOP   DELAY   DUPLEX HORIZONTAL TOP   Chart Patterns
P R I C E DAYS SHARP DECLINE FAST REVIVAL V – SHAPED REVERSAL Zee Telefilms Jan98 Jan99 100 200 300 400 500 600 700 800
Double Top P R I C E DAYS P R I C E DAYS Double Bottom X Y
Breadth of the Market A-D Line -  Stocks in positive trends %age of stocks over a moving average Diffusion indices - rate of change in prices (ROC) High-Low statistics
Theory of Contrary Opinions Odd-Lot theory  – Small Investors buying and selling shares are usually wrong in their actions. Odd-lot index is defined as – A decline in the index would indicate more purchases in relation to sales by the small investor indicating the optimistic attitude.
Theory of Contrary Opinions Mutual Funds Liquidity  – When mutual funds have high liquidity, it is believed that they are bearish, so analysts buy thinking that market is at low point. Conversely, the analysts sell when the mutual funds build large positions.
Stochastics Measures price velocity on the premise that when the prices increase, the closing prices have a tendency to be nearer to the highs and conversely, price have a tendency to be near to the lows. C-Latest Closing Price L- n periods low H-n periods high
Stochastics contd.. %K is smoothened to derive %D using simple moving average method. %D is n-period moving average of % K. A 14-day %K (14-period Stochastic Oscillator) would use the most recent close, the highest high over the last 14 days and the lowest low over the last 14 days. The number of periods will vary according to the sensitivity and the type of signals desired. %K tells us that the close (115.38) was in the 57th percentile of the high/low range, or just above the mid-point. Because %K is a percentage or ratio, it will fluctuate between 0 and 100. A 3-day simple moving average of %K is usually plotted alongside to act as a signal or trigger line, called %D.
 
 
Oscillators ROC Index  –  nth Day momentum index of advances and declines. 107.14 1540 429 1650 600 6 115.94 1511 511 1752 550 5 139.73 1334 600 1864 500 4 174.32 1184 400 2064 702 3 - - 334 - 662 2 - - 450 - 700 1 3-Day Momentum Index A/D*100 3-Days total of Declines (D) Declines 3-Days total of Advances  (A) Advances Day
Elliot Wave Principle R.N. Elliot formulated this idea in a series of articles in Financial World in 1939. Elliot believed that the market has a rhythmic regularity that can be used to predict future prices. The Elliot Wave Principle is based on a repeating 8-wave cycle, and each cycle is made up of similar shorter-term cycles (“Big fleas have little fleas upon their backs to bite 'em - little fleas have smaller fleas and so on ad infinitem”).
The Elliot Wave Principle

Technical Analysis

  • 1.
  • 2.
    Technical Analysis Pricesare determined by the interaction of demand and supply. Supply and demand are affected by various factors, which may be rational or irrational Barring minor fluctuation, prices move in trends Change in trend can be detected in charts of market action. History repeats itself – Past Prices Predict Future. No Single investor influences the trend
  • 3.
    Perspectives of TAPrice - changes in perception Time - duration of a change Volume – intensity of change Breadth – quality of price changes -spread across sectors
  • 4.
    Dow Theory Averagediscounts everything Market has three movements Price action determines trend Lines indicate movement Price/Volume relationship provides background Averages must confirm
  • 5.
    Dow Theory contd..Revival of Market Confidence Phase -1 B 1 B 2 T 1 T 2 T 3 Good Corporate Earnings Phase -2 Speculation Phase -3 PEAK ● ● BULL MARKET PRICE Days
  • 6.
    Dow Theory contd..Falling trend line Flat trend line Rising trend line Trend Line Days P R I C E X Y
  • 7.
    Tops Bottoms ABORTIVERECOVERY SECONDARY MOVEMENTS UPWARD PRIMARY TREND DOWNWARD PRIMARY TREND l + x l + z TRADING DAYS CLOSING PRICE DOW THEORY SIGNALS Line Chart
  • 8.
    Point Figure Chart0 = Sell X = Buy Up Flag Down Flag Point and Figure Chart x x x x x x x x x x x x x 0 0 0 0 x x 0 x 0 x 0 0 x x 0 x 0 x 0 x x x 0 x 0 x 0 x 0 x x 0 x 0 x 0 x x x x x x 0 x 0 x 0 x 0 x 0 x 0 x 0 0 0 0 0 0 0 0 0 0 0 x x x 0 x 0 0 0 0 x 0 x 0 x 0 x 0 x 0 x x x x x 0 x 0 x x 0 x 0 x 0 x 0 x 0 x 0 0 0 0 x x 0 x 0 x 0 x 0 x 0 x 0 x 0 0 0 x x 0 x 0 x 0 x 0 x 0 x 0 x 0 0 0 x 0 x 0 x 0 x 0 x 0 x x 0 x 0 x 0 x x x 0 x 0 x 0 x 0 x x x x x 0 x 0 x x 0 x 0 x 0 x 0 x 0 x 0 x 0 0 0 x x x x
  • 9.
    Charts Line ChartsBar Charts Point & Figure Charts
  • 10.
    Price Patterns TrianglesHeads & Shoulders Double Tops & Bottoms Rectangles Flags Saucers & Rounding Tops Gaps
  • 11.
    Triangles Connecting Lowertops 300 200 400 500 Jan 97 Jan 98
  • 12.
    NECKLINE Fig. Chart Patterns BOTTOMS SAUCER BOTTOMS INVERSE HEAD ANDSHOULDERS BUY FULCRUM V BASE COMPOUND FULCRUM V EXTENDED DUPLEX HORIZONTAL BOTTOM DELAYED ENDING BOTTOMS DELAY
  • 13.
    TOPS INVERTED SAUCER TOPS HEAD AND SHOULDERS SELL NECKLINE INVERSE FULCRUM INVERSE COMPOUND FULCRUM INVERTED V INVERTED EXTENED DELAYED ENDING TOP DELAY DUPLEX HORIZONTAL TOP Chart Patterns
  • 14.
    P R IC E DAYS SHARP DECLINE FAST REVIVAL V – SHAPED REVERSAL Zee Telefilms Jan98 Jan99 100 200 300 400 500 600 700 800
  • 15.
    Double Top PR I C E DAYS P R I C E DAYS Double Bottom X Y
  • 16.
    Breadth of theMarket A-D Line - Stocks in positive trends %age of stocks over a moving average Diffusion indices - rate of change in prices (ROC) High-Low statistics
  • 17.
    Theory of ContraryOpinions Odd-Lot theory – Small Investors buying and selling shares are usually wrong in their actions. Odd-lot index is defined as – A decline in the index would indicate more purchases in relation to sales by the small investor indicating the optimistic attitude.
  • 18.
    Theory of ContraryOpinions Mutual Funds Liquidity – When mutual funds have high liquidity, it is believed that they are bearish, so analysts buy thinking that market is at low point. Conversely, the analysts sell when the mutual funds build large positions.
  • 19.
    Stochastics Measures pricevelocity on the premise that when the prices increase, the closing prices have a tendency to be nearer to the highs and conversely, price have a tendency to be near to the lows. C-Latest Closing Price L- n periods low H-n periods high
  • 20.
    Stochastics contd.. %Kis smoothened to derive %D using simple moving average method. %D is n-period moving average of % K. A 14-day %K (14-period Stochastic Oscillator) would use the most recent close, the highest high over the last 14 days and the lowest low over the last 14 days. The number of periods will vary according to the sensitivity and the type of signals desired. %K tells us that the close (115.38) was in the 57th percentile of the high/low range, or just above the mid-point. Because %K is a percentage or ratio, it will fluctuate between 0 and 100. A 3-day simple moving average of %K is usually plotted alongside to act as a signal or trigger line, called %D.
  • 21.
  • 22.
  • 23.
    Oscillators ROC Index – nth Day momentum index of advances and declines. 107.14 1540 429 1650 600 6 115.94 1511 511 1752 550 5 139.73 1334 600 1864 500 4 174.32 1184 400 2064 702 3 - - 334 - 662 2 - - 450 - 700 1 3-Day Momentum Index A/D*100 3-Days total of Declines (D) Declines 3-Days total of Advances (A) Advances Day
  • 24.
    Elliot Wave PrincipleR.N. Elliot formulated this idea in a series of articles in Financial World in 1939. Elliot believed that the market has a rhythmic regularity that can be used to predict future prices. The Elliot Wave Principle is based on a repeating 8-wave cycle, and each cycle is made up of similar shorter-term cycles (“Big fleas have little fleas upon their backs to bite 'em - little fleas have smaller fleas and so on ad infinitem”).
  • 25.
    The Elliot WavePrinciple